|
|
|
19:51 |
|
|
transcript
|
0:53 |
Hey there, welcome to MongoDB for async Python with Beanie and Pydantic. I'm so excited that you're interested in this course. It is such a cool set of technologies that we're going to bring together here and it's really, really empowering. In this chapter, we're going to introduce the course, talk about MongoDB a little bit, why people love it and care about it, some of the libraries and frameworks we're going to use, how do we use async Python to talk to MongoDB, how do we do that with Pydantic and Beanie. And we're also going to talk about what you'll learn throughout this course. Just going to get everything set up, set the stage, and then we'll be able to dive into actually writing some code soon. I hope you're excited for this journey. It's going to be a great time. Come along with me.
|
|
|
transcript
|
3:06 |
When you think about databases, MongoDB is really popular and really loved. Let's look at the stack overflow trends that shows the popularity of different databases over time on their platform, which is a pretty good proxy for general interest in a technology. So you can see here that when MongoDB launched in 2010, it took off pretty quickly and caught up with Postgres. Postgres has actually been growing quite a bit here, which is really impressive. Postgres is definitely coming on strong as well. There's Microsoft SQL Server, which was this brown line, used to be super popular, but it's certainly trending down and now is, I guess, depending on how you measure it, a little under or just tied with MongoDB, which is saying a lot given that database's usage inside large enterprises and medium to large businesses. So MongoDB, while not the absolute most popular database, is certainly one of the most popular databases out there. Which one's the most popular? Postgres? No, I would say the most popular is Excel. Now, I mean, it's not really a server, right? But people use it for one all the time. But amongst the formal database servers meant to handle lots of traffic with concurrent users in a traditional ACID type of sense, well, MongoDB is certainly up there. MongoDB is also very loved from the 2022 stack overflow survey, the most recent one we have results for now in 2023. We can see that it is one of the most loved databases. Again, Postgres is up there, right, but it's a relational database. I know it has JSON fields, but it's not the same. MongoDB is certainly the most popular document database and honestly, compared to pretty much any other database whatsoever. It is one of the most loved out there. They do have Redis here. And I would say Redis is not really a database. I don't know why they decided to put this in here. So in my categorization, MongoDB is the number two most loved database as well, which is pretty awesome, honestly. And finally, MongoDB from that same survey is also very much wanted. When they ask, Hey, is there a database technology that you are not currently using that you want to use? Well, again, as you might expect, the popular ones show up Postgres and MongoDB are the most wanted, again, even over Redis in terms of compared to how it was loved, I guess. So MongoDB is a great choice, because many people want to use it, you'll be able to find teammates excited to work with you on it, be able to find people who are excited to take jobs or do consulting gigs to work with you. And if you're on the other side, if you have MongoDB skills, you'll be very valuable to teams looking to invest in Mongo. So it's not the only thing that matters about databases, whether or not they're popular and loved and wanted, but it's certainly not bad, is it?
|
|
|
transcript
|
3:44 |
One of the reasons that MongoDB is loved is because it's fast. Not only is it fast, it's actually quite easy to build applications that are fast with MongoDB as well. You don't have to think so much about joins and all of these types of things, as we'll see. So you're taking this course here at Talk Python Training. Let's give you some numbers. Let's give you some perspective on an app that I hope I imagine felt really quick to you and how that's working running on top of MongoDB. Over here we have our courses page. Here we've got quite a number of courses. We've got which ones are new. We've got which ones are free. We've got all sorts of information about them, when they were released, their pricing and so on. Now on this particular page, you can see it has account and logout, so it has to have information about who is logged in, as well as the courses and other things. So on this particular page, there are four separate MongoDB queries, plus the page logic. And if we measure the time of request hits the web server, not the database hits the web server, does all that logic and processing can it calls MongoDB four times, it takes those results back, it turns them into Python objects, then it turns that into HTML and HTML is then rendered back out so complete round trip, not just to the database, but actually through the web request and the end, those four requests, only 33 milliseconds on average for this page, 33 milliseconds and this is on a 10 or $20 server. This is not on some insane, hugely expensive server running in the cloud. It's a pretty standard one. So if most websites out there had 33 millisecond response times, the web would be a better place, wouldn't it? One more. When you go to watch a course on our website, there's a whole lot of information that has to come back. Maybe the course has 50 or 100 videos that are associated with it. We like to keep our videos really short so you can jump around and use them as reference. We need to know how long is this course, what is this repository, what are all of its chapters and lectures, do those lectures have transcripts, again are you logged in, do you have permission to access this, many things. For this page, we actually have 10 MongoDB queries, which surprised me when I went to check that out. That's fine. 10 queries plus the page logic and some of those collections, MongoDB's term for tables, have millions of records in them. And we need to get many results, but you know, focus down to you and this particular course, but still many results back potentially from those millions that are in there. How long does this take? It must take forever, right? It must just spin and spin. Nope. had it an entire four milliseconds for this particular page. None of this is cached, not the example before, not this one. These are live requests going through Python talking to the database every single time. How awesome is that? Such a cool system we got going here. Not because we're awesome, but because we built on awesome technology such as MongoDB. of the techniques I've used to make this page incredibly fast. I'm going to teach you throughout this course. Some are obvious, some not so much, and I think you'll really enjoy it.
|
|
|
transcript
|
2:41 |
Another important technology that we're going to focus on in this course is Python's asyncio. When you see that async and await keywords in Python, that's what we're talking about. Now, many of you may have preconceived notions about parallelism, about multiple cores and multi processing and threads and all those things. And in Python, well, pretty much any of the asyncio frameworks, even outside of Python, they're a little bit different. So for example, if you were to go create a thread in Python to try to do concurrent work, first of all, you'd hit the GIL, that's a bit of a problem. But it would go and create an operating system thread that does something separate for that work. And then you can sort of exchange data through shared variables. Multiprocessing is like that as well, but it uses a separate process. But asyncio, it's a little bit different. By default, in asyncio, there are no threads, there's one thread, the main thread that you're working on, it does all that work, all that concurrent work on the same thread. But it does it by saying, let's take instead of doing one big block of work, like let's query the database and wait for MongoDB to respond, it says, let's begin querying the database. And then we're also going to have another part of that work, which is receiving the response and then you'll maybe deserializing it and so on. We might be doing other work at sort of the same time. So the idea is we're going to break up these jobs, like let's say this green one is querying MongoDB. Instead of just one big long blocking bit, we're going to break it up into these pieces. And where we're waiting, we can interleave other ones. So for example, we can have some task like talking over a network for an API call might be happening here. This one here, this one's MongoDB. First we start the query, then we check on it, then we get the response, and then we deserialize it, so on. So we're going to spend a whole chapter talking about how does async I/O work? How do we do this with Python code and making sure your foundations for asyncio are really solid. Now, a lot of times people say, concurrency is really hard. Don't do it. Parallelism is super hard. All you're going to do is make mistakes. Don't do it. I don't really believe that it's not that hard. The code that you write is almost identical. There's a few new keywords, but they're pretty straightforward to use. you kind of got to get your mind into a different space, but programmatically it's not that different, but there's a ton of advantages as we'll see throughout this course. And what's really awesome is Beanie is going to allow us to do async I/O against MongoDB.
|
|
|
transcript
|
4:28 |
Speaking of Beanie, we're going to be using the Beanie ODM. What is that? Well, you look at their doc here, it says Beanie is an asynchronous Python object document mapper for MongoDB, and the data models are based on Pydantic. Let's take that apart. Asynchronous, that means we can use or I guess really have to use async and await to talk to it, which means Beanie will automatically break up interacting with the database into the hotspots where we're actually working with it, and allow us to interleave other work. While we're waiting on MongoDB, or on the network, or on DNS, or you know, whatever's happening to complete that database query or insert, we could be doing other database calls also to that same database server. Or we could just be processing more requests, we could be calling API's, who knows what but asynchronous like we just talked about, it's going to allow us to do that. Object document mapper, ODM, you're probably familiar with the term ORM, but document databases, of which MongoDB is one, generally don't have relationships. There are ways to model relationships, but they're strongly de-emphasized. So what we get out of MongoDB are documents, not records, and so we have an object document mapper just a little bit more accurate acronym. But think ORM, but for document databases. And finally, Pydantic. Pydantic is an incredible way to model classes. It supports serialization from JSON, it supports transformation and validation. It's type safe, really, really cool technology. And if you're using things like FastAPI or other tools that use pydantic? Well, guess what, it's really awesome that your database model, and maybe your API model can be compatible, or maybe even the same some of the time. So beanie, an async Python ODM, or MongoDB based on pydantic. Really awesome. Now before we dive into learning about MongoDB and some of the asyncio stuff and pydantic foundations, I want to give you a quick, quick glance, a little bit of a preview of what it's like to create a class that matches a MongoDB document and how we query that with Beanie and async and await. So in this example here, we've got some code, we create an embedded part of our document called category that has a name and description. And then we have a product that has also a name and description a price, this one is indexed. And here you can see the embedded categories there. Also in the class, we have a inner class called settings that allows us to configure how the ODM match it maps over to MongoDB. For example, what is the name of the collection, what indexes are there, and so on. Pretty clean way to create classes, right? And once you have those, how do you query them? Well, there's a bunch of cool examples on the documentation. But let's just see how we might go to our product database and find all the ones that are in the category chocolate. There's a few interesting aspects here. Notice it says chocolates equals await product dot find. So instead of just saying product dot find and blocking, we say await that allows us to break our code into these smaller tasks that we saw earlier. So that's the only difference to do the async stuff, but it's awesome, right? And then notice our product class had the categories field in the categories had a name and a description. So we can automatically traverse that hierarchy within the document by just saying product dot category dot name, equal equal, the value we're trying to search for, as well as the price being less than $5. So this query is going to give us all the chocolate items that cost less than five units, I'm guessing dollars, euros, something like that. And then we can call to list to serialize that in memory into a list. Alternatively, it could have been a cursor that we could work across, but to list is good if you want to have it all at once. All right. So really cool way to create classes that model documents, including the nested ones and a really slick way to query them, both from a how do I talk about the query itself as well as the async and await.
|
|
|
transcript
|
3:44 |
What are we going to cover in this course? Well, we're going to have an introductory chapter that tells you about everything like this. You are here. You know what that's about. We're going to talk about what are document databases and how do they work in general, as well as a technical overview of some of the MongoDB internals, how it works, how does it allow you to query things that are nested deep within some kind of document, as we just saw. We're going to do a few foundational topics. And we saw these important building blocks, asyncio, Pydantic and so on. So we're going to have a few chapters that make sure you really understand those super well, because they're an important part to making all of this fit together. First one of those is Pydantic. Then we're going to do asyncio as well. Then we'll take a couple passes about building with and learning about Beanie. We're going to do a Beanie quick start. Like what is the simple, minimal application and that we can get set up to just see all the moving parts and how it works. And then we're gonna look at modeling a cool, well-known place, well-known dataset with documents or how that might look and what is the difference of modeling if you have a relational database and you're aiming for third normal form and foreign key constraints and all of that? Well, how does that change in a document database? We'll talk about that. Speaking of a realistic data source, We're going to model the PyPI data, so pypi.org with packages and releases and maintainers and users, all of that. We're gonna model that with Beanie and Pydantic classes. And then we're gonna take that classes and the Beanie interaction that we've already created with the queries and collections and all that. And we're gonna plug that into FastAPI and give us a really cool example of, Well, here's an end to end API talking about this pi pi data that we've modeled, but also how does it fit into a web framework, especially one that's Pydantic friendly, let's say, when I told you that MongoDB was fast, there was a couple of techniques that I had in mind, because it's not always fast out of the box. If you just throw a bunch of data in it, and you start doing queries, you might be really disappointed, could be really, really slow for a whole bunch of reasons. So we're going to look at all the ways and knobs that we can turn, as well as programming techniques we can apply to make MongoDB go from who knows, maybe a one second response time to a 10 millisecond response time, you know, 100 times faster, maybe even 1000, who knows. And finally, we'll talk a little bit about how do you deploy and host MongoDB. There are database as a service or MongoDB as a service places that you can use. And if you want to use them, great, you're kind of don't need this chapter. But many people don't want to put their data in the cloud or for various operational reasons or even pricing reasons, you might decide to deploy it differently. So if you want to self host MongoDB, either internally or in the cloud next year apps, we'll see how to do that. And finally, in the performance section, we made our code faster, kind of in isolation, It would be cool to see, well, how fast is our API overall? So we're going to do some cool load testing on not just MongoDB itself or Beanie queries themselves, but the entire system that we built to wrap up the class using a really cool load testing framework called Locust. That's it. I'm really excited about these topics I put together for you. I think it's going to be a really fun sequence and you're going to learn a ton.
|
|
|
transcript
|
1:15 |
Finally, before we wrap up this introductory chapter, I want to just introduce myself. You see me hanging out down here in the corner for a while now, but I haven't told you my name or anything about my background. My name is Michael Kennedy. I'm super excited about teaching this topic. I've used MongoDB for a really, really long time. Talk Python, all the sites, the Talk Python podcast, as well as training courses are powered by MongoDB. And I was even for many years part of what they called the MongoDB masters group, which is kind of like an MVP external advisor group to MongoDB. So if you want to stay in touch with me, you can find my blog over at mkennedy.codes. Of course, I'm the host and founder of the talk Python to me podcast, co host of the Python bytes podcast, and one of the principal authors here at Talk Python Training. I'm also a Python Software Foundation Fellow. And finally, if you actually want to talk to me directly, find me over on Mastodon where I'm at mkennedy on fosstodon.org. So great to meet you. Thanks for coming the course.
|
|
|
|
10:57 |
|
|
transcript
|
2:22 |
It's time to get started with MongoDB. Now, some of my courses, I don't bother to put a detailed setup chapter together because usually it's find a Python editor and start writing code. But with this one, there are a lot of moving parts in terms of tools, none of them particularly hard to get or to set up, but you just need them in place. So in this chapter, we're going to work through the various things that you need and how to get them set up on your platform. Let's go. First of all, does it surprise you that for a Python plus MongoDB course, you're gonna need Python? Of course not. But you do need a modern enough version of Python. Now, in terms of the core features, for the most part, we'll not really be doing anything beyond Python 3.6. However, there will be a few times we'll use type hints, I'm sure, type hints were greatly improved, I think in 3.9. So let's just go ahead and make sure that you have the latest version. Instead of walking you through that, I put together a detailed article here at training.talkpython.fm/installing-python. Go over there and check it out. No matter what your OS is, it will walk you through the steps needed to see if you have Python, check out your version. Hopefully you're using Python 311 or greater for this course, and then we'll be exactly level because that's what we're going to be using. You're going to need to get some data files and setup scripts ahead of time before you can import the data and start using it. We're using a well known data source, the PyPI data, and I've structured that in a special way you can import into MongoDB and that we can use. So make sure that you go to the GitHub repository, a URL here at the bottom and star it and consider forking it as well and check it out, clone it. If you're not into Git, if you don't do Git, no problem, don't worry about it. Just click that green code button and there's a download it as a zip file too. So however you get it, just make sure you grab it here so that you have these files to work with. Right now at the beginning of this course, it doesn't have all the code we've written because I haven't written it yet. We're doing that live, but when we do write that code, you'll see that it'll show up here as well.
|
|
|
transcript
|
2:14 |
Of course, you're also going to need MongoDB. There are database as a service platforms where you can connect to MongoDB remotely, but I recommend you just install it locally for this course. Keep it plain and simple, okay? So if you visit this URL here at the bottom over on mongodb.com, it will take you through how to install MongoDB for your platform. Whether you're on Linux, macOS, or Windows, they'll have you covered, okay? Okay, so it's really important that you install MongoDB. Many of the places you install it will suggest that it runs as a service or daemon that just constantly runs on your platform, on your OS when you log in. You may not want this all the time. You know, if you're not really doing MongoDB stuff frequently it's just taking up memory, a little bit of CPU time. So you wanna turn that off. But for this course where it talks about starting it as a service that just runs the Windows service or a macOS service, whatever it be, brew service. Go ahead and do that just so that it's always running while you're going through this course. And then you can tell that service to stop and not auto start if you need to. So make sure you get MongoDB going, just follow the steps here. This is important. You'll also need a couple of command line tools to work with MongoDB. MongoDB is queried through what's called the MongoDB or Mongo Shell. And the command that you type to get that is mongosh or mongo sh. Here, so you're going to want to download and install this in addition to MongoDB, the database server. They're not included with each other. So get MongoDB, the server and the MongoDB shell. And finally, to import and export data and to look, if you care for things like the performance, CPU load, memory load, in real time in MongoDB itself, like monitoring tools, you can get the database tools itself. Most importantly, we'll look at Mongo Restore and Mongo Dump, that is, import data and export data for the databases themselves. So that's why you're going to need to get this third set of tools here.
|
|
|
transcript
|
1:16 |
So far what you've downloaded and installed will be the Mongo shell and another one, an older more legacy style shell to talk to and query MongoDB. Technically you could do everything there, but I strongly, strongly recommend getting some sort of GUI tool to work with MongoDB when you're trying to get a quick overview or work with, You know, look at a table, see what its indexes are, and then try to explain those queries back to you in a nice concise way as we'll be doing in say the performance section. So let's go ahead and download and install Studio 3T free. So Studio 3T is a fancy paid tool that you can use to talk to MongoDB if you have it or want to get it, there's a trial for it, you're welcome to. But we're not using that for this course, we're just using the free edition. So here you can see I'm downloading Studio 3T for Mac. Notice there is a drop down to choose either Intel or Apple Silicon. Make sure you get the right platform there, but it also supports Windows and Linux as well. So you should be good to go. Just follow the URL here and download and install this. It's a simple application, but I think you'll find it really valuable for working with the database and exploring our data when we're not writing code.
|
|
|
transcript
|
2:35 |
As I mentioned at the beginning of the course, we're going to be using data from PyPI. Now the data we're using is actual real live PyPI data I've gotten from one of the APIs where you can query and export information about the packages. So we're going to be not working with the website but just the data side of PyPI. In order for you to do that, over here I've got a data folder in the course repository. And there's a readme talking about how to do all these things. So it says, follow the steps we've already discussed in the video. So make sure you have MongoDB and the management tools installed and that MongoDB is running and the management tools are in binaries or in your path, okay? Then we need to download the data. Now I put this online in a MongoDB format for you right here. So let's go ahead and download that data. See, we got it in the downloads folder there. And it's in this bson form binary JSON that MongoDB knows and understands. Okay, so we're going to need to work in that folder. Then it says you just need to run this command here, Mongo restore. That's one of the tools that came with well the database tools you installed. And it says --drop. Be very careful that says if there is a database called PyPI, we're going to wipe it clean from your system. And then we're going to import everything here as the complete representation of the PyPI database and the dot slash means this folder. So you got to do it in the right folder. Over here, I will say, open up a new iTerm window. You can say new terminal if you don't have iTerm. Here we have our files. So I'm just gonna run this command. First of all, we can ask which Mongo to restore just to make sure that it's in the path. On Windows, you can't say which, you say where, basically the same thing. But make sure this comes up somewhere. Then we're gonna run this command. You can see it did a bunch of work, reading the metadata for packages, release analytics and users, install those and notice it says no indexes. I made sure that we started out with kind of a naive database here that doesn't have any of the performance tuning, extra indexes and things along those lines, set up yet, we're saving that for another chapter down the road. But we've got 9,188 documents, zero failed to restore. That sounds good to me. So it looks like we probably have it imported into MongoDB successfully.
|
|
|
transcript
|
2:30 |
Now that we think we have our data installed, let's go ahead and connect Studio 3T and just have a look and see what's in there, okay? Also, you can go ahead and completely delete that folder and download of the import data. It's copied somewhere else in MongoDB's internal WiredTiger format, most likely. So if you have installed Studio 3T, fire it up. Now I have some older connections for various things hanging around. let's just start from scratch, assuming you have none, you could paste your connection string here, or you could use the GUI, I'm just going to say use the GUI. And let's give it a name, we'll just call it local. And I'm gonna call it local to because I already have a local, but you just call it local. And it's going to be a standalone connection type to the default MongoDB on localhost. None of these other things need to be messed with in this simple early version, when we get to deployment, we're going to need to look at these other pieces. So hit test looks like it's all going again, you must have MongoDB running for the import of your data as well as this here. Hit Save. And then let's connect. Over here, you can see there's a bunch of databases can ignore most of them. These are operational databases for talk Python and Python bytes and and various things. This one comes, these here come with MongoDB. But see this PyPI, that is the one that we're looking at. So we got our packages, and we got our releases, and we got our users, you can double click it to see what is in here. It says there's a bunch of data. So it looks like you've got some data in here, you can also see how many packages there are you could type dot count, run it again. 4892 packages imported there and so on. Alright, we'll talk more about this query syntax and so on. But want to make sure you get connected and that you see a PyPI database with three collections. Remember collections are what MongoDB would call a database table. Because it's not necessarily tabular, they have a different name collections. Yeah, and also you can just hover over these and get stats about how many items are in there. For example, packages can just hover over it and see there are 4892 that got imported. Excellent. So it looks like we've got all of our data imported, and we've connected our GUI tool to work with it.
|
|
|
|
24:17 |
|
|
transcript
|
1:03 |
In this chapter, we're going to talk a little bit about how document databases work, how can you do queries into these weird structured JSON records and that kind of thing. And then we're going to focus on MongoDB's native query syntax. This is going to be mostly a sort of for your information type of thing. You don't need to go in there and do complex queries in the MongoDB shell or in its native query language for your applications. However, it will be very useful for you to be able to open things like Studio 3T or the Mongo shell and ask questions about your data. And for that, you'll need to use this query syntax we're going to talk about here. But programmatically for your Python code, we will be using pydanic and beanie and async and await. So this is important, but not the main way that you're going to work with MongoDB. Still understanding what's possible in and the query syntax is a really important part of getting good with MongoDB.
|
|
|
transcript
|
3:26 |
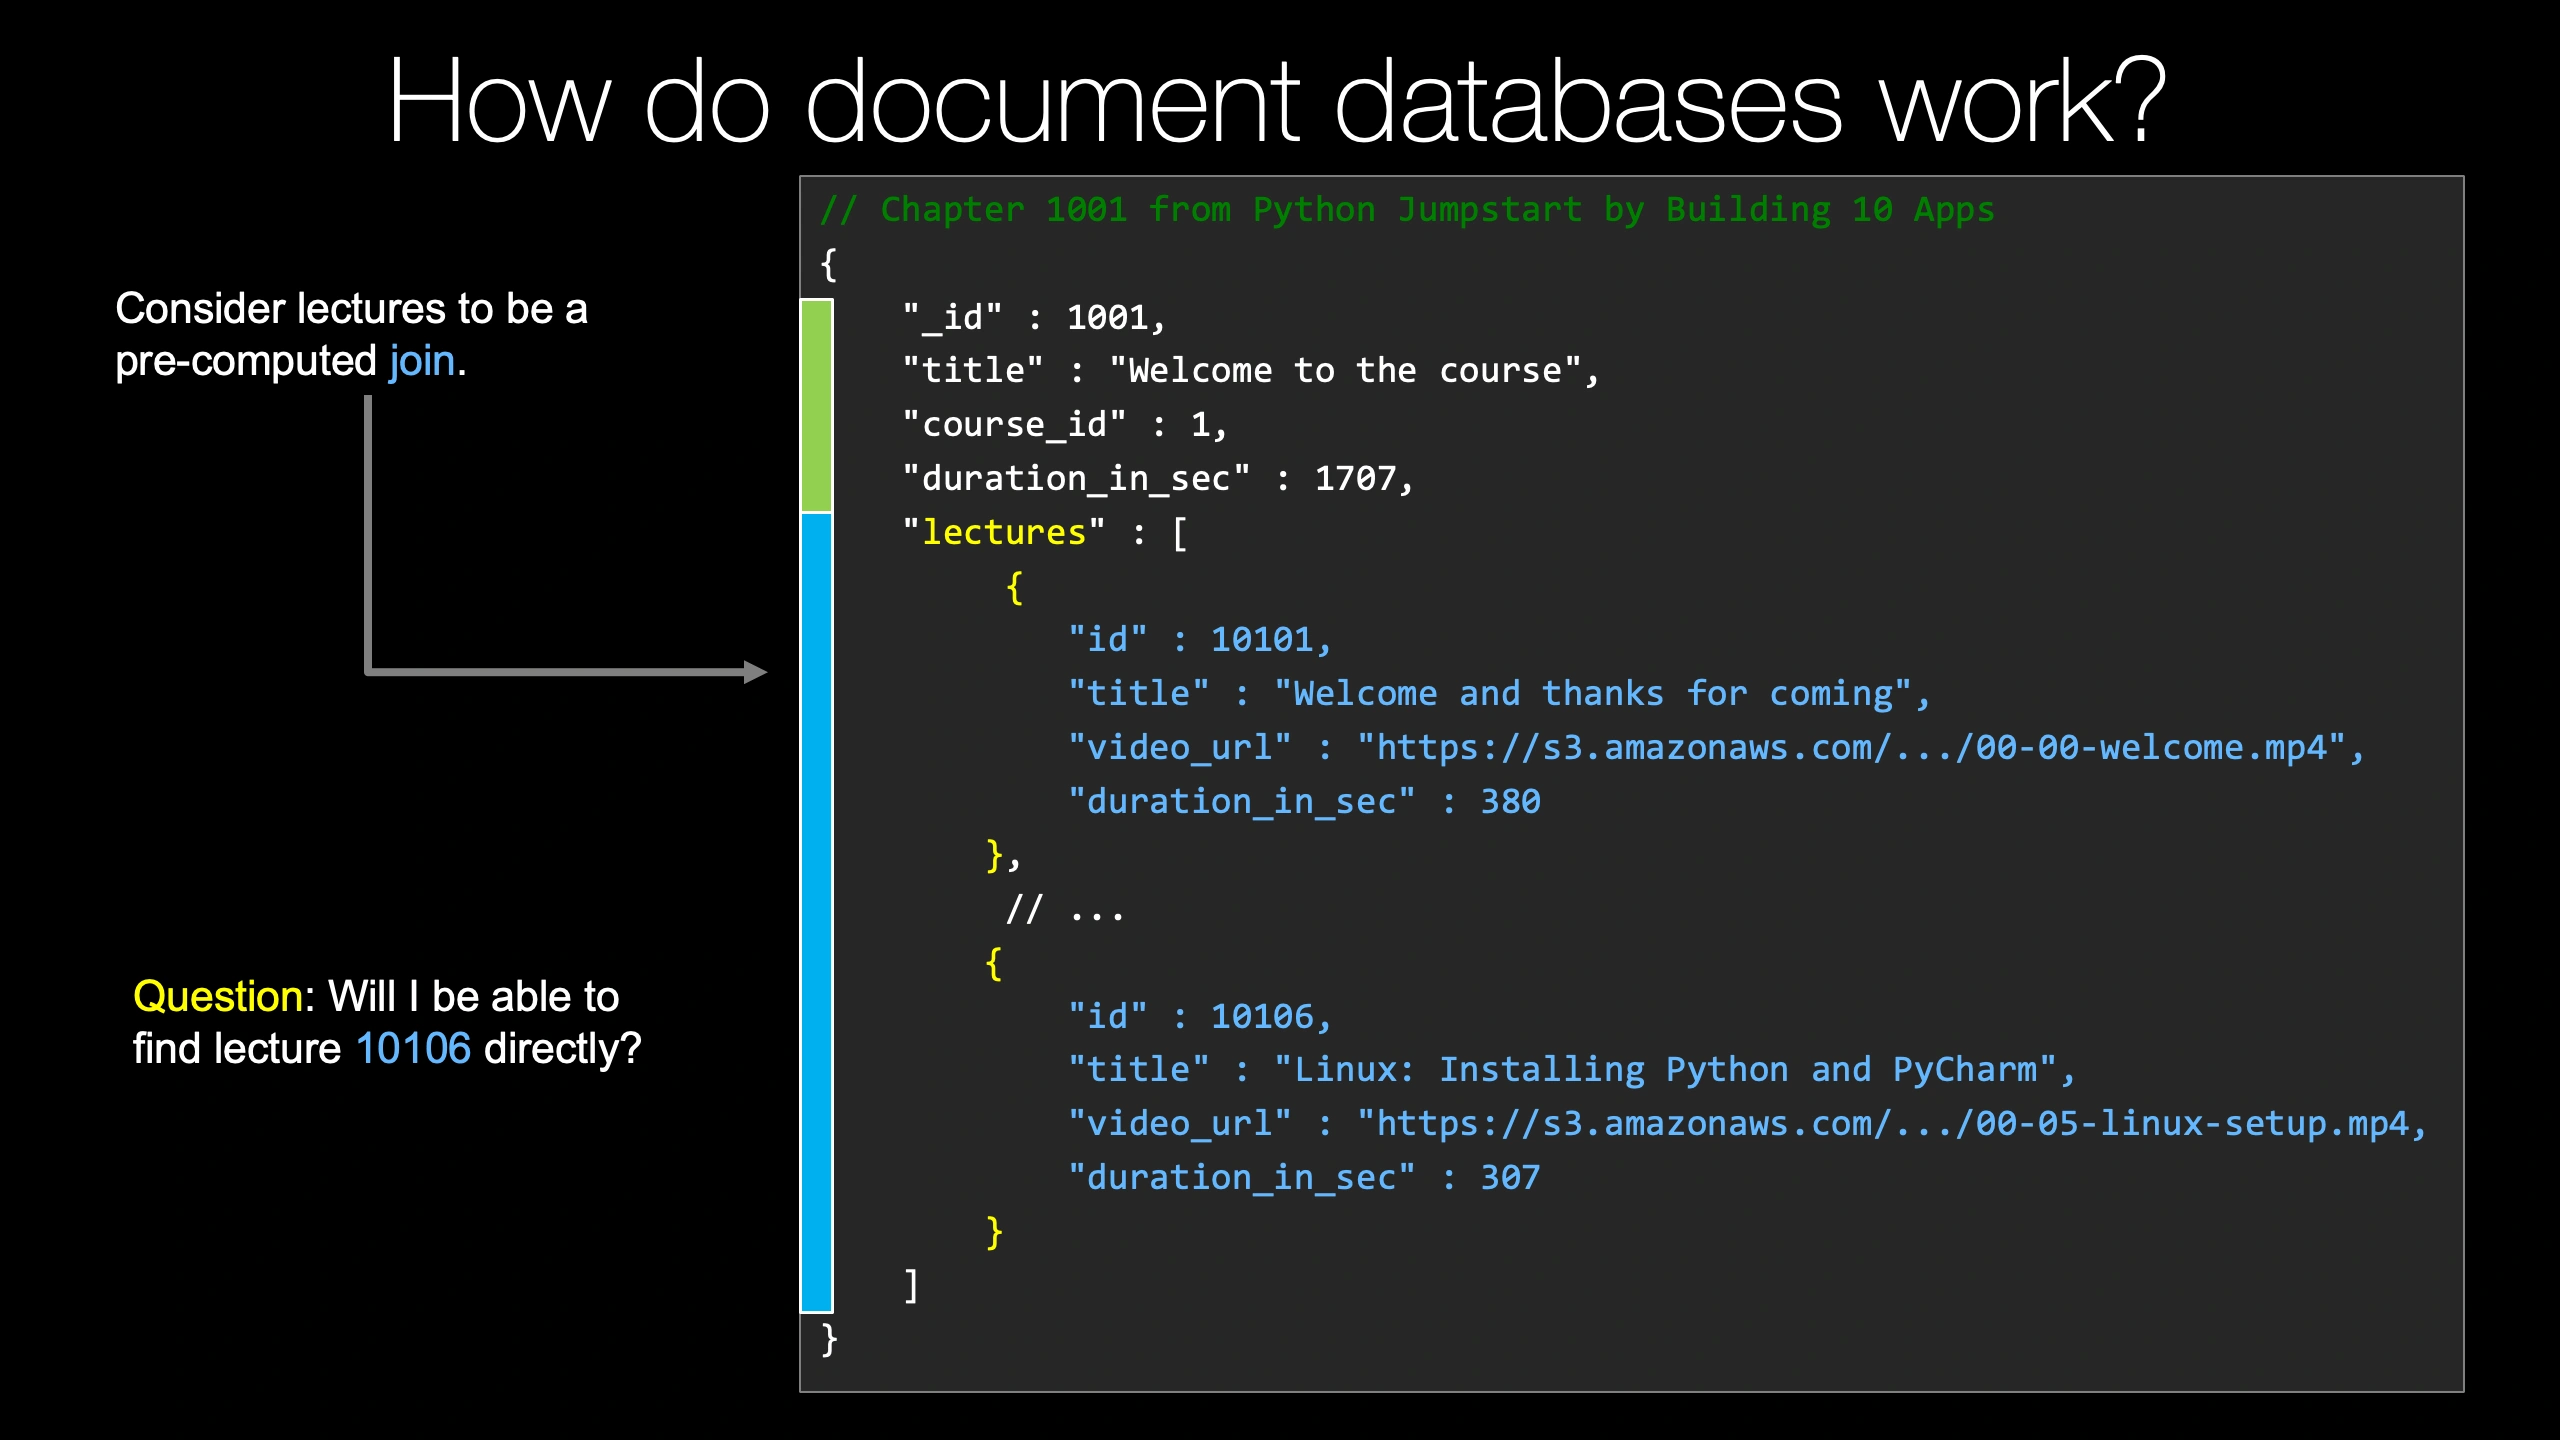
How do document databases work? Well, let's look at a real world example from Talk Python Training. Here is one of the chapter records that we store about our courses. For our chapters, we have information about them as well as all the videos and details about those videos that make up that particular chapter. So we're going to walk through this one real quick and see how we might understand it, how we might ask questions about it, and so on. You can think of it as having kind of two different aspects, a traditional database aspect, this green, and something weird and unique, like a foreign key constraint or a join or something like that in a relational database for the embedded records. So we have traditional columns, if you will. They're not called that in MongoDB, but you know, from a relational database, that would be the analogy. We have ID, underscore ID. This is always the name of the primary key. And then we have title, course ID, and duration in seconds. All of those are standard things you could model in any other relational database such as Postgres or SQLite. Then we have lectures. And notice that lectures is not just a foundational type like a number or a string. It is nested objects. So we've got details about the different lectures, the welcome and thanks for coming, the Linux and installing, and so on. So you can think of this part here as like a pre computed join. And this is part of what makes document databases super, super fast. At runtime, when you ask questions about the database, instead of going, well, first, we have the chapter and now let's go query stuff out of this big lecture table, bring a bunch of pieces together and compute something about that and then return those results, you just say, ""Give me something by ID. Here is the answer. And it already comes pre-joined with this lecture data because for us, if you need details about the chapter, you almost always need details about the videos in that chapter as well, the lectures. So we modeled our data to say, ""Well, if you're going to need them together almost all the time anyway, when you get one, just return them all. That's great. I'm sure it sounds awesome in terms of performance, but there's an interesting question, like can you ask questions about this data like you would be able to if they were not mushed together in this pre-joined nested way? So for example, what if you just want to know I need the chapter that contains the lecture with ID 10106? Is it possible to even answer that question? Is it possible to answer it quickly, say with an index? And yes, absolutely, you can do those kind of queries. You can ask questions about arbitrarily deep nested objects, and you can do that with an index. So it would be just as fast to say, give me the chapter that has a lecture with this ID as it would be to ask for the chapter itself by primary key, for example. And that's why this nesting is still productive and useful because you can still do high-performance queries about the nested data, not just the top-level data.
|
|
|
transcript
|
3:01 |
Let's highlight a couple of high profile users of MongoDB. There are many more that are not in this list. These are just the ones where write-ups have been done by MongoDB. But if you go to mongodb.com/who-uses-mongodb, you get this page. And over here, you can sort of peruse through your industry and see who else is using MongoDB and how. This is really useful if you're considering adopting MongoDB and maybe there are people higher ups on your team or others you're like, I'm not really sure this would actually work for us. Like we do e-commerce. I don't know if you can do e-commerce with MongoDB. Can you I've heard that's not a good idea. And it's still it's a good idea. But what's cool is you can look through here and find competitors or other companies like yours doing similar stuff and you can see well, how's it working for him. So let's just hit a few highlights here. Toyota said moving from a relational model to a document model and microservices with MongoDB Atlas. So they're using MongoDB as a service, sort of, through MongoDB Atlas. And Azure helps to create smart, autonomous, safer factories of the future. So they're kind of automating their factories. That's pretty cool. This Sonoma company does 12 million learning exercises a day in MongoDB. That's pretty awesome. Forbes said they had a 20% increase in subscriptions and reduced total cost of ownership by using MongoDB Atlas, but on Google Cloud instead of Azure. Presumably this is because their site is faster, right? There's a certain amount of people who just decide to quit and go away if your site is too slow. That number is really small, by the way. So you definitely want it to be fast. So here you can pick your industry or your region. I'll just scroll through and see a few more that jump out. GE Healthcare turned to MongoDB to manage their lifecycle of medical IoT devices, which is pretty excellent. Volvo Connect is using MongoDB Atlas again, and MongoDB as the backbone of its interactive customer portal, that's cool. One more here, maybe before we move on from this list, Shutterfly, they have like photo books and other photo sharing types of products. They migrated their multi-terabyte dataset to MongoDB Atlas in minutes, bringing billions of photos to life for millions of people. Pretty awesome. And for all these, you can read the customer story. I'll throw one final one here that's not on the list that I know of anyways. Talk Python. Talk Python training, the podcast, and all that. As we already mentioned, the courses page, super, super fast. It just kind of blinks there. All of this is of course powered by MongoDB as well. So if you're looking for a comparable to what you're doing, you know, have a look through that list. Maybe it'll help with the adoption of MongoDB at your org or on your project.
|
|
|
transcript
|
2:12 |
In this chapter where we talk about the native tools and the native query syntax, we're going to use the Mongo shell for some of these examples. So this is the mongosh or mongosh command that I had you install in the setup chapter. Now in order to use it, we would just type mongosh or mongosh and it opens up. If you type just by default, it's going to connect on localhost on the default port and all of those things. You can also, of course, connect to remote servers with the right command line arguments. You would say, ""Use your database. So you connect in this way, in this case, ""Use training. If you're not sure what the databases are called, you can always say, ""Show DBs,"" and it'll list them out. Then you can say, ""Use one of them. And then you write queries about the data in there. So ""Find"" is basically the ""Select"" type of statement. do, the way it works is you say DB, always always DB, this is directed at whatever the active database that we set in the line above. And then you talk about the collections and then find so we have a collections collection called courses. And then we want to find documents inside the courses collection. So use this kind of dynamic programming style, db dot courses dot find. And then what you pass defined is interesting, you pass a prototypical JSON object. So in this case, we say we want to find the one where the ID underscore ID, the primary key is 30. And you can see the result that we got back, obviously matches that. But if you pass multiple things, we could say the ID is such and such. And it has, let's say, a display order of five, that would be an and statement, there's ways to do ors as well. But the more pieces you put in here the more specific that query becomes if you're not querying by the primary key. We say the find, and normally you would get a, what would look like a minified result of JSON back, which is not the most amazing. So if we throw this dot pretty on the end, we get this nice expanded good looking result set that is much easier on the eyes.
|
|
|
transcript
|
1:34 |
To look at a more complicated query example, let's connect to a different database. This one doesn't come with the GitHub repo data. This is just an example here in the slides. So we can say use bookstore and it says switch to DB bookstore, show collections because what is in here? We have capital B book, capital P publishers and user. Something really important here, keep in mind, MongoDB is case sensitive, lowercase book and uppercase book, not the same collection, totally, totally different things. Please don't have both of those in there. But you do have to realize that to talk to this one, you have to use the capital B. It's not just a presentation style. It's got exactly match. All right. So here we can say we want to go to our books and we want to find, give us all of them. But what our goal is, is to show a set of them, five. We want to do paging. Like here's the first page of five, you want to say, ""Show me the next one,"" and then the next one, right? Some kind of, ""Don't return a million records, but give a way to page through them. So we can say two things in combination. First, skip three times the page size. So we're going to go to the third page, or fourth page, I guess. Zero-based. We're going to go to the fourth page, and then from those, we still want to show, well, the page size five. So skip three times five and limit five. That'll give us a list of these results of these books, five of them from the fourth page of page size five. Cool, right?
|
|
|
transcript
|
1:08 |
As we've already discussed, the way that we query the data is to pass a prototypical JSON object. So here we want to find a book by its title. So we just say title, again case-sensitive, colon, and then the value. In this case, it's a string from the corner of his eye. So we actually get two books back, these two books by Dean Koontz. Maybe one is like an audio book versus print or hardback versus paperback. I don't know. Doesn't show all the details of the records, but something like that, right? Now maybe we want to be more specific. So if you want to be more specific in your queries, we can pass two different things. So we could pass the title and the ISBN. And this query would say I want the book whose title is the one here as well as the ISBN also listed here. So when you pass the values in like this, everything must match. This is considered an ""and"" type of query. The title is from the corner of his eye and the ISBN is 0553582747.
|
|
|
transcript
|
1:41 |
I open this chapter by saying you could query into these embedded objects. In our imagined bookstore here we have this book and it has the details like the title and ISBN, but it also has things like ratings. Which user rated this particular book and what value did they give it? I guess zero out of ten or something like that. So I would like to answer the question with a native query. I want all the books that are rated by the user with this ID. Object ID is the default auto-incrementing, auto-generated primary key if you don't do anything specific in MongoDB. So you'll get used to object IDs that are everywhere. Now I want to know not just can I find a book, but I want to find all of the books in the database that have in their ratings a user ID field that matches this object ID. How do we do that? Incredibly simple. So we just go over here and we say find ratings.userID equals this value. Cool, right? Now don't get confused that there's actually multiple values in the ratings that might have a value for user ID. What it does is it looks here and it says we're going to go to the ratings list and And then in that list, we're going to see if any of the things contained in there, the user ID happens to match this object ID that we specified. So in this case, we might have 21 books, all of which somewhere in its ratings collection had this user ID value. I'm going to return that as a list. Cool, right?
|
|
|
transcript
|
2:04 |
Now, some of you may really just love the Mongo SH, Mongo Shell tool. I personally prefer getting a visual overview of what's going on, but I do really like to be able to actually type just like you would in the shell, ""Here is the query,"" and explore that. And that's why I selected Studio 3T, the free version, for this course as the GUI tool. There are others. You can go and Google them. But for all practical purposes, this one is pretty good and it matches this requirement that I have that I can type native shell commands and still get GUI results. I think that's really, really awesome. So here you can see what I did is I double clicked on the packages collection and it wrote this part here in the middle. It says db.getcollection packages find and at first it was empty. You know, just find everything. That's why I came over here and said I want to find where the email is Samuel Colvin. So S at, kind of clever there, emulcolvin.com. And maybe I wasn't sure, is it email or is it author email or is it author, what is it? So you can come here and type part of it and hit control space and it will pull up an autocomplete list. Pretty awesome. Notice at the bottom, by default, I get this hierarchical view that you can go and explore. But if you want the true shell experience, you can flip this over in the bottom right where it says JSON view right here. You can flip that to say, no, return the results, basically the equivalent of a dot pretty result that you would get exactly in the Mongo shell. So hopefully you find this to be a useful tool to use throughout the course. I'm definitely using it because I love the ability to type in this top text box area just like I was using a real CLI, but the results I get back are in GUI form where I can do things like edit them or explore the indexes and all kinds of stuff without bouncing around the CLI.
|
|
|
transcript
|
2:55 |
If what we pass for these queries are prototypical JSON objects like the ISBN equals this or the rating equals five or something along those lines, that's cool when you're doing an equals, but database queries often involve greater than, less than, not equal to, and these types of things, right? I would like all the users who have registered in this time window from yesterday to today. That's not an equal, right? So how do we do that? Well, there are these operators for querying that allow you to express things like greater than and less than and so on. So we can have, they all start with dollar, the special operators. We have dollar eq, that's just equal, that's kind of what we've been doing. So usually don't need that, but there are places where you can use it. The dollar gt is greater than or gte is greater than or equal to. We have less than, less than or equal to, not equal to. One that I find really valuable is in. You might say, ""I've got a set of 10 objects, and I want to know if I want all the records where any of the values might match that. I could say, ""Give me where the rating is in some number of rating values I want, like four, five, and nine. I don't know. Maybe you want the extremes. You want zero and nine. Our little bookstore example is not exactly lending a bunch of great examples to come to mind here. But that's a really, really common query that I do all the time. There's more of these as well and you can see examples at just follow the URL here at the bottom. There's a reference for all the native operators, at least for querying here. So you can go check them out. This is one of the things that is not obvious when you get started with MongoDB because you can't just use the greater than sign or less than, like you might in SQL. But there's not very many of them. This is actually most of them that you get to use. So you can check them out and use them appropriately. Again, we're not going to do this in our application. This is just when we're playing with the shell and maybe exploring the data a little bit. And then we'll go back to writing Python where you actually use like the greater than sign. Let's look at one real quick example, suppose we want to find all the books that have ratings of nine or 10, not all of the ratings, but they have at least one rating in that ratings list that's embedded in them that has either nine or 10. And so we would write this we just say book dot find ratings dot value to navigate that hierarchy. And then instead of nine, we say, pass in this this little query object, curly brace, greater than or equal to colon 9. And that'll operate just as if we had said, you know, the greater than or equal to sign, and 9 in a traditional query syntax like SQL.
|
|
|
transcript
|
0:49 |
We also have a couple of logical operators. Again, you can find them at the URL here at the bottom if you want to see all of them. When we do our query passing multiple things into our find, that's always always an ""and"". So what if you want ""or""? Well, then you need to use a slightly different version. You would use the $or and specify multiple things that go into those queries, kind of like we did with a greater two or equal than. There's an ""and"", but I don't really ever use the ""and"" personally because you can just put multiple things within a document query, the little prototypical document. Maybe you've got a list and you want to process them programmatically, but again, in Python that's also different. We have not and nor as well. So you can go see all of them here. Really the one that I find I've most frequently used is the or version.
|
|
|
transcript
|
4:24 |
The final thing I want to talk about in this native query chapter, we're almost done with it, is projections. Now, projections are super, super important. Maybe you've done SQL before and people said, ""Never, never select star. Always specify the columns you want back. Well, you have a similar bit of advice in MongoDB and document databases, but it's even more important. Why might people say, ""Don't select all the columns or parts of your data back""? because you might only need two things. What if you only need the ISBN and the title? You don't care about when it was created, you don't care about the ratings, well you're still pulling all that data back across the network and off of disk, potentially on the database server, to just ignore it when you get to it. So a good practice is to just ask for what you're going to use. We get to Python, we'll talk about when you don't want to do projections or when you do and how to do so in Beanie. But in the native query syntax, the way you do that is there's a second parameter you can pass to find. So in this case, we only care about the ISBN and title. So we say find whatever the query is, and then we project back ISBN title, ISBN title. So we get just those back. Notice we get one other thing. We get the underscore ID, the primary key. By default, that's always going to come back. However, all the other fields you have to opt in by passing something truthy. This case one will work. This is basically JavaScript. If you want to suppress the ID coming back, you could say _id colon zero and then you would literally just get back those two other fields, the ISBN and the title. So this is really important because maybe we have a bunch of ratings and that's going to slow down the response and we're not going to pay attention to them here. So forget them. So projecting back a small subset of the document, it really helps performance. I gave you some numbers earlier about Talk Python Training, we have this number of queries and we have this amount of performance. Very very carefully structuring the amount of data that comes back through projections on the server makes a huge difference there. Let me just tell you a quick story about our apps. So our apps on the client side, these are native applications for iOS and Android. On the server side, though, it's all Python, APIs, and MongoDB. Some of our APIs this app was talking to were taking as long as a second to respond. Wow, what is going on with this? These used to be really fast. And I just don't understand why this part of our API started to slow down slower and slower. It turns out that we were returning just the entire document for really, really small bits of information, but we needed many of them. And so a slight change in how we ran our query through a projection, we said, actually, we only need these two pieces of data for this API response that we're querying here, not everything in the record. And those went from taking like 900 milliseconds to respond down to 10 or 20 milliseconds. Incredible. So projections, super, super important, more important than in relational databases, much more important sometimes depending on your data model than relational databases. Because if you go crazy and select star in relational databases, you'll get all the columns. If you go crazy and select star in a document database, you might get whole chunks of other tables and relationships, right? Remember, embedded objects, embedded records are kind of like a pre computed join. If you don't want that part, project it out, and it'll be way, way faster. So that's it for our quick overview of the native view of MongoDB. This is a kind of a for your information for your reference as you need it. Chapter of information, you're not necessarily going to have to go write these projections by hand. necessarily going to have to use those logical operators by hand, but if you need them, you can come back and find them. Mostly, from now on, we're going to focus on Python code for talking to MongoDB.
|
|
|
|
27:21 |
|
|
transcript
|
0:49 |
It's time for foundations. Let's dive into Pydantic. We talked about Pydantic just a little bit at the opening of the course, but Pydantic is a really, really important library and framework for building classes that map structured data with type information to whatever you want it to do. This most popular use case would be with FastAPI on API data exchange with JSON documents. However, there's many, many places that use Pydantic. And so in this chapter, we're going to dive in and see how to work with Pydantic models and how we can parse data with them and even use some cool tools to generate the code for those models to start with.
|
|
|
transcript
|
2:11 |
You get started with Pydantic with just pip install pydantic. And you can find out more about them over at docs.pydantic.dev. Here you can see on the page. Now, we're in a bit of an inflection point or a changeover in the Pydantic space. And you can see right here this announcement on the website. Pydantic v2 alpha is available. So, Pydantic is getting completely rewritten in an almost year-long project from being based on Python to its core being based on Rust, which makes it about 22 times faster. That is awesome and so many of these tools and frameworks that are built upon Pydantic, as we'll see in this chapter, will benefit just automatically from that. However, in order for them to use the alpha stuff, we've got to wait for it to get a little long, a little more down the development pipeline so things like FastAPI and Beanie and others actually adopt those dependencies into their frameworks. So in this course, we're only gonna be using version one of Pydantic. V2 is not really much of a big API surface change, but it is a really big runtime change. So that's big news that we have on the horizon coming, but things are not ready yet for that in terms of integrating those with the libraries that depend upon Pydantic. So 1.10 is what we're using for now. And I imagine over time, we'll update the course code to use version two when it goes for actual release. If you wanna hear the entire story about this Pydantic version two update, I sat down with Samuel Colvin here on the left, the creator of Pydantic, as well as Sebastian Ramirez, the creator of FastAPI here in the center, and talk to them at PyCon about what's coming with Pydantic and how it will affect libraries that depend upon it like FastAPI. So you can check out the Talk Python To Me episode at the bottom using that link there, which also links over to the YouTube video if you wanna watch the video version.
|
|
|
transcript
|
1:02 |
When you're working with Pydantic, these classes have a bunch of types and fields that have to be set and many of them are required unless you explicitly make them optional. And yet, the initializer, the constructor for these classes is just *args, **kwargs, you know, the we'll take anything"" and it doesn't really give you much help on what types are required, what are expected, that sort of thing. So you want to get the plugins for your editor. If you're using PyCharm, grab the PyCharm plugin. If you're using VS Code, there's one as well, an extension there as well. If you're using mypy, which is a tool you run against your code to verify its type consistency across function calls and classes and that sort of thing, there's a mypy plugin. Also for testing, generating test data, there's Hypothesis as well. So if you're using any of those, do consider getting the plugin to make working with it a little bit better in your code editor or your CLI tools.
|
|
|
transcript
|
4:00 |
Let's survey the landscape of things that use Pydantic. Pydantic is awesome on its own and you can use it in even say web frameworks that have no idea what Pydantic is and have no dependency on it. Like a Flask website that exchanges JSON, you could manually use Pydantic. But there are many frameworks out there that are Pydantic at their core. So let's talk about a couple of those. We have Beanie, obviously one of the centerpieces of this course, right? That's how we're modeling our data in MongoDB and doing our queries. All of those models are based on Pydantic. So Pydantic is at the very center of working with MongoDB using Beanie. We also have in the relational side, we're not going to use in this course for sure because MongoDB is not a RDBMS. We have SQL model and SQL model is basically take SQLAlchemy and replace the SQLAlchemy models with Pydantic models and then that's more or less it. But really really cool that you have these nice Pydantic models to model your data in relational databases such as Postgres or SQLite. This is also created by Sebastian Ramirez, the creator of FastAPI. Speaking of FastAPI, FastAPI is the most well known use case for pydantic. And it plugs right into the API data exchange in super clever ways. Here is a pydantic class modeling an item, I guess, and that's what we're calling it as a name, a description, a price and a tax. We're going to get into this, but the name is a string and the price is a float and they have to be a float or parsable as a float in the data exchange for this to be valid. If we want to say we're going to have an API endpoint, and that API endpoint accepts a JSON post body or something like that, that has a name, description, price and tax, and we want to automatically convert that, well, all we have to do is create a function here we have create item, and it's just a post operation to slash items. And look in the parameter here, it just says we take an item of type item and FastAPI will say I see what's coming in. This is the Pydantic model. And we're going to use that Pydantic model to parse and validate the JSON coming in. So FastAPI, absolutely Pydantic at the core. There's many other uses for the Pydantic models here as well, such as response model for open API documentation, but not a class on fast API. So we're not getting into that. But right here, specifying the type as a Pydantic model is not just a hint to the editor, it changes how FastAPI processes the response that comes to it. That was a bunch of awesome projects built on top of Pydantic, right? Well, let's Let's look at an awesome list to round out this small section here. Over on GitHub, we can find github.com/Kludex/awesome-pydantic. It's a curated list of awesome things related to, well, Pydantic. You can scroll through here and there's things on machine learning that are based on Pydantic. You can go down here and locate. There's Beanie, but also Piccolo, which is an async query builder in ORM, which can auto-generate Pydantic models from database tables, or gigantic Pydantic model support for Django or HTTP runner, which is a HTTP testing framework, strawberry graph, and so on. I'm not going to go through this whole list, just kind of scroll through it here. There's a bunch more awesome things to find around Pydantic. And if you know one that's not on the list, do these folks a favor and submit a PR.
|
|
|
transcript
|
5:11 |
Well, that's enough talking. Let's write some code and play around with Pydantic. And this is our very first chance to write some actual code in this course. So let's just take an extra moment and get the repository all set up. Over here, I've got the code repository as it would be checked out from GitHub. What I want to do is open this in PyCharm and have it create a virtual environment. Now PyCharm can do that itself or you could create your own virtual environment and work with whatever editor you like. So I'm just going to go the PyCharm way. Now on macOS, I can drag and drop this folder onto PyCharm and it'll open it. On Windows or Linux, you have to say file, open folder, and then browser. So drop it in like this. Here our project is open. You can see down in the right that it's detected the git branch and so on. But the most important thing is what version of Python is running. It says 3.11, that is great, but this is the global 3.11. So let's quick add a local interpreter. Now normally I would go here and just say, add interpreter, add local interpreter, but for some reason PyCharm like literally doesn't respond. So I'll just go over here to the settings interpreter and say add interpreter this way. a new virtual environment right in that location based on Python 3.11. And here we go. Now you can see the virtual environment has got the name, the MongoDB devs in it. That means it's a isolated virtual environment, not just the global Python interpreter. So while that's a lovely readme, we don't need that. Let's go over to the code and we'll make a new directory. And this directory is gonna be named after the chapter that we're on, we're on chapter four, Foundations of Pydantic, call it something like that. And let's add a Python file just called first_pydantic. This is gonna be our first exploration with Pydantic. I'll let Git add that. Now to work with Pydantic, we're going to need to import it. And I'm gonna be super explicit here. I'm going to use the Pydantic module as a namespace and not just imported the things from there. So you can see exactly where these elements are coming. So we'll say import Pydantic. Now you can see that stopped auto completing there. What we need to do is we need to add Pydantic as an external package. And notice you can see this requirements.in that is not yet quite added to Git, but now it is. And in here, normally we have a requirements.txt file, but I'm gonna use pip-tools to actually allow us to more carefully manage the dependency. So into this requirements.in, we write only our top level packages without version. So pydantic for the moment. And then we're going to use that to generate a requirements.txt file. So make sure your virtual environment is active here. And this here, we'll first pip install pip-tools. That's where the tools we're gonna need for this. And also we want to run that. Excellent. And so now we can say pip-compile requirements.in --upgrade. The upgrade doesn't matter the first time, but the second time it'll have an effect. What this is gonna do is actually generate the requirements.txt. And we can close that up and go here. Let's add that Git as well. And look what it's done. It says you wanted Pydantic because you asked for it in the requirements. And this is the latest version at the moment. And Pydantic itself depends upon typing extensions. And its current latest version is this. This will right now, while it's quite simple, but it will grow in complexity as we build up working with things like FastAPI and Beanie and all of those, it's going to be much more interesting as well. In PyCharm, we'll install these if we click here, you can click that if you want, or you can say pip install -r requirements.txt as you typically would. Alright, looks like everything is happy. And now we can import Pydantic. Now let's define a method here, we could just write the code right into the just inline as a script without any functions. But I kind of like to have some structure to this. So we're gonna have a main method and it'll do whatever. And then we'll do the dunder name thing. And again, since this is only the very first one, let's go ahead and just make some output happen. All right, I'm going to run this, right click, run Pydantic. See, it's using our virtual environment Python and we get Hello World, fantastic. From now on, we can press this button or on macOS hit Control + R or whatever hotkey you see up there as you hover over it.
|
|
|
transcript
|
6:20 |
So what we want to do is we want to work with some data. This is the goal of Pydantic. It takes some input data, and then it is going to convert that into a class. Now in our world, we want to model some kind of API response. Like we have here, we have an item ID, we have a created date, pages visited, and a price. So we're going to go and model this with Pydantic by creating a class that's called an item. And in order for this to actually be a Pydantic model, not a regular one, it can't inherit from object, but rather it has to inherit from Pydantic.baseModel. And then we just specify the type. So I see an item ID down there. And what kind is that? That is an integer. Now, notice the quotes, it's submitted to us as a string, but really what we intend here is for that to be an integer in our API. So we'll say that. We have a created date. This is a date time. Not date time like this. We have pages visited, which is a list of int. Again, those are integers. That's a string, but could it become an integer? Yeah, probably. This right here, by the way, instead of being capital L list, being lowercase list, there's your Python 3.9 dependency we talked about at the start of the class. And finally, we have a price, which is a float. So now we have a class that represents what we expect from our inputs to our API or to reading this data. And we have data down here that's not exactly the right shape. For example, this is not actually an integer, but it could be parsed to this is a list of integers, same thing here. So let's go ahead and try to use pydantic to parse this. So we come down here, we can say item equals item. Now see this star star star kW args, come back to that in a minute. What I want to do is I want to say item ID equals the value from data created date equals like this created date equals data of created date. Now that's not fun, is it? Comma, and so on. So with a dictionary, we can write code that says for every key, write this expression by just saying star star the dictionary. So those key value, key value, key value as parameters. And then let's print out item. So this tells pedantic to ingest that data using this model, and to parse it according to the rules that the types declare, for example, item ID must be an integer. And it must be there because that's not an optional integer, it's a concrete integer. Let's run it and see what we get. Oh, look at that. Here's our printout. And a couple things to note that this is a actual integer, not just the string 123. Because if we had a, let's put name, which is a string just so you can see the difference here, I'll put name is Michael, something like that. Here you can see the quotes indicating that's actually the string type, right? So this is not a string. This is the number 123. Here's our created date parsed correctly. Here's our pages visited and notice that that three that was not accurate, actually also got parsed, as well as our price. How awesome is that? But there's more to it than just this. Suppose here that we want to make sure there's an item ID. If our data doesn't contain it, it says item ID field is required, it's missing. Another thing that could happen is this could be ABC 123. And up here in our data model, we say it's an integer, could that be parsed to an integer? No. So item ID now has this problem that its value is not an integer. How cool is that? Right? All that is really complicated work. Similarly, if this was A3, even better. It says there's a problem trying to parse this data into item. The problem is the pages visited the number two index, so third thing in the list, because it's zero based, is not an integer. Look at that reporting. How excellent is that? So really, really cool. Now if we wanted to say, you know, now if the name is missing, final one, it's going to crash and say name is missing. If we want that to be something you could submit, but is not required, we could make this optional. Now you can express optional in recent Python like string or none. I don't really like that syntax very much because I don't really want it to be none. I want it to be a string or maybe it's missing, right? So I'd rather express this as optional, which you get from typing. I know other people have different opinions and you're welcome to those. You can do String Pipe None or you can do Optional String. Either way, this is telling Pydantic if it's there it's got to be a string, but if it's missing, no longer is that an error. It's okay, it's just None. We can even set a default value. Jane Doe if it's missing, or if you pass in a name, it's Michael. really cool, right? So excellent, excellent that we can create this model. And this is our first pass one of many we have for working with pydantic. We create a class, it derives from base model, we specify the types, those types have all sorts of meanings, what is required, item ID is required, because it's not an optional int. We have default values, It does all the parsing if it can. Really really great.
|
|
|
transcript
|
5:35 |
So we've seen that we can write classes that match a JSON document. Then it will parse those using the rules encoded through Pydantic into that class. What if you already have the JSON? And what if it's complicated? Our little order example was quite simple, so I didn't mind typing it out. What if you have more ugly, complicated data that you need to work with? Over here on the left, we have this code generation section, and it shows you ways in which you you can generate code from this using a CLI tool called data model code generator. Really cool. Now, we can use this and you can run with it if you like. But let me introduce you to a website that will do the same thing based on that, that code. JSON to Pydantic converter. See on the left, we have a foo and a bar baz. It will generate this over here on the right from Pydantic import base model. Our model is that this is an integer. That's a string. Very cool, right? Let's try to hit that with our order data here that we just wrote. So item ID and then I guess we could add in name is Michael. Remember in JSON, you can't have single quotes. Look what we got over here. Item ID is a string created date is a string. We could do better than that, couldn't we? So it's not exactly right. This is detected as a list of strings. And really, that's because we've kind of passed in failed bad data. So let's let it do like that. float in a string, we can make this optional, right. But this is a pretty good jumpstart to writing these classes. Okay. Let's go with something a little bit more complicated here. Let's take this weather service we have over We're at talk Python. This is live real weather. Let's get the weather in. Let's say, where's that? That's in Portland right now. And notice how yucky this looks in Vivaldi or Chrome as well. So Firefox to the rescue. There we have nice structured data. Now this is maybe too structured. Let's go to raw data and pretty print it. And there we go. And look at that. I would say this is just about like heaven. 75 degrees, 44% humidity. And if you prefer metric, that's 23 degrees Celsius. Over here, pretty print this. Now look at this, it's pretty complicated. So we've got this weather thing embedded in here, then we've got wind reports and then units and then the forecast and the location and the rate limiting. So let's go and put that into our JSON to Pydantic model and see what we get. A little more complicated here, but we've got our weather, which is this section, our wind, which is this section, and notice, integer and float. Maybe you should upgrade that to an integer, make it a little more obvious. Upgrade that to a float, rather. And finally, you've got your model. Let's go ahead and just make sure that we can parse all of this, make sure that it works. Go back to PyCharm. Let's call that weather for a second. Paste all of the code and this will be, let's call it weather model, right? This is the top level model. It has some weather and wind and notice there's some really interesting aspects here. So this itself is a pydantic model and the type of this is the pydantic model. So that means we can have hierarchical, structured, pydantic models parsing and representing this, which guess what, for a document database like MongoDB, is exactly the type of thing we're trying to model. So let's just go down here and say data equals and go grab our data we got here, like that. And finally, say report equals weather model of star star data. You want that even more when it's this complicated and then print the weather is now. And let's run this one. Look at how awesome that is. Weather is, now we have our member, this weather. The weather is this weather object with broken clouds and category cloud and the wind is like this. Remember, even if this was off like that, when we run it again, it's still gonna parse it, not because of the top level model, but because of the nested model into a float. And there you have it, right? You could just print out the forecast if you want just the forecast, right? Use that hierarchy to get just the pieces we're looking for. Excellent, excellent. So if you have complicated data, look and you already have it as JSON, you can go to the json2pydantic.com converter or use the CLI tool down here to run it with the input and the schema and so on. All right, however you want, you can start with your data and generate these Pythonic models right away.
|
|
|
transcript
|
0:55 |
If you want to go deeper, here's some of the history and more details about Pydantic, some of the philosophies behind it. I've interviewed Samuel Colvin, the creator of Pydantic, not one but three times on Talk Python to Me, back on episode 313, about automate your data exchange with Pydantic when it first came out, then about a year later when he said, ""We're going to do this big, massive rewrite and rust, interviewed him about Pytanic v2, the plan, like why is he doing this? Where is it going? What the community should expect on episode 376. And very recently I interviewed him and Sebastian Ramirez, as I mentioned already about, well, now that you're basically done with this rust rewrite and you're looking at 25 times faster code, what are all the consequences of that? So you can check out all of these episodes if you want to go deeper.
|
|
|
transcript
|
1:18 |
Let me close out this chapter on Pydantic with one more piece of information. Pydantic has got a ton of support recently. As you build on top of open source projects, you want to know, like, there are people around working on that if that person is not you, and that there are other people interested in it so that there are things like this CodeGen library that you can use. So, Pydantic absolutely falls into that category. I would say more than almost any other open source project. Sequoia recently, along with others, recently backed a company founded by Samuel Colvin around Pydantic and data exchange and data validation, giving them millions of dollars of investment to help make this transition over to Rust and to build cloud services based around some of the same ideas as Pydantic itself. And it's not just some side project or a library that a couple of cool other frameworks depend upon, but it's also backed by a whole bunch of people now working really hard to make this Pydantic even better. So very exciting news. Congratulations Samuel. And you can read about it in this link here at the bottom.
|
|
|
|
29:08 |
|
|
transcript
|
1:24 |
On to the next foundation. This one, Async, Async.io and Async and Await keywords in Python. At the opening of this course, I talked about Async and how people often tell you how hard Async is and threading and concurrency and don't do it. It's a foot gun, you'll shoot yourself on the very first day and that may be true if you're doing lots of threads, a lot of coordinating across those threads with like events and signals and critical sections and semaphores. There are algorithms and systems that can be extremely complex. That's not what we're talking about. What we're talking about is simple things like I want to call, send a query to the database and I would like the system to not be blocked while I'm doing that. So maybe you can handle a separate web request to an API or I'm talking to remote APIs or HTTP services, and I want to be able to do more than one of those at once, but those are independent results. So in a sense, what we're doing here is async and parallelism on easy mode, but that's kind of the point. That's mostly what you need to do, especially as a consumer of async frameworks like Beanie and others. Okay, with that foundation set, let's dive into async.
|
|
|
transcript
|
4:06 |
There's two reasons you might use asynchronous programming in general. One is while you're waiting on things, I'm waiting on a database query, I'm waiting on an API call. The other is to take advantage of modern hardware. I have 10 cores, and I would like to use more than one of them. This first part, we're going to talk about that performance side, how do I take full advantage of my hardware, although that is not the focus of async. With regard to Beanie, it's still worth just talking briefly about that so you know. Alright, that's something else. Now let's talk about the I/O waiting side of Async and Await. Check out this graph. Somewhat dated but still absolutely a true statement. So this is basically Moore's Law, the red line, saying not the speed of your computer but actually the number of transistors which is very closely related to the speed. So you can see from the beginning until about 2008 2007. The transistor count and the speed the single threaded performance count the blue line, for example, as well as the clock speed, these all just went in lockstep faster, faster, faster. If your code wasn't fast enough, you'll wait one year. Now your codes fast enough, It's gone much, much faster because of course this graph is a logarithmic. But something weird happens around 2008. We start to hit limits. Too much heat, too small of devices. Now we're still getting smaller devices, but we're like right up against that limit coming up on three nanometer chips. But here's the thing. Computers still got more and more transistors and they got more capable, but they did so by becoming multi-core. The computer I'm recording on now is a Apple Silicon M2 Pro. I think it has 10 cores and my little Mac mini. Amazing, amazing machine. But it has 10 cores, not one. That means if I write a single threaded program, I get 1/10 of the power. So in order to truly take advantage of this system, this hardware that I have, I need to use multiple threads and access those multiple cores. Here's a simple program in Python. Look at this, Python 3.11, we're just saying, while true, just mess with some number here. Take the number modulo by 997. I guess we could add one to it or whatever as well, but basically, it's just busy all the time. However, if we pull up the process system information here, the server, even though it's going 100%, it's just using 7% of the system. That is one of its 16 cores. Huh, that's disappointing. Again, if I wanna take advantage of all of this hardware, all the hardware here has to offer, I can't do it with a single core, even 100% maxed out, it still is only in this case, you know, 7%, not very much at all. So that's why we need multiple threading and concurrency to run in true parallelism across these different CPU cores. Traditionally, Python has not been awesome at that. We have the GIL, which means threads are still kind of serialized as long as they're doing threaded stuff. I have a whole course on async. There are several ways to escape the GIL and go faster. We could use Cython, we could import some C libraries or Rust libraries that do this down at a lower level, we can use multiple processes through multi processing. There are ways to take advantage of this. None of those are the topic of this foundational one. And so I'm just going to leave you there with some ideas to think about on the performance side and we'll move on to more like server side client server web API's mixed in with MongoDB for the rest of this chapter
|
|
|
transcript
|
1:01 |
The side of async that's actually super interesting to us as somebody who would be talking to a database Potentially with multiple clients multiple connections talking to a database like Mongo is async for scalability Now scalability gets thrown around as a buzzword It just means more processing more awesome to a lot of people but really specifically it's about being able to add more and more Requests to the same system without that system dropping off in terms of performance. If I quadruple the number of requests to my system, do I get one quarter or worse of the performance or does it kind of just stay the same? It doesn't mean any individual request is going to go any faster, maybe it even goes a tiny bit slower. But it's the ability to do many things at the similar speed as we could do one. In the context of this course, it's the ability to do many database requests in the relative speed and performance as maybe one request.
|
|
|
transcript
|
4:02 |
To truly grok the benefits that we get from async and await, especially around databases, we're going to imagine a web server. And this web server can process requests for either an API call or for a web page request. It doesn't really matter. They're kind of the same. Now, in this graphic, we have three requests. Requests 1, 2, and 3. And these green boxes represent how much compute time is required to respond to that request. So request one takes, you know, as block size, request two about the same, request three, really really quick. But the person who makes request three, unfortunately, is in not a great order because two requests have come in before, request one and two, which take a certain amount of time. So from the perception of the caller from the perception of the person or the app making the request, what is the total processing time or the response time as they see it in this system with this amount of load. So in terms of response time, the first request comes in and it's exactly as long as the request takes right that yellow bar same as the request length. Great, but request two has been waiting about 60, 70% of the time for request one to finish before it could even get started. So its request is a lot slower. And poor old request three here. It should have been super quick, but it's got to wait on both of these. And so it's perceived time is actually the longest by quite a bit, you know, five, 10 times, five times more than the natural speed if it could have been processed in isolation. This is the scalability thing. As we add more work to the system, it slows down more and more, okay? Not great. Now, if we zoom into one of these requests, let's say request one, doesn't matter. It's not just a big block of code running. There are steps that are happening. There are systems and interactions that are at play. So if we look at it, maybe the web framework, FastAPI is doing some work, and then it hands execution over to us, and we decide, hey, we're gonna go make a query to the database, like, is a user logged in? If so, give us their user information back from their ID. Our code checks and says, Hey, do you have access to do this thing or whatever with your account? Okay, great, you do. Then we're gonna go back to the database with another call here and do a whole bunch of work. And then when that response comes back, we do a little bit to prepare a response and return a JSON to the framework, the framework sends it back. Something like that, right? Well, look at these places here. Because these are synchronous calls, there's no way to let other execution happen. It's the call starts and it just runs our function. But what we're really doing is we're waiting. We're waiting not just on our code, we're waiting on probably a separate computer who is running the database, maybe even the internet if it's some kind of cloud deal, right? So we're waiting at minimum on another process. And we could be doing other work while this happens. But because we wrote it synchronously, we call the function, it blocks until the whole thing is done. So there's no way to allow other processing to occur for the majority of our function, which we're just waiting here. And that's the key insight that async and await and asyncio have is like, is there a way to break that series of steps into smaller pieces? And when one of those pieces is waiting, it's not making progress, let's run other steps, other slices of processing from other requests or other things happening in this program, right? So if we could make that red part become productive, think how much faster our code could go. We got like five times performance improvement just because we can do things while we're waiting. It's mostly waiting.
|
|
|
transcript
|
2:21 |
What if we were to use asynchronous execution? In particular, what if we could run other code and process other requests while our original one is waiting? That's the big red waiting on database section from request one. Well, how would this look instead? So here we have a request one come in and we start processing it. We make a little bit of blocking execution until we get to that database part and then And then we just go, all right, we're waiting. Anybody else want to run? Right around then request two comes in and it starts to process and it gets to its database part and says, well, I'm waiting on the database. One and two are now both waiting. So there's hanging out and the system says, anyone else want to run while these things are waiting? Sure, request three can come in. Maybe it's a little bit of a delay for that to get processed, to get started, but then it's processing starts. How does this look in terms of response time to the users, the consumers of this API, way better. Well, request one is gonna take just like before the same amount of time it takes. But importantly, request two, or response two comes back in just about the time that it would take if it were in isolation. And because request three was able to run completely during one of these were both waiting on the database sections, response three is also pretty much as fast as it would be in isolation. Here's that scalability thing I was talking about. If we have one request or we have three requests, the perceived response time is about unchanged. Pretty awesome. Again, if we zoom in, same thing. We've got our framework database, our code, more database, more code, more framework. But this part, we are now able to say, Hey, Python, right now we're waiting on an external system, some form of IO, network IOs in particular. If you got other stuff to do, go do it. And when that IO finishes, wake us back up and run our code. Do that a couple times, and that creates productive waiting instead of unproductive waiting. Instead of saying, sorry, we're blocked, waiting on the database, can't do anything. And this is the key step that allows Python to do way more work with asyncio if we just use the await, the async and await keywords.
|
|
|
transcript
|
8:26 |
Are you ready to write some async code using async and await? Let's do it. Let's do it. So we're going to go back to an API call, not a database call just yet. Because we haven't talked about how to do the database work yet. We haven't talked about beanie and API's are perfect. Even if the API itself for single threaded single level concurrency, the internet itself is not and a lot of times what you're waiting on is actually the messages making its way through the internet pipes, not the actual server itself. So back to our weather service. Notice that we can go up here and we can say we want to go to a city like city equals Portland state equals Oregon, we could go Seattle and Washington, we would get Seattle Washington's report which is pretty similar here they're geographically close. So I want to do that for a bunch of places. So I actually went and asked ChatGPT, hey, we've got this URL like this, please generate a bunch of URLs for cities, it did. And so now we're going to go and call these first in a serial way, and then in a concurrent asyncio way. So I've already typed those in just to save you the trouble of generating those and writing them down all of that. Now let's write a function. I'll start out, I guess, this one, I guess we could have it be synchronous, but all of its work it's gonna do is going to have to be asynchronous. And there's a little bit of a weird twist that you'll have to get your mind around to make this work. So for now, I'll just say, ""Hello, weather, and make sure we're running it. Notice it's not running, right? Why? Because we haven't done our dunder. You know, if dunder name, This, and in fact, I'm tired of writing that and you'll be tired of watching me write it. So let's go over here to the live templates, go to Python here, and we're going to add one of these real quick. Add a live template. it main, like that. I'm going to define the context, which is anywhere in Python, just to keep it simple. Now if we go over here and we just type main tab, boom. I don't have to write that again. Cool, cool. Now what we want to do is we want to call these. You might think, ""Okay, call an API, requests. No, no, no, no, not requests. does not have an async API. But you know what does something very similar httpx, the next generation of Python client primarily because it lets us write code up here like this. Well, this one synchronous, but we can do an async version as well. Here like this, where we we create an async client. So copy that for a second. And let's go write some code. In order to do asynchronous programming, we need a function that can run asynchronously. So you might write def get report given, given a URL. And then we would do something like this, right where we're going to say async with and then a weight client. Well, we don't have our httpx yet. So let's go and add that to the requirements here. And then let's regenerate the requirements.txt and install it. Notice a lot more things came in. And over here now we've got all these dependencies, which why is that one there? Well, because of those those two reasons. Excellent, so now it's just a matter of importing that at the top. Now we can await client get URL while the response like this. So by default, what we get if we call this is the return value. Does it say here? Yes, and can I get to it without making a go away? Yeah, here we go. This is a coroutine that returns a response. So the type of this is a coroutine that has not yet started order to run it, we need to tell Python, like we had those colored slices in the event queue, we need to say here's a slice. So we're going to now block, you can go do other work, dear Python, while this is running while we're talking to the internet. When it comes back, please run the code from here on out. One of those is raised for status. So if there's an error talking to the server, like a 404 or a 500 or timeout, whatever, we'll make sure we don't keep going. And then we should be done with this, we can say return resp.json(). So we can parse this as JSON. And this here for now is going to be a dictionary. It could be, and maybe we'll make it, it could be this class up here. Remember this? We'll see about that. For now, let's just return this just to make sure that we can get something. So what we want to do is we want to say, let's just take the first URL, and we'll say report. We want to call get report and pass in locations. Let's just do a zero for now. Well, look at this error here. It says a couple problems along the lines. Don't worry about that. I don't see PyCharm give us an error. But this for sure is going to be a problem if we try to run it. For example, async used outside of an async function. So normal functions can't be async. So anytime you're calling, you're using the async or await keyword that can only be done within the context of an async function. Now if we run it, we get a warning. But what happened is this generated a co routine, but it didn't call anything on the server. I'll put like right here, I'll say, print contacting URL. You don't see that. because that function never ran, it got created with the potential of running, but we never awaited it. So what we need to do, let's go ahead and make this async_def. We can await this. And then we need to run this here. So the way we're going to run that is we say async_io, import that, dot run, that coroutine. And it ran, let's go ahead and print report. Let's just do the forecast. There you go. Look at that. Well, where did we go ahead and print? Print that out so we can see. We're calling New York City. Okay, and we got that. I guess we could also print out the location. Let's see. It is location. New York City right there. You can see that that got us the right one back. So that's how it works with async and await. We're going to create an async function using async def instead of a regular one, which then allows us to use async with or await. And then in order to run it, It has to either be called from within another async function and awaited, or you can run it as the top level async thing using asyncio.run. Excellent. So that's the first part. Now what do we do to call all of these locations at the same time?
|
|
|
transcript
|
7:48 |
We made a call to one URL, let's see about doing it for many. And we gotta be just a tiny bit careful here, because if you look at the response, you can see that you only get 46 lookups, actually 46 left, you get 100 lookups an hour, I think with this API, 'cause it's really for the course, it's not for you to build apps around, all right? So it's heavily, heavily rate limited. I think if you ask for the same one twice, you might be fine. So it could be no big deal. But anyway, well, we do have a limit on how many you can get. All right. That said, let's go and write some code. It's going to be awesome. So instead of getting one of these, let's go and rewrite this function to get all of them. So let's go like this. We'll have a report equals a list here. And let's make this function here. we'll call this print show report. We go, it says async. Don't know why PyCharm, you think that needs to be async 'cause there's nothing async happening in there. So we're gonna go for the report and then we'll just say for URL in locations. Well, can we just do this? And we put a URL here. Technically don't need this yet. Not do we, well, you'll see that we will. And let's print out, I guess we're kind of doing this already, we're printing that we're calling one and then we're printing out our report. So you should be able to see the speed at which this is happening. Let's run it and see what happens. See it coming down, click, click, click, click, one at a time. Hmm, let's try it again. One at a time, they're coming back. Okay. Why aren't they running concurrently? I told it, it's async. I'm awaiting it right here. Well, it is awaiting, it is allowing us to scale extra work, but let's just talk through how this works. It says go through every location, all 10 of them, and start getting the report and then wait for it. And you get the report, show it. After you get the report, go to the next one, start it, wait for it, show it. That's exactly the same as if you had done it in a non-async way. Other things in the program could leverage that waiting time, but this function, not so much. So what we need to do is we need to actually start all the requests and then wait for all of them to finish so that they're actually all started in parallel. So there's a lot of interesting nuances here, but let's go and just have it start a bunch of tasks and we'll just wait for them to finish, okay? So in order to do that, we need to kind of do a two-step. We need to start all of them, hang on to the running work and then wait for that work to finish. So we'll say tasks.append, and you would like to say get report, but remember that doesn't actually start it, right? That just creates a coroutine that could be run. So we'll say asyncio.createTask that will start it and return a task that could be awaited on. So now we have a bunch of them started and we'll say for task in tasks spelled correctly, we're going to wait for the first one and then the next one and the next. So let's talk through this before we run it real quick. We're going to start all of the work with this create task of each URL. So then we'll have 10 of them running all at the same time. And then we're gonna go and say, when is the first one done? Then when is the second? When is the third? That's probably not the order in which we get the responses back, but that doesn't matter. If we're waiting on the first one and the second one's already done, the second time when we get to the second one, it just returns and says, I'm already done. You don't need to await me, I'm done, let's go. Here's the report. So it's for this purpose, totally perfect. There's maybe more nuanced cases where you wanna find which one completed first, process it first, but we just wanna start them all and then wait for them all. This is all we need. Let's try again and see if this is any different. Start, done. Oh, all right, that was fun. Let's do it again. I never get tired, but let's do it again. Start, done. In fact, let's put some timing around that. And I'm going to make a main naive and then a main main, let's say. So this one we just did. Remember what we had. We just awaited calling it directly. We don't need this. So we'll just grab the timing. Let's print out how many milliseconds to a tenth of a millisecond here. And I'll add the same code to this other version here, like that. And I'll run them both first. So we'll run the naive one and then the regular one. Click, click, click, one at a time, they're coming in. What are the results here? 300 milliseconds to do them one at a time. pretty good considering this is going all the way to New York where the web server is and I'm in Oregon but what about this one 38 milliseconds oh that is awesome what's the speed up it's about 10 times speed up how much concurrency are we adding about 10 times the concurrency of doing 10 at a time instead of one surprise we get an awesome almost embarrassingly parallel scaling by just going, ""Hey, while we're waiting on one, let's just start the other and then we'll process the results as we come back. One more time just to get some stability here. 39 milliseconds, 339. Yeah, that feels pretty stable to me. So hopefully that is impressive to you. Hopefully you appreciate this. So the idea is that we can do a whole bunch more work while we're waiting. And what are we waiting on here? The internet. We're waiting on whatever service API is we're calling all the traffic through the internet from Oregon to New York to processing that and back. And that's almost all our program does is wait on the internet. So we get almost linear scalability by adding all that concurrency. Awesome. The one weird little hitch was we have to start all the work and then begin waiting on the results. 'Cause if we just start one, wait for it to finish, start one, wait for it to finish, it's exactly the same speed as if we didn't have parallelism. So you gotta think a little bit through it, but really cool example. This is async and await, and you can see what a massive difference in terms of performance and responsiveness it makes.
|
|
|
|
48:58 |
|
|
transcript
|
0:45 |
With all the foundations and building blocks in place, it's time to dive into Beanie. We're going to create basically Pydantic-based classes that model documents in MongoDB. We're gonna connect to MongoDB and we're going to write queries, insert and update data in a real simple use case. So in this first chapter where we explore Beanie, it's going to be kind of a quick start, just standalone simple application. Later, we're gonna go, after we talk about modeling, we're gonna model the PyPI data and start building more realistic, larger data types of applications. This one, Beanie Quick Start. Let's get going, quick.
|
|
|
transcript
|
1:48 |
Hooray, it's time to start working with Beanie. We introduced Beanie before, but recall it's the asynchronous Python ODM for MongoDB where the models are based on Pydantic. So that you should already know. One more thing before we dive into the code that I wanna talk about is the foundations. So Beanie is built on top of Pydantic, but it is also built on top of something called Motor. If you've worked with Python and MongoDB before, the chances are really good that you've heard of something called PyMongo. Now PyMongo is MongoDB's official client or what they call a driver for talking to MongoDB from Python applications. However, PyMongo is completely centered around a synchronous programming model and has no coroutines, no awaitable methods, so you can't really leverage the async nature. you could still use it within Beanie, but there's another driver, another library for Python that is 100% async capable, and that's called Motor. So Motor is the asynchronous Python driver for MongoDB, where PyMongo is the synchronous one. Now, we will be working directly with Motor here, and you could write whole applications with nothing else but Motor. However, you don't get Pydantic, you don't get classes, you just get dictionary exchange. So we're just going to be using motor to connect and initialize and basically provide the connection to Beanie over to our database and then we're going to hand it off. But I want to make sure that you understand that there's two different drivers officially from MongoDB for talking with Python to MongoDB. PyMongo synchronous motor async. That's the one we want in this situation.
|
|
|
transcript
|
12:22 |
New chapter, new folder. Let's create our application code. Now in this one, I wanna show the different stages and the different steps. And so I think I'm gonna create four copies of the same bit of code, but evolving as we go. And to accomplish that, I'm gonna give it a particular name of P1 as in part one, and then we'll have two, three, four, and a little description of like, well, what is the point of this? So this is to explore how we model with classes, kind of like Pydantic, but not exactly. So in our quick start, we're just gonna model user accounts. So users, when were they created? What is their location? Things like that. Now, in Pydantic, we saw what we did is we created a class and we gave it a name and it derived from Pydantic.baseModel, right? That's pretty much what we do with Beanie as well, but we're going to derive from a different base class, one that doesn't just say this is a data exchange class, but it actually knows how to have, say, queries on it. And it knows how to, by default, bring in an underscore ID primary key that MongoDB requires. All right, so we need something a little bit more focused that is itself a base class of Pydantic.BaseModel. So let's go and add Beanie here. So in order to work with it, obviously we need to pip install it. Now I want to point out with this requirements.in, you don't have to do these steps. I'm just doing them to generate the requirements.txt. All you'll need to do is pip install -r requirements.txt. So let's do our pip compile. And it says, look, there's a bunch of other stuff, including motor right there, that we need. And we're going to pip install -r requirements. And we also learn a little bit of stuff by doing that. You can see that motor itself uses PyMongo for a couple of things. So we're going to have both, but we only program against motor. So let's change this to be Beanie. Hello, Beanie. Finally, here you are. So what we're going to do is drive from Beanie.document. So what you know about Pydantic basically applies here as well, because that is ultimately a Pydantic class too. For our user, well, we're going to want to have an underscore ID, but that almost always in MongoDB is just one of these object IDs. And unless you need to change what type it is, we can just inherit that from here. If for some reason we wanted this to be a string like an email, we could write this, but we don't have to. Okay, so let's say we're going to have a name, and the name is gonna be a string, this is username. We're gonna have an email, which is a string. And we're gonna have a password. And maybe the password is not set when we first create the document, but later it gets set through some kind of authentication process, or you know, verify your email, then we'll create your account. And so in order to create this document, just like we saw with Pydantic, this needs to be an optional, which comes from typing of string. Now, again, you could say string pipe or, I'm not a big fan, it doesn't communicate to me the same thing as this is either a string or nothing. I know the word sounds similar, but optional means like it's either a string or it's just not there. And so I prefer this, either way works. Now, do I wanna store the direct password? No, no, never, never, no. So what I'm gonna make sure is we explicitly call this hashed password or password hash or something like that. Let's call it password hash. So when you're doing auto-complete, you can say, you know, user.p and then boom there. Oh, it's not the password, but the password hash. A little bit easier on us that way. So these are all standard values that either have to be set or if they don't get set, they just don't get stored at all. There's other information though that we might want to store about this user here. For example, something that I put in most of my top level database classes is when was this thing created? I find like when I go back in time, it's always really helpful to know, oh, that was created a week and a half ago, or it was created this time. It allows you to write queries and reports that say show me all the users created this week, or how many users do we get per week, week over week as like a growth metric, okay? So a created date, and this is gonna be a date time, which we got to import, date time dot like that. Maybe we also wanna know last login date and the time they last logged in. This one, we probably have to manually set every time they log in somewhere, but when they first create their account, we want that to be the same as the created date, as well as when this gets created, no matter who inserts it, what part of code does this, We want this to get set. So we saw before that we could have default values here like Jane@doe.com. Remember we had Jane Doe for the name in our previous example for Pydantic. So we can do that here as well, but with a lot more control. So what we can say is this is gonna be a Pydantic.field. We're gonna set, you can see there's a default and a default factory. The default value is a fixed thing that is always set. So for example, it might be a number, like default is zero or Jane Doe or something like that. The default factory is a function that gets called every time this object gets created, but only the first time. When it comes out of the database, it uses the database value, but when it's never set, like the very first time we try to insert it, the default factory will be run. So with that in mind, what we wanna do is call the now function on dateTime. DateTime.dateTime.now. Now, be very careful here. When I hit Enter, what is PyCharm? And most editors gonna do, it's like, Here's a function, you wanna call that, right? Mm-hmm, no, no, no, no, we don't wanna call it. And PyCharm is showing us like, Hey, that should be a callable. And no, it's not a callable, it's a dateTime value. So what we're passing is the now function, not the now result. And we'll do the same thing here as well. Again, the very first time when we insert it, we're just gonna call now and give us that time, but then later as we get the record back, you know, they log in some other time, we'll set this explicitly. But this will give us the created date and the last login time set to basically be the same right when the user gets created. Now the last piece of data we wanna store with this user is their location. So in a traditional database, you might say something like street address one, which is a string, street address two, which is an optional string, right? 'Cause it might not be set, city, string, and so on. But in document databases, we don't have to have everything in a flat layout. We can do something a lot nicer. We can come in here and say, So we want a class called Location. And Location can have a-- let's just do a city, state, and country. You can imagine that, of course, all the other state things you've got to track. And just like with Pydantic models, you can embed one of these into the other. So we can come down and have a location. and its type is going to be location. Now, when it's set like this, we have to explicitly create one of these and assign it just like you would with a string, or we could give it some kind of default value. Don't think that makes sense here. What is the default for location? So we're just gonna have it like this. All right, so this is our user class. Now, let's go and write a main method here that we can call. And in fact, let me put that right at the top so people can see what's going on. And here, what we're gonna do is we're just gonna create a user equals a user like that. And let's go ahead and run, this will say print creating new user. Print done. Spoiler alert, we're never making it done. All right, so down here, remember my alias, I wrote my name, boom. There we go, name, dunder name equals dunder main. And let's just go ahead and run this and see what happens. Well, a lot of bad things have happened. No validator for location. Okay, so the first thing that we did is said, okay, this is not going to work because Beanie looked in here and said, or Pydantic, I'm not sure which layer looked at it and said, you know, we can't embed an arbitrary class. So this has to be some kind of Pydantic-like class. It doesn't, it should not be a Beanie.document because it'll have an underscore ID. It's not a top-level document, that doesn't make sense. So this is just a Pydantic.baseModel. Okay, run it again. There's more errors. And it says, look, the name, email, and location are required. If we go right, not there, that was too quick. But the problem is right here. Okay, it says you have to supply these values, these three values that are not either optional or don't have a default. So what we need to do is go over here and explicitly set the values that are required. So we've got to set a name and an email and a location. So name equals Michael, email. I create this location inline, but it's another object. Let's go ahead and create it separately here. And what does it take? It takes city equals Portland, state equals Oregon, and country equals USA. All right. Now that we're setting this, let's see if this code will run. Now there's one more thing we got to do in order to work with this object here, and that is initialize the connection. So basic Pydantic models are perfectly content to have us just create the model in memory, but Beanie documents ensure that they'll be able to do things like write queries or save itself to the database. order for that to happen, you've got to already set up a database connection before you create one. Okay. Just so you can see some output here, let's temporarily put this as a pydantic dot base model. And I'll comment that out. Okay, all the validation passes. And let's just print print out the user to see what we got. So you can see the stuff that we set, the name and the email, the password hash is none, but because it's optional, that's fine. And check out the created date and the last login date. Excellent. And the location itself is an embedded location, Portland, Oregon, USA. Super cool. Super cool. Okay. For this, I told you there's multiple parts. For part one, I'm going to leave it like this with the beanie.document commented out. But of course, when we get to the next step, which is connecting to the database, we're going back to the Beanie model.
|
|
|
transcript
|
10:43 |
We saw that connecting to the database is a requirement before we can even create one of these Beanie documents. And that's to make sure that once you do, you're able to save it or make queries on it and so on. Now, that's what we want to do in this step. So let's go over here. And this one we're going to call P2 for Part 2, Connections. and make sure we run this one, otherwise there'll be some mysteries about why what we're writing is not happening. So what is the goal of this one? This is to connect to MongoDB with Beanie, really with Motor, as we pointed out, but ultimately connect Beanie to MongoDB. So we've got this part here, creating a new user, and now that we're starting to do more things, So let's make this its own method, so Control + T, Extract Method, and this is going to be Create a User. All right. And then before that we saw we really need to set up a connection. So let's go and create that function. For this, the first thing that we're going to need is a database connection string. You might be familiar with these from other servers, like Postgres or SQL Server, but also you might be familiar with MongoDB. Call this a connection string. We need that to be an F string in a second. It goes mongodb colon slash slash, so that's the scheme, localhost port 27017, the default MongoDB port. Of course, if you've changed these or set up the server somewhere else, you'll want to make a change here as well. And then we put slash the database name. So I'm going to put that as a variable, maybe we could even pass it over like this, DB name, and say that that is a string. Alright, so up here, let's call this beanie quick start for the beanie quick start DB. Once we have our connection string, we need to create a motor client. We'll say client equals motor, which we have to import. What we really need to import is .motor_async_io. And from there we want to async_io motor_client like that. And we'll just pass in the connection string here. And let's go ahead and just print out are we connected to the database. I guess maybe do that the very, very last thing here. And now what we need to do is connect motor to Beanie. So we're going to say Beanie.initBeanie. And what we need to do is set the database equal to the actual database object from this client. bracket like a dictionary, DB name. The other thing we have to do is we have to say what classes are being mapped over to this database. You could actually have multiple initialized sets of classes and one going to one database and another going to another database. You might do that if one is logging and temporary and you don't really need to keep careful care of it or back it up frequently, whereas you might have user data, you backup constantly or you store in different locations. So we need to say document models, and into here we put a list, and what goes in the list? All the top level documents, not the embedded ones, just the top level one. So we're gonna give it a list of user. Now PyCharm says, well, this is not exactly what we were looking for, and that's because we need to put this back. Remember we disabled that just for a second so we could create one of these objects. Now again, this is okay, great, a list of document classes, not just Pydantic models. All right, this looks like it should work. It is not going to work. There's one final thing we need to do. And that is a consequence. This is actually the error. This error trace malloc warning, what that means, it's a terrible error message. What it means is this actually returns a coroutine. move it up a little. This returns a coroutine and it's async. So we need to await talking to the database. Everything we do when we talk to the database is async, including initializing it. So we want to write await. And in order to write await, we saw that this has to be an async function. So where we call this, we now need to write await. In order to do that, this has to be be an async function. And so finally, this call is just going to create the coroutine and do nothing. Right? Nothing. So what we need to do, actually, you can see that error message a little better if you scroll over coroutine main was never awaited. So we need to as we saw before, asyncio dot run the top level async routine, let's import that. Now, this all should work, we should be able to call this asynchronously, we're awaiting talking to the database. And then this part where we create a user should no longer freak out saying it's not set up. Here we go. Look at that. And notice there's two additional fields that we didn't see before the ID, that's the primary key and the revision ID. Revision ID is for something called optimistic concurrency. So if two parts of your application, or two users in a web app, something like that, concurrently, pull up an object, they both pull it up, this one makes a change, saves it, this one made a different change and saved it would overwrite that whole document. So this revision ID says, Well, if you want to use it, when was this last changed, the first one would make a change, save it back, find this one would say save it back where the revision ID matches my current revision ID. And it would say, nope, can't do that because there's no such document with the original. It got incremented by the other user. All right, so that's the optimistic concurrency story. That's what that's there for. Awesome. So it looks like we connected to our database successfully. Let's just go open up Studio 3T here and see what we got. Not here yet. So we've connected to it and if we make any interaction with it, it will show up, but we don't yet see our database. So the final thing in our create the user, set up to do, just make sure set up the database connection before. Let's go ahead and print the user in two places. Now we want to save the user, so there's a nice save and this will insert it if it's new record, like the ID is none, or it'll update it if the ID exists, right, if it's already come out of the database. Again, every time we interact with the database, this is a coroutine, so we have to await it. And that means we need this to become an async method, which means up here we have to again await it. Perfect. Try again. Look at this. Created a new user. Before the save, ID was none and revision ID was none. And then the name, email, and so on. The object ID is now set by MongoDB when we did that insert. We're not doing anything with revision ID, but the rest of the values are the same. Very cool. Do we have our user saved in the database? Let's see. here, we will refresh. First of all, do we even have a database? Oh, a beanie quickstart. Let's open that up. We got this collection of users. And in here, what do we get? Look at that. We've got our object ID set, we've got our created date set x through our default method, save for the last login email, our embedded location object, Portland, Oregon, Michael for the name and password hash is null. Excellent, excellent. Now if you run this code multiple times, because we're not setting the primary key, we're going to run this and just get many, many Michaels in the database. So be aware that you can either clear out this database, or I'll skip just ahead for just to make sure that we don't get extra duplicates in here. here. So let's say this, we'll say if a weight user.count greater than zero, print, already have a user. Let's try that. Oh, we already have a user. We could even update this a little bit and say this is a variable, user count. We already have users, of course, it'll say users when they're one, but you know, we're not going to worry about that. Already have one users. Excellent. Very nice. This is how we connect to the database. We have to have, remember, everything we do with the database is async. So we're going to go and create an async method that will let us initialize this connection. Create a connection string to your server. Of course, there's many more settings that can go into that connection string. Username, password, replica rules, a remote server, SSL certificate details, many, many things, slash database name. And then we create an asyncio motor client from the motor library with that connection string. We hand off the database object to Beanie as well as express which users are managed by this particular connection to this database. Here we go. And then we can go do queries. Again, this is a real simple one. We'll get into that better in a minute, as well as we can insert them by awaiting a user.save or something along those lines. Pretty cool. Step two, connections all set.
|
|
|
transcript
|
4:02 |
Let's talk a little bit about inserting new data. So again, we're going to copy this and edit on, so you have it saved at different points. Make sure we're running part three. And we are. So right now we have create a user. Let's do insert multiple users. This one doesn't exist yet, but it's going to be really similar to create a user. So we'll jump down there and we'll just duplicate that, Command or Control D in PyCharm. I'm going to call this one insert multiple users. So here if we have four or more users greater than or equal to four, you already have however many users you have, because we want to, we're going to create a set of users, different users. Now we had this one before, but let's actually get three different ones and insert them into the database. So here you can see I've copied over three different accounts, just one, we got user one, two, and three, it's Michael as before. We have Sarah from Tennessee, and we have Kylie from Baden-Württemberg in Germany. We're going to insert all three of those into the database here. Now one option, we could do just what we had before, u1.save, and u2.save, and u3.save. That'd be fine. That makes three separate calls to the database. might want to do this all in one shot. So in addition to just saving or inserting them one at a time, remember, save will insert it if it's new, and it will update it if it just has changes but already has a primary key and it's come out of the database. Another option is we can go to the object, the type itself that models that collection in MongoDB, in this case, the user. And you can see that there's options on here as well. So we can do things like insert many, anything that has a CLS as the first parameter, these are things you can do on top of just the type itself, right? So you have, that's how you do your queries, you can see find and find one. But what we want is insert many. And here we can just put you one, you two, you three, and I guess it's probably most efficient as a tuple instead of a list. But it doesn't really matter. Now, PyCharm is saying, you know, this thing here, you really should be awaiting it. Coroutine is not awaited. Remember, anytime you interact with the database, you need that. Expected a list. All right, I'll make it a list just to make it happy. I'm not convinced it really needs it. But let's make it a list. So here we go, we're going to insert many into the database. So when we checked whether we could insert the one that was already there, and now we created a set of users and let's go back to the database and have a look here. Run it again. And now if we go to tree view, we've got multiple ones. And guess what? This is probably Kylie from Baden-Württemberg location, expanded that out. Yeah, sure enough. And here's Sarah, right? We inserted all of them. Beautiful. We have two of these options for inserting them one at a time through save or we can insert many. Just a side note, I changed this to have optional city because my little preloaded data didn't have it. All right, so that's how you insert data either one at a time as we have on the screen right here or bulk writes like this.
|
|
|
transcript
|
8:43 |
Carrying on, let's go to talk about queries and how we can do queries from our database. So again, copying three to four this time, let's go up to the main and really I would have preferred to talk about queries first and then inserts. But guess what, without data, super boring, super boring to run queries against nothing. So we're going to write another async function about getting some users back from the database and even making changes and saving those changes back into the database with Beanie. So I'll call it find some users, but it's really find and update some users. Again, I'll have to be an async function here. And kind of hinted at this a little bit previously when we talked about the class methods. So if we want to do a query, we can come in here and let's say we want to find all the users of a particular country. say the users are and we go to the class the type. And here we can say, find, find one find all which really awesome about beanie is it lets us program against this query system by building these queries, actually using the types that Python knows and understands. So things like refactoring work and type checking work. So what we do is we want to find let's say we want to find all the users in the USA, and the users in the USA, we're going to update their password. So we're gonna go user dot location dot country, equal equal, right, that's how you do it in Python, equal equal, USA, MongoDB is case sensitive, as I said before, so be really, really careful. So there's multiple ways in which we can get ahold of these users. And I'll just write two queries here for them. So we're gonna get the users back. Now maybe we want to have them sorted in some way like by their name. So we can say sort user dot name, not dunder name, but just name. And in this all at once mode, what I want back is I want a list of users. So over here, I want to basically have the type be list of user. In order to do that, we have to say to list. Now, so far, this has just been a cursor type thing, it returns a query fluently. But now this to list, this is a coroutine. In order to get the results and execute the coroutine, you guessed it, we're going to await that result. So for a moment, let's just print users just to see what happens. All right, let's print them out. Now, remember to run the right one. There we go. We have a user with their object ID, Michael, countries USA, and another one. And we could do it like this make it a little more obvious. You can see Michael, Michael and Sarah. Remember, Michael kind of got inserted twice from the created user and then the insert many but whatever, it's fine. See, we got the right one. And look at the order, we got them, Michael, Michael, Sarah, we want them in the other order. There's a couple of options here for the sort, we can put a negative sign right here. When we run this, and you get Sarah, Michael Michael. Unfortunately, you also get a warning here that this isn't going to work. We can suppress that for the statement if you want. Or you can put negative name in a string without the user. Just negative name and that will also work. So not a huge fan that that comes up as an error, but still, it's pretty awesome. Pretty cool way to program against it. So this is one way this gives us all of the users. And let's do another one, where we just have an iterable something that we can loop over. So we'll say users again. And this time, we're not going to immediately awaited. So imagine there were 10,000 users. Well, do we want to put all of them back into memory at the same time and then start working on them? Probably no, maybe, but maybe not. So instead, what we're going to do is we're going to create this, let's call it a user query just so we can have a slightly different name here. And instead, what we can do is loop over and loop over it in your mind may seem like for you and user query. Do something with the user, right? However, this is not your regular query. This is an async query. So here's a language construct you may not have run into before. I need to asynchronously work with this query object to start pulling back and awaiting as we're working with talking to this cursor every time through the loop. So what we can do is we can do an async for. Notice the arrow went away. And now there's our objects printed back again. Very, very cool. So the last thing to do I want to make some changes to this object. Instead of printing it, we've decided that everyone in the US, they've got the most awesome password. It's going to be just the letter A. Okay, the hash of your password is. We're going to update those. Now this doesn't do anything in the database. This changes the objects in memory. But something like that will. that will actually go and push those changes back to the database. Then down here we could just print upgraded security for all USA users. Let's go over here and first look and see that. Here's Sarah from the US and her password hash is null. Run it again. Upgraded the security for all USA users. We refresh our results here. Let's go to a JSON view because why wouldn't you? And then you can see when it's USA, your password hash is A. When it's USA, your password hash is A. Same thing here. But if you live in Baden-Württemberg, or whichever land, your password hash was not updated. That's how it works. We go and we write our queries. The same thing would have happened if we had just used this list here that we got back in memory and looped over it and called save on each of them. But this is a little bit better if you wanna stream the results out of the database. So you can either call one of these dot, we could do like a first or none, or we could, well, it would just give us one or none if there was no matching ones, or we could get the whole list. Those are all directly executing. Or we could come up with the query and then asynchronously iterate over the cursor to start processing the results. Now maybe you want to run an and type of clause here. Maybe we could do it like, start to wrap this around so we can see a little bit better. You could do multiple finds, like so. Just print out the names here. So here you can see Sarah is now gone and we just have Michael because Michael is the only character that is both in the US and has the name Michael. Pretty cool, I guess if we even had a German Michael, they wouldn't show up. We can't, it would be left out because of that clause. So this is an and, or we could do it like this, doesn't really matter. Same result. We can either pass multiple restrictions, multiple filters to the find query, or we can have multiple find clauses pile up on the query itself. In the end, the same thing goes over to MongoDB, so not really a big difference there. When we talked about the native query API, we also saw that there were things like limit and skip for paging. So again, all of these things are here. So limit, let's say five, let's do paging, let's say dot skip, three times five. What this would do is say, we're going to get the fourth page, zero-based, fourth page of five results and just go get the next five and show them. Now that doesn't make any sense because we only have two results, so it's going to be empty, but all those things are still available here. Almost all the queries in native Mongo have some Python equivalent over on the side. We'll see more of them as we get into the PyPI data modeling.
|
|
|
transcript
|
5:28 |
Alright, final thing in the quick start here was how quick was this quick start? It's been a while had we've been working this for a little while. So maybe it wasn't that quick, but not a true deep dive. There's plenty more to come. Anyway, the final thing in this semi quick start is controlling what the database looks like. So if we go over here, you notice that when we are doing our queries we have capital U user. Well, this just strikes me as a little bit off a little bit weird. The collection by by the very name of it, it collects things. It's not a, it's not a single thing. It's a collection of things. And so there should at minimum be users. And because MongoDB is case sensitive, I'm not a huge fan of uppercase names for our user here. So I'd rather have this called like lowercase users, you know, like this, but obviously, that's not going to return any results because there's no collection named users. So how do we control that in this place where we just have these classes, right? I don't want to change this to lowercase users, that would be equally weird, maybe even worse. So what beanie does is it lets says create a class, an inner class, no base class or anything. And the fields of this thing allow you to customize how this looks over in MongoDB. So the first one you probably almost always want to set is the name. And this is the name of the collection in MongoDB. It can be closely related, like we have users and we have user and users, or it could be accounts, it could be something completely different, right? So we're going to call ours users and let's just rerun this and see what happens. It helps if you rerun the new one. There you go. See, notice it's actually inserting all the objects because, well, they weren't there before. Let's go and see what happened there. If we refresh this, there's now an old users and a new users. There's ways in which you could rename this and stuff, but I'm just going to drop that collection and put it back in the way I would like to see it. So now if we run this again, look at that, our users are back. Well, they're recreated rather. So this is really cool. Let's do one more thing. We did that query up here where we're asking for user.location.country is the USA. Let's run that query over in Mongo. Remember, the second thing that goes here is the projection. So let's just say name colon one and location dot country colon one. So notice down here, things look simpler. And remember, I don't want the ID. So I'll say underscore ID zero. And bring that up. Okay, so here you can see no filters yet. If we put a filter in here, what do we want? We want location dot country equals USA. So because that's quoted, I need, or it has been dotted, I need to put those. Let's put this in quotes. And of course, JSON like this. Look at this, we're now down to just the three records. How is this query happening? We're going to get into this later, but I just want to show you that there's some kind of effect here, .explain. If we ask it to explain itself, you can see in the query planner that this is an index filter set, no. And it tells us anything else. The winning plan is projection default and then column scan. That's just loop through it. Okay, so what that means is this is not running an index. We'll get back to that later. But final thing in this section is, I just want to point out that not only do we have, I'm gonna point out the settings, not only controls things like the name, but we can have indexes. And this is probably the time, or the place you spend your most time working in this little settings class here. So let's say we're gonna have one for location.country. That's what we were working on before, country. If we run this again, go back over here and we can refresh the indexes and look at that, we got an index, scooch over, on location.country, ascending, perfect. Without the explain, you see we get the same results, but if we run the whole thing, you see that the input stage is an index scan using the index location.country for that filter right there. All right, so that's the settings object. We're going to spend a lot of time basically once we've modeled our classes to really control the MongoDB settings and features of that collection using this settings class. Things like indexes, projections, the name of the collection, all of that. So really important part, pretty straightforward, but this is where you pass that not Python information but MongoDB information over to the database.
|
|
|
transcript
|
3:12 |
Let's do a lightning review of everything we've covered in that sequence of demos. One of the first things we did was connect to the database. And remember, everything you do with regard to talking to MongoDB through Beanie has to be async. So that has to happen in an async method and you have to await the function calls there. So in this case, we come up with a database name, we create a async I/O motor client, client, that's the MongoDB async driver, and we pass our connection string over. And then we just await beanie dot init beanie, and we pass in the database object from motor in a list of classes that are supposed to be collections, modeling collections over in that database. We saw that if we try to work with something like in this case, the user, and it was not associated with a connection yet, beanie will throw an exception and not let us create one. So this has to go first. Then we created these model classes. There are Pydantic classes, but more specialized in that, there are Beanie documents. And you work with them much like you do Pydantic. We've got a name that's a string. We have an email as a string, and we can be more explicit with the Pydantic field types. You can have optional strings for our password. You can have defaults for a created or we pass in a default factory. And we can even explicitly set a value. Here we're setting image URL to none, even though that's really what it'd be set to anyway. In document databases, it's very common to have a hierarchy of embedded objects inside of a larger document. And we model that just with base pydantic stuff. So here we have a location, which is not a beanie document, just a pydantic model. And because everything is optional this time, when we use it down in the user object, we actually create a object that goes there that just has the state and country not set by using the default factory and setting it to the constructor or the initializer of the location class as we do here. So remember, these are not, not only should they not be, it's a really bad idea to make these beanie documents because, you know, take along things like the revision ID and the actual ID, none of which makes sense for an embedded object. When we insert data, we can create them just like you do something in another class in Python. We await saving them that will insert those two. Or if we want to do this as a bulk insert, we can use the type and say user dot insert many and give it a list. To query data, we just work with a type again. So user dot find, we pass some constraint. Notice how cool it is that we can traverse the hierarchy of the user down into its location, nested objects, and test the country. You can sort, and if you want to execute it right away into memory, we call toList, and we have to await that. Or we can create a cursor without calling toList, and then asynchronously with an async for loop over it one at a time more efficiently if you're not going to store it in memory.
|
|
|
transcript
|
0:40 |
Would it surprise you to know that I've had a podcast interview with the creator of Beanie, like I did with Pydantic and FastAPI and others? Yes, I did. So Roman Wright, the creator of Beanie, excellent guy, super supportive, really engaged with the project. I had Roman on the show back in January of 2022, where we talked about Beanie, why he created it, how it worked. It was a younger project back then and it's really matured a lot. So get a good idea of where he's coming from and some of his design philosophies. This is a great lesson if you got some time and you wanna go deeper into the background of Beanie.
|
|
|
transcript
|
1:15 |
Let's close out this chapter with one final pointer. Throughout all of the code you see me write and all the examples, you've seen async and await. Async methods and awaiting function calls all over the place. That's great if you want it, but sometimes you're just writing synchronous code and you don't want to have to introduce all the layering, let's say, that running async code requires. So I might need to await a query. Well, then that function itself has to be async and then how do you run it where it gets called, right? That can be a bit of a challenge. So Roman Wright, the creator of Beanie, also created something called Bunnet. And Bunnet is basically a synchronous API version of Beanie for MongoDB. So if you'd like to use that, here's an option. I'm on the fence about how much I'd recommend using two separate libraries for these two situations rather than potentially just saying, I'm just going to call asyncIO.run more often, you know, down inside some function. That said, if you want a synchronous version, check this out. It's not as popular, not even close, as popular as Beanie, so take that for what it's worth. But you know, thanks Roman for creating this.
|
|
|
|
13:25 |
|
|
transcript
|
0:57 |
At this point, I'm sure you've seen we have a lot of flexibility with modeling data with documents, usually way more than we have when we're doing relational data with tables. That begs the question of, are there best practices for modeling with documents? In relational databases, we have third normal form. That comes out of some of the constraints maybe of the 1970s to save space on data more than on compute, but it's also about ensuring the right relationships, ensuring there's no data duplication, and those kinds of things. So does third normal form give us guidance? Well, yes, sometimes, but not entirely. There are other considerations and other options that we might have when we're working with document databases like MongoDB. In this chapter, we're going to spend a little bit of time talking through a couple of examples, of those best practices and trade-offs you need to consider.
|
|
|
transcript
|
3:27 |
Let's begin with a contrasting example from our PyPI data itself. So how might we model data with these document databases? Well, how would we model it with a relational database? Here's one option. So in our PyPI data, we have things like packages. These are Beanie, FastAPI, PyMongo, the stuff that's on PyPI that you pip install. Those actually have multiple releases for their different versions. And those, once those versions are published, they don't change. So we're going to have this relationship from package to its multiple releases, a one to many relationship there. And then we have users who can be either just regular users, or they can publish and maintain a package. Now, in order to understand what package is published by which user, there are multiple users that can manage or publish a package. And there are users who can have multiple packages like SQL model and FastAPI for Sebastian Ramirez. So in order to model that this is a many to many relationship, we need this relationship table called maintainer that has a composite primary key of package ID and user ID. And this sets up that many to many relationship for us. This is what we would do in something like Postgres or SQLite. And this is basically the third normal form for this data. If we look over at the Mongo side of things, usually what you will see is there are fewer. Oftentimes, as you get those little relationships and those many-to-many relationships, oftentimes you'll find much, much simpler data models over on the MongoDB side. So here's how this might look in MongoDB for the same data that we just discussed. We would have our user object and that's basically standalone. And the other really important thing is the package, right? Here's Beanie and it's license and who maintains it. But notice the maintainers is a list of object IDs. So instead of having that many to many relationship table, we can just choose either the package or the users and we can associate that many to many relationship here. So for example, suppose you have user one, we could have in our package, we could have user one and user 20, but we could also have multiple packages where user one appears in that list. That's that many to many relationship. More significantly though, not just combining those many to many tables is the releases. So we had a separate table for releases, Maybe, just maybe, this is a big maybe, it makes sense to embed the release objects inside of the package. So anytime we get the package, we just already have its releases. So what are some of the differences and similarities? Sometimes we have these relationships, right? This is not a embedded user, it's the ID of the user. And so that's really a relationship that we're embedding in there. Other times we might actually embed objects in like the releases. So in here we have multiple objects and inside that dot dot dot, that's all the details that would have been columns in that releases table.
|
|
|
transcript
|
5:11 |
So in MongoDB, one of the really big questions is to embed or not to embed. When you have a relationship, does that relationship belong inside of another document or does it involve some other collection that you traverse that relationship with? So I'll give you a couple of guidelines here. But remember, the way you want to think about these relationships that are embedded, example, packages and releases, is that that is a pre-computed join. Instead of saying we're going to join on the package and release table and get the results, we're just going to always have those stored on disk so we have instant access to that combination of data. So the first thing we want to ask about this possibility of embedded data, again the releases in this example, is that That embedded data wanted most of the time. There is an overhead of having that data embedded into the other object. For example, if I just say, give me the package with the ID beanie, I'm not just going to read the top level information like when it was released, who is the maintainer, I'm also going to get all of its releases. And that involves taking data across the network, deserializing them and so on. So that has a cost to it, and you want to consider, do I normally want this data? Because if you rarely want it, just occasionally you might need it, you don't want to pay that cost, all right? You want that as some separate thing you can go look up with a separate query. Think about it in reverse as well. How often do you want that embedded data without the containing record, without the containing document? So is it super important that I get just the details about one release, but I don't care what the package is, I don't care about the other releases that might also be bundled in there? It's certainly possible to get just one release with a query, but you always are going to bring at least that other embedded data. So for example, if I were to write a query in MongoDB, I could say, give me the release that is whatever I'm looking for, release 1.5, no problem. But there's no way to limit what you get back to just that one release. At a minimum, you're gonna get all the releases and have to identify that in code. So that's a little bit tricky. If I wanted the releases separately and individually, that's not a good choice to embed them. You also wanna think about document size, how big an individual record is. This is something you consider in relational databases, like how many columns are you going to put into one row. But with document databases, the hierarchy can be much, much larger. So there's actually a hard limit on how big a document can be in MongoDB, 16 megabytes. That is not ideal. This is not something you should aim for. Like, well, I only have 14 megs, so we're good. No, you wanna stay far below that if possible, right? This is just a limit where MongoDB will cut you off and say, look, you got a problem. we're not gonna let you save this record anymore. So is this embedded thing in our case releases, is it a bounded set? Because if it's unbounded, it could grow beyond the 16 megabyte limit. Imagine you had a CMS and a page was modeled in MongoDB. Would you wanna put the visits to that page into the MongoDB record? No way, because on a popular site, that thing's just gonna keep growing and growing and you're gonna spend all your time pulling back analytics that you don't care about, right? and that could grow beyond 16 megs, you wouldn't even be able to save or edit the page anymore. That'd be bad. But again, 16 megabytes is not aspirational. You want it much, much smaller. Maybe 10, 20K might be some kind of upper bound you wanna think of for a lot of your records. Another question you need to ask is how varied are your queries? Remember, these embedded documents are kind of like pre-computed joins. And if you know, well, I'm gonna ask this kind of question and a lot of times I want this data and that data back, you can really carefully structure your documents to match those specialized queries. But the more different types of questions you ask, the more angles you ask it from, start to violate or break down number one and two here, right? As you ask different questions from the data from different angles and perspectives, the chances that you want that data 80% of the time go down and down and down. The chances that you might want the contained document alone so just one release without the other stuff, that goes up. So that puts pressure on saying don't embed, right? So the more varied your queries are against the same bit of data, the more likely you're gonna treat it more relationally and less embedded. Finally, you might ask, do I have an integration database or an application database? We'll talk about that next.
|
|
|
transcript
|
3:11 |
Wait, what's an integration database? Good question. Databases serve different roles, especially in larger organizations. Oftentimes, a database is a thing that just holds the data for your app. Interestingly, it's often used to handle concurrency because of its natural acid properties that different databases have. So it serves really interesting roles for a single application. but at large organizations, sometimes this even goes beyond serving a single application. This often is one huge relational database that's on a really big server, you know, that is about as big as you can get it. How much RAM can you put into the computer so the whole database, where the whole company can be in memory, that kind of stuff. So in that case, we might have multiple applications, different apps that are handling user-facing stuff, maybe some that are doing reporting, all sorts of things, all talking to this one database. It is the glue that holds the applications of this organization together. In this case, you probably don't even really necessarily wanna use MongoDB or other NoSQL databases. You need something that has really, really strong enforcement of the schema because as these apps change over time, you don't want them to have slightly varying opinions of what a user looks like or what an appointment document looks like. So you want something that absolutely says this is the structure of the database and relational databases are actually really good at crashing your application when the schema doesn't match exactly what you're talking with. More likely you have an application database, whether this is in the cloud or it's hosted on your own server in the cloud or even on-prem. And it looks more like this. We have the same applications, but they all have their own dedicated database for the most part. There could be some sharing, but it's not the glue that holds the company together. And then we have them interact with each other somehow through like web services or message buses. databases generally fit better into this kind of structure here. And when you have this kind of structure, the important thing is all those questions we talked about before. How varied are your queries? How often do you want one bit of data when you have another piece of data, right? If I have a package, do I want its releases? Well, when you have one application with one job talking to the database, it's usually less varied queries, more likely you can predict when you want other data. It's a little more specialized. And so it's easier to design the documents to fit the goals and the queries and the data modeling of that application instead of across applications like we saw in that integration database. So if you have an application database, it's more likely that all those criteria I gave you are a good fit for your app.
|
|
|
transcript
|
0:39 |
Looking for a little more guidance on this modeling thing? Well, of course, we're gonna be going through it in detail in the course as we're working with PyPI data, but for a more broad conversation on MongoDB and document database design patterns and that kind of thing, you might check out episode 109 of ""Talk Python To Me, MongoDB Applied Design Patterns"" with Rick Copeland. He also has a book over here from O'Reilly that you can check out. So he and I spent about an hour talking over different scenarios and ideas for modeling data in MongoDB. So check that out if you want to go a little bit deeper.
|
|
|
|
1:20:36 |
|
|
transcript
|
0:47 |
The stage has been set and we are ready to dive into the main app that we're going to focus on for the rest of this course. That is creating our API using Beanie and Async Python for our PyPI data. So in this first chapter, we're just going to put all the models together. We're going to put together the connection and basically just get all of that data flowing And then in subsequent chapters, we'll do things like connect it to an API through FastAPI and think about making it more high performance, those kinds of things. So now that we've done our semi-speed quick start, we're going to actually be able to fly through this pretty quickly to connect Beanie to that PyPI data.
|
|
|
transcript
|
1:03 |
So we're ready to build that API for PyPI. It's worth pointing out that this is just a theoretical API. There's an actual one that PyPI makes available for certain use cases, not the least of which is pip itself. So that is not exactly what we're modeling. This is just a theoretical one based on real live data that I've gotten for the top 5,000 packages from PyPI. And speaking of which, you can download those right here. Recall at the beginning in the setup section, we actually went through and set up the tools and we imported the data. So if you haven't done this yet, be sure to go to the GitHub repository to this section where it talks about data for the course and the steps to installing it. You can see the link here at the bottom. You can also go back and watch me do this step by step if for some reason you're having trouble to get this to work. But we're going to assume, as we've already done in this course, that this data is imported and installed inside of MongoDB and ready to go.
|
|
|
transcript
|
5:15 |
Let's start off by talking through the data exactly as we have it in MongoDB. Remember when we talked about modeling in the previous chapter, we gave a sense of how that might go, but let's actually look inside of Mongo at the data and see what we're working with, okay? So over here, I've opened up the free edition of Studio 3T, and this is the connection that we created when we talked about this tool the first time. And over here, you can see we have our PyPI data, And the most important part are these three collections. Recall that MongoDB doesn't have tables, it has collections because, well, it's not tabular data. That's actually the whole point. We've already played a little bit with this user data. So let's have a quick look at that. And we can just pick an arbitrary one here. This is apparently some info@2capture.com, whatever that is, account. So all these have, basically all of the MongoDB documents have an underscore ID, which in Python as just an ID property or field of the Beanie or Pydantic class, right? So you don't have to worry about the underscore in Python, but that's how it is in the document. And unless you do something special, it's an object ID. You can change it to be something more unique if there is a unique aspect of that account. So, for example, potentially we could use the email address, but if we want to let people change their email address, you don't necessarily want them to change their primary key. key, possible but not ideal. So we're not using their email, even though that may be unique. All right, so we got their name, email, password hash here, the created date and login date, as well as a profile image. If they have one, in this case, we don't have one. We also have this location for them, this state and country. I don't know that we actually have that data out of PyPI, but it's just something we're modeling to show you kind of how you might do that with an embedded document. The next one we have is very, very simple. release analytics has one record because the way we're modeling the packages with the releases being embedded in there is really hard to count how many total releases there are. So this is a place where you have a tiny bit of data duplication to open up possibilities for much more productive sort of embedding for the 95% use case. And then finally we have packages. Again, we have all of our top pieces here and check out this one. The name of the package in PyPI cannot change and it has to be unique. So we don't need to have a separate object ID plus a uniqueness constraint on some package name. We can just make the package name, the string itself, be the ID, which is pretty cool. Again, like everything, we have a created and last updated date. If you go view this package on PyPI itself, and we just put in its ID here, this part, this project description, the easiest way to quickly do such and such, and has all the code samples and the tables and all that. That is exactly here, Python module, the easiest way to, and it just goes on and on. Here's the markdown code parts and the tables, which is why you can see like, there's this huge long bit of text, and we don't wanna have code, you can't fold that over and so on. Like you can't, normally there's a way to say, like click here and collapse this chunk. So as you know, it's just too much. We're not doing that right now. So anyway, that's what this lesson is about. But the description is basically the readme for the PyPI page, homepage, package URL. This is the page we just pulled up basically. Who the author is, the email, and then if there's a license specified, sometimes there is, sometimes there isn't. And then we have the releases. And this is an embedded array or an embedded list. Here's the array part and here's the embedded object. So we have the version made up of those three pieces. We have the created date, the comments, the file download, the size of that download. And you can just see all of those here. And finally, if there's any maintainers, we'll put the maintainer IDs in here if we have found that relationship. When I downloaded this data from PyPI, I didn't download all of it. I did not, I don't know if it terabytes, many, many gigabytes. I don't know how much data it is, but it's a lot. I just downloaded the top 5,000. So some of this data might not be 100% all tied together, but that's the model that we're using. Some of the places might be empty like this, and sometimes they might be filled out. But this is the most important thing that we're gonna focus on is this packages element here, because it represents the main thing that you care about when you go to our API. but we also have our users and we have our release analytics to allow us to answer really simple questions like, over here, how many releases are there? This is easy on a MongoDB query, this is easy on a MongoDB query, but this one, because of the way we've embedded it, turns out to be a bit of a challenge. So we're kind of storing that data separately in the database. That's our data model that we're working with. So we're going to take those JSON, BSON definitions and turn those into Beanie classes.
|
|
|
transcript
|
8:35 |
So to create the Beanie models, which recall are really just Pydantic models with a couple of extras and a different base class, we want to go and define that class. Now we could do this by hand, or we could come back to our friend JSON to Pydantic. And we're just going to use this tool here because we want it to match exactly and it doesn't make that much sense for you to watch me go, Oh, it was an underscore in the created date instead of no underscore, just the words together, things like that. So what we're gonna do is we're gonna go to Studio 3T, grab the JSON representation and drop it over here and then convert it, and then we'll actually do some editing on these classes. So step number one, get a rough representation to start with so that we don't have to drudge through that. Let's go. Over here, notice we've got things that are actually not part of JSON. We have this ISO date up here. This is great. We also, if you go, let's see another one, for example, object ID. This is not a thing that is in regular JSON. So remember this JSON to Pydantic is not JSON to Beanie. It doesn't understand MongoDB things. This is gonna say, this is a malformed JSON. So what we can do is we can come over here and say, customize the view to just show pure JSON, which will help us with this. You can also just edit it by hand, it's not a huge deal. The other thing is, is we go through here, you see there's multiple records. So let's just get one that we expect to be representative. So we'll just say limit one, that way we can just come down here, Command + A, Command + C or Control + A, Control + C. Right, so this is gonna be the most complicated one, this packages one. Let's put that in here first. Hello bar, goodbye bar. We give it a second and over here we've got our type. So this model, this is actually what we're gonna call package, then this is our embedded piece here and then we have those, all right. So I'm just gonna take these pieces, here's too many layers of scrolling and let's put that into a class. Also notice that you can have it auto adjust your API, your names and so on there. If you're working with like a C# API or a JavaScript API that has a different naming convention. Over to chapter eight, Beanie PyPI. I'm gonna make a folder here called models, lowercase models. And that's where I'm gonna put these different classes. We could make a module called models, but I kinda wanna have it like this. I really prefer, if you have taken my courses before, you'll know that I prefer to have one class per file or really focused files and have more of them brought together. So that's what I'm doing. You do what you like. So this is gonna be Package, like that. And we'll just do a paste. Now, notice I would rather type Pydantic for the moment here and import Pydantic. Now, because Release is not a top-level object, it is actually an embedded object. Pydantic base model is the right type here. This one is gonna be package and this is not gonna be a base model, right? It needs to be something that, for example, brings in the queryability and the ID. So this is gonna be a Beanie document. And this docs URLs, a lot of times where we have any, it's because it was null. So we want this to be optional, but it's not actually any, it's a string or it's optional. Just because it's null, the Pydantic converter is like, you've given me no information, so this is what you get. I'll say this is an optional of string. And let's go ahead and apply that to a couple. For example, this could be that way, package URL, author name, especially the any. And this, in newer Python, we can use a lowercase list as of three, and this is going to be a list of bson.objectId. That comes from MongoDB from PyMongo. And again, up here, this is going to be a dateTime. We need to import that, datetime. Remember, datetimes, for whatever reason, don't exist in JavaScript and JSON. So there's no way for it to know that this could be a datetime, right? This is one of those bson upgrades, just like the objectId at the bottom here. And we have our list of release. Okay, this is looking totally good again, int, int, int, create a date comment. This should be optional. I think that's the only one that needs to be optional there. Excellent, so we've got everything working for our most complicated part of our data model, the package and its nested embedded releases. Let's do the other two real quick and we'll have these models put together. This one, we could do the limit one, But you know what? Not necessary. Now again, notice it says invalid JSON for a second. Let's just turn that, tell them that's a string. So this is simple enough. We could have typed it in ourself. This one, recall, was called release analytics. So we're just going to call the class name that as well. [no audio] This should be a Beanie document. And it's going to be ReleaseAnalytics. The class, this we don't have to put here, right? Explicitly this is handled by the base class, and this is an integer, so pretty simple, right? There it is. And finally, the last one we have is User. Now, I know we modeled User again in the previous demos we've done, but I want to make sure it's an exact match, so let's just say limit 1. And we'll just take this one, assume it's typical enough. Go in here. I'd use the simplified pure JSON view, so we'll take just that part there. Again, this was null, so this is an optional. But it's not just any, it's an optional string. Same there. And this is a beanie. The ID is done by itself, yes. It's called a user. Email is fine. Hash password is going to be an optional string. Created date again is a date/time. This was a null. And this is a location. Now, if maybe you weren't necessarily going to set a location, you could make this be an optional location, but it looks like every record had it, so we're going to leave it like this here. And there it is. We have our user with their embedded location. We have our package with its embedded release, and we have our release analytics because we need to answer the question of how many packages there are, how many releases there are total, and that's just not something that we can simply do. could do with the aggregation framework, but would it really be as fast as you want for something you might want to know all the time? Probably not. So, we're just going to create this separate collection to store that little bit of data. And there it is. Hopefully going through that process helped you a lot. I know it was a little bit repetitive perhaps, but going through it a couple times, showing you how to actually bring all of that data over. We just did three collections. if you have a lot of different collections, it's giving you a real clear roadmap and set of steps to make this happen in what I consider a pretty easy way. There might be a mistake or two I haven't caught, hopefully not, like something that was specified as a string when it really should be an optional, but we'll see about that. But I think we're pretty much there and we're ready to start doing some beanie with these models.
|
|
|
transcript
|
2:47 |
So our model matches the data really, really well. But we need to actually make a few more changes to model what's happening inside of MongoDB. For example, the collection name. We saw over here that the collection name was lowercase packages. What is it going to be right now? Upper case P, singular package. We have no indexes and no ability to specify those either. So recall that what we do is on the top level, the Beanie.DocumentDerived class, what we do is we're going to add an inner class here. So let's start with this one, a class called Settings. This used to be called Collection, and then that was deprecated and renamed to Settings. So if you see it as Collection in older demos or examples, that's the same thing, just rename it to the Settings 'cause the old one doesn't work anymore. So the first thing we want to set is the name equals Packages like this. We're also going to go in here, I'll go ahead and put a placeholder for it. We're going to do indexes. And those are going to go into here. Obviously, this is the most important thing that we're querying about. Like you might want to know, give me the release, you know, is there a release 1.0 for this particular package, right? Answering those types of questions, really important. Give me all the packages with this author email, or what are all the packages maintained by a singular maintainer? all of those things are going to need indexes as well as create a date for like show me the most recently updated and the latest releases and those kinds of things. So that's what this settings class and we're going to do a bunch of things with the indexes here but not yet. Let's go over here to the other two and do something similar. This one was called release analytics I believe. Double check. Release analytics. Yes. be users. I'm going to shrink that up for now. All right, I guess keep it consistent, shrink up the packages. Excellent. Okay, so now we should be able to talk to MongoDB and actually find the right collections, ones that are named the way I think they should be, lowercase plural, when we actually talk to our uppercase P type package here in the queries. Now I think we're pretty much ready to go in terms of that connection. The last thing we're going to need to do in order to use it is go into B and connect Beanie over to MongoDB and tell it that it uses these three classes to do that.
|
|
|
transcript
|
4:51 |
The next thing to do is to actually connect MongoDB as well as those models we created with Beanie. So we did that before in our semi-quickstart here, over in P2 quickstart. I'm going to do it again in this section, but let's make it a little bit different. We're going to create a folder here called infrastructure. We'll have a couple of things we put in there, and one of them is going to be, I'll just call this Mongo setup, like so. And it's gonna have a function that looks like this. We need to, as before, import Beanie as well as the motor. Actually, we need to import that. Like this. Now, this doesn't really allow us to connect to production databases that would need like a username, a password, server, and so on. But for now, let's just say we're only talking to localhost. We may need to upgrade this later when we get to deployment and things like that. Notice this thing is going to be just passing over the database, whatever we call it. We're going to call it pypi, which is excellent. We also need to pass over those models, the three top-level ones, not the embedded ones, not the releases, not the location, but the user, the release analytics, and the package. So let's go and do a little bit of work here. I could just import all three, but let's go and add a dunder in it and make this a little sub package thing. And here we can have all models. And this we can just have package. This is probably the first place where we're going to need to start thinking about how PyCharm sees this project. So right now, if you want me to work with this code, if I'm going to work with it, I need to type import code dot chapter three, chapter eight, etc. And so on. We don't want to do that. So we just want to say, basically treat that as its own project. Right? We want to say, you know, we're at this stage. And so in our mind, this is the entire application. And the way we do that in PyCharm is we go over here and say mark directory as sources root and that turns it blue, but more importantly that means PyCharm sees this as a whole thing. I might also need, if I'm going to make that... I need to add just an empty dendrite to make this a top-level module, to make this a lowercase one, and I say from models import 41 package, user and release analytics. And then down here we can say all the models are package.package, user.user, release analytics.releaseanalytics. You can do your imports however you want, but we need to get these three classes put together in a list somewhere. Then once we have that in our Mongo setup, we can now say Import models and then down here instead of doing them all separately, this will be models, all models. All right, this way if we have to use this in multiple locations or we want to categorize them separately and sort of manage that, it's just all focused on this model section. Not absolutely required, but I find it to be maybe adding a little bit of clarity here. Let me clean that up so it doesn't have squigglies. So we're going to call it with our database. We're going to specify PyPI when we call this. And it's going to pass off the motors database object directly. And then we're going to use the models that we put into this models sub module, the sub package here. Notice you can tell the difference by there's a little dot here versus one not here. I'll go ahead and put one over in this infrastructure just as well, just to make it more consistent from a package versus sub-module perspective. It looks like it's good, but how do we know? We gotta run it. We gotta use our API, we gotta use our classes. So the final thing that we're gonna do here in this chapter is we're gonna turn this into a little CLI style way to talk to our PyPI data. We don't yet have a web front end, We don't have a JSON HTTP API that we could call. We're going to get to that. But for now, I'm just going to write a CLI, just terminal type of application that lets us put all the query concepts in place and basically use what we've created in this chapter.
|
|
|
transcript
|
4:39 |
All right, let's create our CLI app now. I'll go over here and I'm just going to create a standard Python thing. I'll call it CLI. And let's go ahead and just run it to make sure that we're running not some old thing but this current one here. Looks like it's running the right one. Cool. So we're going to just have a main method and the first thing we're going to do is initialize the connection to MongoDB to make sure that works. And of course, you've got to do that before you can work with the database structures at all. So let's define a main method. Remember I added this shortcut to run this. Now this is your standard way of getting started in Python, right? But in order to work with Beanie, remember everything is async over there. So this has to be async, which means that if we still run it, we'll just get a warning. Coroutine main was not actually run. It was is not awaited, we have to say asyncio.run this. Now we get it working. So the first thing that I want to do, instead of saying hello, is I want to have a little header like, welcome to the PyPI CLI some version. I'm going to drop in some text here, just says PyPI CLI version 1.0, and we're going to call print header. Make sure that's working. Beautiful, look at how amazing our ASCII art is now. So that's great, we've got our print header. Then we want to use our Mongo setup to connect to PyPI. Let's do that. So say Mongo, you hit Control + Space twice, PyCharm will go look to autocomplete and import stuff for us. Beautiful, thank you PyCharm. And hit connection and the DB name will be PyPI. I double check over here. It is PyPI, super. Now there's a warning because we're not awaiting, right? Coroutine was not awaited. Await. All right, let's run that and make sure that this works. Well, it looks like we found our first problem here. Let's jump over to our package real quick. And it says right here, you can't use bson.objectid. Whoops, I grabbed the wrong one. We want beanie.pydantic.objectid. So it's like an object ID, but one that pydantic can work with. There we go, connected to PyPI. And as we noticed from that error, a little side benefit from screwing that up, is that you notice that it actually validated that everything was working together pretty well. There's still some possibilities of things going wrong, but some of the validation, some of the checks that we got things right are happening. The next thing that I want to do is have a summary of what data we have in our database. For example, if we go back to the PyPI homepage here, you can see we have how many projects, how many files, how many releases, how many users. So I want to have something like that at the beginning of our startup that says, ""How much data do you have in here? And I'm going to create a little method here that says, ""Show summary"" or just ""Summary, and it'll just print out the stats when we get going. So we're going to need to get the package count, release count, and user count, and it has to be async because we're talking to the database. So up here, we're going to go, let's put the database stuff together, summary. Now if we run it, it's not actually yet talking to the database, it just has PyPI stats there. Let's put a parent just to get a little separation on the reporting. There we go. So our goal is going to be to actually talk to the database and fill out that, like how do we get the release count or the user count, right? So we still need to write that bit of code. And then I want to have a loop, like a REPL almost, where it goes around and says, ""What do you want to do? Do you want to show the summary? Do you want to search for a package? And that kind of stuff. We can just put that up here. Here's a little starter for what we might do, just so we don't have to type it all out. So while true, we're going to let people say, Enter S to show the summary again, F to search for packages, P to list the most recently updated packages, U to create a user. What is that? That's R to create or release, or X to exit. And we're just going to go around and around until either they exit out and we'll just let them interact with it in this way. Alright? So our goal is going to be to write all these different functions to make that happen. happen.
|
|
|
transcript
|
1:39 |
In order to do our loop here, what we're going to do is we're going to use a Python 3.10 feature, the match statement, kind of like a switch statement. If you're using something lower than 3.10, 3.9 or below, just use if, else if, else if, else if. Or you can use my switchlang package that adds the switch statement to older Python. You can find that on PyPI, by the way. So what we're going to do is we're going to say match resp, like that. And then we're going to have different cases. The case where it's S, I'm just going to print summary real quick to show that this is working. We'll have a case for F. And let's say that we're calling a function here that doesn't yet exist. So here we have it. S is going to show the summary. And I'll just have this print nothing for a minute, just so we can get this, test this little section here. Let's run it again. Oh, look at this. We can enter a character for our command, let's say show. So here you can see it would do the summary. We could do You should do nothing if we do ABC. So sorry, we don't understand that command. Guess I could print out the command ABC, but then X, exit. Perfect, so we've got our REPL loop working. Now we just have to go write all these functions, which will be fun. We get to play with the database and finally do all our queries.
|
|
|
transcript
|
5:29 |
So I've upgraded our match statement, have real function calls, and I put just the empty functions for each one of those, 'cause how much fun is it to watch me write async def, the name of the function, over and over and over. So what we're gonna do now that we have these empty functions in place is we're gonna start filling them out to work with the database. And let's start with summary. That one's pretty straightforward. For summary, we need to get three pieces of information from the database, the package count, the user count. Those are both pretty straightforward and the release count, which is a little bit extra work, but just a bit. Now, I could go over here and I could start writing a wait package, dot, dot, dot, you know, do direct Beanie queries here. How reusable is that? How much, how testable is that? How good of an idea is that? It is not a good idea. So instead, I'm gonna introduce this category of functions or modules called services, not services like FastAPI, but just they provide services to other parts of the app. They're not quite database level things, just slightly higher than that, okay? So I'm gonna create a sub package, just a folder with a dunder net file called services. And in here, we're going to add, let's start with package service. And in the package service, we're going to want to have a function, an async function, like almost all of them will be 'cause they're talking to the database. This will just be package count or count packages. Take your pick. Or since it's in the package service, do we just call it count? I'll go with that. We're gonna need multiple types of count. I'm going with package count. All right, and this is gonna return an integer so we can use our type information here. Now, in order to do a query, we're gonna need access to our model package. So we're gonna import that from models.package, package like that at the top, perfect. And then for count, it turns out that is super easy. We can just say return this.count. Notice the CLS, that means it's a type and it applies to the whole type, not an instance, like save, for example, would be an object or instance level one. Now the problem here is we're talking to the database. It has to be asynchronous. So we await that async call. And there we go. Let's do something similar with a user service. So I can copy and paste that. Let's say user service. And this is gonna be .user, import user. And this will be a user count. And guess what? That's user. Done. Done, done. Excellent. Okay. There we go. Now what we want to do is just call this. So we'll say package service like that, let PyCharm import it at the top. And we just say package count. Now again, this is async, right? Returns a coroutine, means you have to await it. And then the user count, we're going to await user service, dot user count. I'll just run it again, see that it works. Yes, look at that. We got our summary stats working. So 4,892 packages and we have 4,295 users. Excellent, what about releases? Remember, the releases looks a little bit different because the releases are embedded in here. We kept count of that kind of information in a separate place so that we don't have to have a real slow query here, right? And we put that into this release analytics section And on there is a total releases count. So let's go back to the package service. It seems like it's kind of should be in charge of packages and releases. So we'll say release count. But what we do here is different. We need to get that one record from the database. So we'll say, let's call it analytics or whatever. So release analytics. We're just gonna do instead of a count, we're going to do a find one and get the one that's back if it doesn't exist. So if not analytics or if analytics is none, we could print error, no analytics, right? Something like this. Now, of course, this is also asynchronous, right? If you look at this, this is a co routine again, so we will have to await it. But if it does exist, instead of package.count, we go to analytics, and it has total releases like that. Although we don't await that. Great. Okay, so let's try it one more time. See if we have our summary working. The most important One thing we're missing is calling that function. AwaitPackageService.releasesCount. There we have it. The same number we just saw over in Studio 3T, we have 231,000 releases across 4,892 packages. Awesome. Our summary stats are done.
|
|
|
transcript
|
5:04 |
What one do we want to do next? Well, how about recently updated packages? So we should be able to write a function here package service dot recently updated and then we're going to need to Store this somewhere. So call this packages and this is gonna have to be an async function. So we're gonna wait it Well now we can tell PyCharm to go write that for us Thank you. You almost got it right, PyCharm. You almost got it right. But you didn't know that that was there. Now let's suppose that this is going to take a parameter that tells us how many they want. But we can default it to five if they don't specify it. So down here, what are we going to do? Just like before, we're going to go to the type. So we'll say packages or say I'll call it updated. I'm going to go to package, and now we don't want to do a filter. What we want to do is get all of them, but show just the top. So in order to figure that out, we need to sort by something. Luckily, if we jump over to package, it has a last updated time. So we can just do a query directly against that. So we can do find all. That's the entire list, but we want them sorted, so we say sort. There's two ways we can sort here. I could say negative last updated to sort by last updated, to sending to put the newest first and the oldest last, or I can use the type. I kind of prefer the type, so package last updated. Now, notice there's a error here. This is a mismatch in the type checker versus the way Beanie defined it or something like that. It's not an actual error, it's not an important thing. So I'm gonna tell it not to worry about that. And then we only want so many. We don't want all 5,000 packages. That would be silly. We just want how many they're asking for. So let's say we're gonna do a limit of this count. Now, so far this is just a query. We could asynchronously loop over it or we could serialize it. We could execute it into something like account, we could do something like convert it into a list. All those are async operations. So finally, we want to do a to list. In order for that we have to await. And what we get back here is a list of packages. So we should be able to return updated like this. And I think that will do it. I think that'll that'll work. So let's go back to our CLI here. We got our packages, let's just real quickly print out packages, see what we got back. And in our CLI here, we're going to create most recently updated packages, we'll just do p. Who are created date has something going on with the releases here. Let's see. Package. Package. Oh yeah, it expected a string. Remember that was one of the parsing over from our JSON to Pydantic. Let's try again. P for packages. And one more thing with the object ID. Oh, it looks like we forgot to change the type of underscore ID here. So recall we had underscore ID. Typically is that bson.object ID. But in our case, we said we want the ID to be a string. So unless we explicitly state it, Beanie is going to try to make that object ID. And when it saw the object ID, or sorry, when it saw the string in the database, instead of an object ID, it couldn't work. So let's do one more time. Here we go. We've got all of our packages, you can see all sorts of stuff about them. It just apparently prints a ton of them out because it's a Pydantic model, which we don't necessarily want to see all that information. But you can bet that if we just print out the length of them that we would have five. So let's go ahead and do something a little more nuanced with showing the packages. So what we're going to do is going to loop over them and we'll get the index back starting at one print out its name and when it was last updated in a little bit of its summary. Let's try that instead. See how this looks. Here we go. Look Look at that, the most recently updated ones was SKTime, PYCT, Shapely, and some of these others. And look, you even get a cool little bit of summary about them. Excellent, right? Now these dates here, this is when I exported the stuff from the API, preparing this class quite a while ago. So it's not really like today, but that's okay. It gives you the idea, right? These are the, this is the basically the most recent ones out of that list. All right, I think that one is working. Right, that one is working great right there.
|
|
|
transcript
|
10:13 |
Next up is searching for a package. We want to search for them in two ways. We want to be able to find them by giving a name of a package, like show me stuff about FastAPI, as well as let's do a more unexpected type of query or search where we say, I want all the packages that have a 7.0 release in one of their releases, just to explore digging into that nested embedded array, that array of embedded objects that are the releases. So I'm going to put a little skeleton bit in here just so that we don't have to type out all the boilerplate. So here's what we're going to do. As I said, two things, give us the name of the package you want. So we can go get a package by name. I'm going to loop over those. If we have information about it, what is its ID, when was it updated? How many releases does it have? Otherwise we'll say, there's nothing like that in our database. And then I'll let you enter the string, something like 123 or 1.7.4 or whatever, and then we're going to figure out the major, minor, and build parts because recall, in package, that's how we're storing those, right? In the embedded releases, they each have a major, minor version and build, so we're going to need to have those pieces separately so we can query it, and then we'll just have a function, you know, give us the package with all of these versions, and we'll just print that out, right? I'm not sure how practical that is in terms of what you would really do with it, but it is relevant for letting us dig into these nested objects. Well, let's start at the top. We're going to have this function here, package by name, specify the name. And again, PyCharm takes a guess, but it's not very async friendly. It's going to be a string and it's going to return either a package or nothing depending if it exists. An optional package. Again, I know it could be package pipe or if you prefer that style, not my thing, but certainly would be valid and mean the same thing. So then what do we want to do? We need to do a query. We'll say package equals, we go to our package, we say find one in this case, and we just specify via the type package dot what we're using for our package, if we go back to the class, all is the name is really the true ID of the object so it's just going to be .id. Then we want a quality, an exact match is name, and that's going to return our one object or none, and then we just return the package. Sure you can inline the return, but I kind of like to have this in two lines sometimes so I can set a breakpoint here if I really need to go have a look at it. So let's go and run this and see how this is working. So I want to search F, not there, down here. F for find. Let's have FastAPI. Look at that. Found it. FastAPI, last updated when I imported this with that many releases. And it doesn't matter what we put for this. I guess it may crash. 1.2.3. Here we go. Zero with this because we're not running that query yet. Let's do another one. Let's do find, findantic, 1.2.3 just to make it happy. Excellent, we found it with 95 releases. Let's do a final one where it doesn't exist. Switchlang, that one I was telling you about that I wrote for adding switch to older Python, not going to be in the top 5,000 for sure. So it won't be in the database, therefore, no package with ID switchlang found. Perfect. looks like that first part is working. So the next one is going to be right, this one packages with version. Again, I'll let PyCharm add it over here, but we gotta upgrade it. So we're gonna get a list of packages and we're gonna do our search on those three things there. Now, there's something that is not, well, it's probably not obvious to most of you and it's really easy for this to catch you out when you're talking about a list of embedded objects. If we had, like consider the user, they have a location. There's, it's super easy to just say, I wanna go find where the location is, Portland, United States, that would be easy. When there's a collection of embedded objects, the way you write the query is the same, but the meaning is not quite the same. So we'll do it like this. I'll write it in the wrong way first, and then we'll do the correction using a document database style concept. So we go to the package and we could say find and then our test that we want to put in here would be package.releases major ver = major And then we'll just, let's just print out the ones that have this real quick, like this. All right, let's do our find again. This time we'll just do the letter A because we don't care, but 1.0.0. Oh, whoops, it looks like I made an error in our function definition here. What we're expecting back is just the number, not the packages themselves. So I'll just put this as an int. And we'll return, instead of toList, we can just do a count. Rename that package count. Try one more time. Letter A doesn't exist, 1.0.0. There are, well, a lot of them with 1.0. So never mind that there's this, what looks like an error. Again, it's just kind of the typing trying to be too strong. So what you would expect here is that the way you run this test is this going to be minor, this will be minor-ver, and this will be build, and this will be build. So this seems completely reasonable in expectation. I want to go find all the packages that have the major version set to major, the minor set to minor, and the build version set to build. That's not what we're actually doing. And let me add an S here so it doesn't conflict with the function name. So what we're really asking MongoDB to say is I want to find a package that has a release with the major version. It also has one of its packages, not necessarily the same package with a minor version. So let's suppose there's one that has a release 111, and it has also a release 222. If we asked for this to be 1 and that to be 2, MongoDB will look and say, ""Well, in this package, is there a release where the major is 1? Yes. Is there a release where the minor is 2? Yes. But there's no release where there's a 1.2. That's not what we're asking here. Okay, so this seems like what we want. It's not what we want. What we want is something similar to this, but what we need to do in terms of MongoDB is something called an element query. An element query asks the question in the way you probably have been conceptualizing it the whole time we've been working on this function. I want something where a single element, a single embedded element of the list has all of these properties and applied to the embedded thing, not the overall document perspective. So if we look over here on the MongoDB documentation, what we, it's not great that this is not wrapping, is it? What we do is we say the field is actually equal to this operator where thing one, thing two, and so on, all the properties are set into a query. So down here, we're going to use this operator that allows you to, from the ODM, to do finds on the array called element match. Okay? going to have it import that directly from beanie.odm.operators.find.array import element match. So no, this is not going to work. And then down here, the way we use it, instead of saying I want all of these, or I want kind of an or applied to all the sub elements, I want to have the exact element where one of the items in that array matches. So the way we do that in Beanie is we say element match, and we pass in the array here. So package dot releases, and apply to that, we have the major version, minor version and build version all have to match all three of those things, right? So we're trying to match an element of that list with this query. Oh, a little bit non obvious. It's not very often you have to use element match, but it's so easy to think, ""Oh, this is doing the query I want,"" when it's not, if that is an embedded list versus an embedded single object. I wanted to make sure we cover that in here. Now let's see what we get this time around. Find letter A to skip. Okay, 1.0.0. I think last time we had 2,000. About half of the packages matched that query. And now a little bit fewer. Let's go and see if we find the one that has 1.7.0. There we go. Much much better. Let's see if we got any here that have a 7.0.0 release. 163. So this is doing that query using element match to find the particular packages. So don't let this really cool ability to say multiple constraints mean and fool you when you're talking about an embedded collection of objects.
|
|
|
transcript
|
7:01 |
The next thing I want to tackle here is creating a release. How's that going to go? Well, we need to gather some information from the user, like what package are you creating the release for? What version is it? Major, minor, and build? What's the comment on the release? What are the changes in this particular release? The change log sort of thing. So we're going to do that here, and I've got kind of that structure I just laid out, put together, and then we'll write the MongoDB code to do it. So here we're going to say we're creating a release, give me the name, go find the package. Remember we already wrote that, that's cool. And if it doesn't exist, sorry you can't update it. Then we'll ask you for the version, come up with that by creating a tuple and then exploding that out, projecting that into those three variables. Get our comment, get the size and bytes, the URL where it goes, or you can leave that empty for the release notes if you want. And then we're going to need to take all that information and create one. Basically create the release. So let's go and add that to the package service. Again, PyCharm takes a guess, but first thing it misses is it doesn't know async apparently. And then this is going to be an int. Okay, some of this code we need to run again because even though our use case of it up here, we did check that there was a package and it would be an error if not, we still shouldn't assume that every caller is doing that correctly. So what we'll do is we'll say package equals await package by name, name. Could do a better job of handling exceptions and create our own exception type and all that, but the point is not this, right? Now that we have our package, maybe we should check it doesn't actually have a release with whatever these three versions are, but we're going to assume that's fine. And we're just going to go ahead and create a released object. Remember our package has our releases list, which is a list of release. And so we're going to create one of these and then append it to there. So we'll say this is going to be a release. Import that. And it's going to take a major version. And by the way, this autocomplete comes because I have the Pydantic plugin for PyCharm. So major version equals major. Look how much easier it is to write with that thing. Minor version equals minor. Build version equals build. Over here in our daytime, one thing that we didn't do is we didn't give it a default, right? But I think that's probably a good idea. Let's go ahead and do that again like we did earlier. dot field default factory is going to be date time, not date time dot now remember, not the function. No, the function, not the result of calling the function. And let's go ahead and add this just over here as well. Anything else need one of those? No. Okay. Do we do it for our user as well? Let's go ahead and they've got a created date in the last updated date. I release analytics, it has no time. Okay. So we don't need to specify the created date because it has this default, but we do have a comment, which is going to be the comment and URL and be the URL. And the size is going to be the size. The other thing I want to check real quick is that the type of the URL is the same as our expectation here. It's not. We said that it could be none, but if it passes in as none, it's going to crash here. So let's go ahead and amend our release to say that this type could also be optional. Here we go. So we have our release created, and we want to put it into the packages. There's an interesting thing we can do here. So let's do it the most natural way and I'll show you an improvement we can get as well. So we just append the release. So we want to go to the collection of releases and just put this on the end and then we want to save this. Again database calls so we await package.save. Excellent. What do we return out of here? Probably nothing. I don't need to do anything. It's either going to work or there'll be an exception. So this should be fine. Let's go ahead and do this here. Run our CLI again. So we'll create a release and it says, let's go and add this to Pydantic. Do we have Beanie? Let's see. Oh yes. So we're going to do a 2.0.0. Big time release, major changes, 2.0. This is the big rewrite. If you've never heard the song, the big rewrite, search it on YouTube, it's funny. Okay, size and bytes is 12743. Release notes, we're just gonna leave that empty. Look at that, release added for Beanie 2.0. Let's go and actually see, we can go find which one of these is the one, the packages, there we go. Don't need our limit anymore, we'll just say underscore ID is beanie. And if we go way to the bottom, there it is. This is the big rewrite. Super cool, right? Now, the other thing we've got to do, we have to be very careful here about is we're storing the number of releases as a separate counter in our database. And there's a big danger for that in that this becomes out of sync. So we need to make sure everywhere that we add a release or remove a release as well that we somehow increment or decrement that counter. So let's do that real quick as well. So here, let's do one more time to make sure this is working. And then we have a way to improve this function. Alright. So let's create a release. Notice how many releases we have. Instant 804, create a release. And we're gonna call this 2.0.1. And let's show the stats again. And look, it went from 804 to 805. Excellent, so that's now consistent and working. Great, our create release function is working as we expected. We'll see though, there's a way we can actually improve this if we want.
|
|
|
transcript
|
11:03 |
So we created our create release thing and we actually forgot one thing really quick here that we should probably add is last updated equals a daytime.dateTime.now. Import that. Okay. Now, we've got this version and it's pretty good. However, it suffers from a few problems that all ORMs or ODMs would. Here's the deal. We're gonna check if there's a package, that's fine. But then we've pulled it back here. Imagine there's a lot of concurrency around writes to this document. There's not because we just don't release the PyPI like a very, very rapid rate. But let's suppose it was something like that. Maybe we're adjusting like the last view time on a page in a CMS and it's just getting pounded, right? There might be concurrency issues there. So if we go and we pull the package back, We do some work, do some more work, and then save. If somewhere during this period, some other request or some other thing concurrently changes package behind the scenes, like they add a release at exactly the same time as this is in flight, well, we're going to overwrite the entire document with all the changes. That's not ideal. That means one of those pieces of data would be lost. We could use transactions, but it's not necessary. It's just not necessary. We just need a different way of thinking about this. The other thing is, how efficient is it to pull the entire document back with all of its releases, its potentially a megabyte worth of text in terms of its readme and all those things, put this one little thing on there and then push it back down into the database and rewriting all of that data, replacing that big, potentially big document. Not ideal, right? So what we can do is we can use a different type of query syntax to say, take this release, send it alone to the database, and just stick it on the end from a MongoDB internals perspective, don't do all this back and forth. That is done atomically. So would be working much better in terms of concurrency, both from a speed and performance, but also from a contention and possible data loss. So we're going to use a couple of other types, I'm going to put them up here. We're going to use array and we're going to use set and we're going to use increment. So let's go down here and I'll have, I think I'll make a copy of this and at the top we'll call this, we'll call it fine but full ODM style less efficient. And let's copy, paste, uncomment, format. There we go. Let's do this differently. Up at the top, we're going to create the release, period. This thing where we're checking, this is an extra database call we're doing. We don't actually need to do that. So instead, what we're going to do is we're going to just try to update the database and it will tell us how many things were updated. If none were updated, that means that that was the wrong package. And so we can throw this exception again. You know, I'll put this, calm this out for a second. So now what we can do is we can go to our package and we can say find one because we want to update a single package. And it'll be package.name equals the name of the package. And then on this, I'm going to await this of course, we're going to do an update. We want to make two changes, just like we did right here. We want to put this release onto package.releases, and we want to set the update, the last updated date to datetime.now. Lost its import there. So let's do the release first. So we're going to say array.push, and onto the collection package.releases, we want to push the release object. So that's thing one. Oh, whoops, this needs to be like so as a dictionary. Okay, so I'm going to push that to this collection, we're going to push this object in the database. And we want to do a set. Again, we give it a dictionary, say package.lastUpdated, that's this part, to this value here. And now that all happens immediately in the database, we don't have to get a thing back or save it, but we do want to know about the result. I'll call this updateResult. So here we want to make sure that we actually made a change. And remember this test that we did, we go to the database, get the package if it's not there, we can test that here as well. So instead of doing this, we can use this update result. Now, this update result is actually a PyMongo object, say, ""A PyMongo result."" Let's do it like this. We'll type it out. Import that. I guess we've got to import the whole thing back to the top. Update result. Now, I'm not so sure how much I appreciate having this huge wrapped thing like that, but we'll do it like this. There we go. And now if we type that, you can see it has a couple of options or features, a matched result, modified count. And so what we want to do is, I think we'll just go with the modified count. If it's not equal to one, I'm going to raise the section, maybe it's less than one. I'm going to raise an exception. No package with this name, right? We tried to update stuff, nothing was updated. Here's the error. So that saves us one kind of useless database call over there. We don't have to check and see if it exists. We're just going to go there and try to update it. Most of the time, we expect it to succeed. If it doesn't, whatever, we're just going to raise our exception afterwards as if we would have before. Again, we're not pushing all pulling and pushing all of that data back and forth so we can delete that part there. Same thing here, we're pulling that release analytics back, we're making a change, saving it back. This has much less of a performance issue because it's such a small document. However, it does still have that concurrency issue, theoretically, and there is more contention for this than there is for a single package. So we can do the same type of thing. So we will await release analytics.find1, then we'll do our update. Now the operation that we're going to apply, if we're going to apply the increment, which did I format that out again? I did. Apply increment, and we're going to put in a document here. And this is really cool, because it's like go to the database and do a plus equals one on that field. And if two things are trying to do that concurrently, MongoDB will make sure that they both apply both of those increments in the database. So what are we going to increment? Release analytics dot total releases. And how much do you want to increment or decrement it by? Like if you're decrement it minus one, we're going to increment it by single one. And all of these go away as well. So let's look back at it here. So just like before, we created our release, but instead of pulling back the thing, checking it exists, changing it in memory and saving it, we're going to send two changes in one command to put the release object on the list at the end, and we're going to update the last updated time on the package. If that didn't succeed, we're going to raise an exception. If it did, we're going to do a thread-safe, concurrency-safe, high performance increment of release analytics total releases by one. That's a lot of talking, a lot of thinking about it. Let's try it and make sure we got it right. What one do we have open? We got Beanie, so we'll add a 201 to Beanie. So let's create a release, R. Beanie is the name. 2.0.1, this is awesome. How many bytes? That's exactly 201 bytes. You know it is. Release URL, don't care. Ah, package name, oh no. Of course, it's not name. ID. Try again. So package ID is the name. Release. Gonna get it this time. Beanie. 2.0.1. This is atomic. 2.0.1. No URL. We added 2.0.1. Let's go to our database and see what happened. There's a couple of things we should observe. Here we should see that we get 201 pushed on the end and way up at the top. We should see that last updated is going to change as well. And over here, remember we had already updated that to 804, so it should be, well, it's 812. Let's go back and look and see what the outfit was. So we got our 811. We did this thing, and now if we ask for the summary, You should see that number, 812, perfect. So that tells you this one worked. Let's go look here and see what we got for Beanie. Oh, look at that. It is now June, so yes, indeed, that worked. Way at the bottom. This is Atomic 201. Exactly the same behavior as we had before, but instead of, look how massive this document is. This thing is huge, okay? Thousand lines, a lot of those lines are not wrapped for the whole read me and so on. Pulling that back and forth just to make that minor change instead of just going push that document into Mongo and tell it to append it here. So much better, plus the concurrency is way better in terms of contention and potential data loss from the way ORMs and ODMs work. Excellent, excellent stuff.
|
|
|
transcript
|
5:26 |
Okay, here we go. The last bit of our CLI app that we need is the create a user version Create user option. So we got our create release working great. Now we want to create user again Let me just give you the UI interaction bits something to work with here So when I create a user ask, what is the user's name and email? and we remember that Whenever you have accounts you can't really have duplicate emails because if a user is going to come along and say I need to reset My password enter your email. Well if you have multiple users with one email Who do you send the reset to right? So you really kind of need to treat the email as unique and so we're going to make sure that you can't create an account with an email where the email already exists and Then we're just going to gather some information. We're going to create a local Location and pass it on to this create user Let's have that one created and this one created, then we'll fix them. Again, these all have to be async. Let's do this find a user by email first because we're going to need to check that the user doesn't exist, aren't we? First, we're going to do this real super, super easy. We can just await user.find1, user.email, equal equal email. Now one thing I like to do all the time when I'm talking about emails is canonicalize them, make them consistently the same no matter how the user enters them. If there's an uppercase, you maybe don't want to store the uppercase, right? It doesn't really matter, but if you don't want it to vary by case, and remember MongoDB, this is a case-sensitive compare. So we can just say email equals email.lower. And if they happen to put a space in there as well, we can strip those off. And while we're at it, let's go ahead and do that up here in the create user. And we'll do that for the name, but you don't want a lowercase name, you just don't want spaces. So there's that. Too, passwords take spaces, I'm going to say passwords can't have spaces either. So there's a little bit of cleanup before we get working with this data. Now again, in this place, we want to check and make sure there's a user. I think here, because of all the stuff we're going to need to do with the user, it probably makes sense to just say if user by email, email, is exception, something like that user already exists with this email. So we're going to create a user, just like we had before. And what does it take? It takes a name and email hash password, I'm going to set that in a second. Remember, we're getting past the raw password, we don't want to ever ever store that, but we use it to generate this hash over here. So we'll say the name equals name, email equals email, hash password equals hash password. Created date and login have defaults, so that's good. This, I'm gonna set the profile image is this, and the location is our embedded location object. And then from here on out, it's pretty easy. We await user.save, which will do the insert, and then we can return this user, which will have its auto generated ID, its underscore ID property set by MongoDB. So if we need to take the ID that was created and run with it, we'll have it now. Okay, so let's go ahead and try to create a user without their password, and then we can come back and talk about passwords separately. So try again. Let's go ahead and try to create a user. Let me find an email. Let's go to the users here. Let's try to just create one with this email here just to test the error handling. It'll be you as the full name, there's their email, error, a user with this email already exists. Okay, great. That seems to work. Oh, it looks like I forgot this canonicalization bit, the just name strip, not email. Don't want to screw that up. Let's try again. Create a user. Let's do it like this. at talkpython.fm space letter A still security conscious Oregon United States. Awesome. We created Michael Kennedy with lowercase email, no space, and the ID generated by MongoDB. So we could take that ID, go back over here and say I want to find the users. I'm going to say underscore ID is an object ID, lowercase D. There you go, here's the one we just inserted. You can see all the canonicalization and the ID is set. Beautiful, beautiful, beautiful. Okay, so creating a user works. Sorry about that mistake here. This is something that is so easy to make the mistake of. Right, when I had this inline here like this, it's really easy to write code that looks right. You look at it, it looks fine, but because it's a coroutine, it's never ever gonna be anything other than a potentially executable coroutine till you await it to get the result out of it. So just be super, super careful.
|
|
|
transcript
|
6:44 |
So super close to being done with our CLI app, and this is going to actually be something we can reuse throughout all of our applications that we build, like for example the FastAPI part. All the questions and answers we're trying to get here are things that we'll be able to use over there as well. So the last thing to do in our create user here is, you know, not give them none for a password hash, and also don't store their password directly. So what do we do? Well, I could say MD5 of their password. That would be terrible. You want to store the hash of their password in a way that has what's called salt. That is a unique bit of text plus the actual password. So if somebody has a set of pre-computed hashes like this word hashes to that and this word hashes to that, mixing in this salt means there's no way to compare them in that sort direct lookup style, okay? And you want to make sure that they're computationally hard to guess. So instead of hashing at once, you want to take a hash, and then take that result and hash it again and fold it over and over many, many times. So that is hard to guess with. Ideally, if you could, you would also like to make it hard to use GPUs to crack these as well. So what we're going to use is we're going to use this library called passlib. passlib is fantastic. And we're going to use the Argon cryptographic hash out of it. So let's give an adder's requirement. So be pass lib. Now remember, you don't have to follow these steps to generate an updated TXT because you'll have it but I'm just showing you the steps in case you want to kind of use this pip-tools style. So what we're going to do here is we're going to say pip-tools. pip compile, sorry, pip compile. Take this requirements as an input and say upgrade whatever is there. We go and look at the changes for the requirements.txt. What do we get? Let's see, we added passlib directly. Anything else? No, nothing else was upgraded. Potentially with that upgrade, you know, there was a release of Beanie that would have also been incremented over there, but it wasn't. So this is going to be and pass lib while we're sitting here. Now we need to install it. Of course you could just click this, but if you're not using PyCharm, you just pip install -r requirements. There it goes, excellent. So give it a moment and PyCharm will become happy again. So up at the top, let's put, oops, let's put our crypto handler up there and I'll put it at the very, very top. And also put this article here about why Argon 2 versus other things, you can look at it, it just says, how expensive is it to crack a password drive with Argon 2? Very, this is good, this is really good. So it won the password hashing competition and so on, really good stuff, all right. So what we're gonna do is down here, instead of doing this, we're gonna take their password and we're gonna use passlib, And up here, notice I imported argon2 as crypto. So we're just gonna say crypto. What do we wanna do? We want to encrypt their password. And that's it. And later, if we want to verify it, we would say if crypto verify, the secret is the real password and the encryption would be the hashed password that we get back out of the database. So like user.hashpassword. That would be the test we did do to see if they entered the right one later, but we're not testing it now, we're just saving it, right? Let's go create one more user. Oh, one other thing. Up here at the top, that's where we're doing our argon, and I'll put this. We're going to go and say, I talked about that folding, take the output, do it again, take the output, do it again. For this particular algorithm, doing it 25 times is around 200 milliseconds of work. That seems like a good amount. Yeah, that's right over there. So that's a good amount of work. It's not so long that it takes forever to log in or kill your server, but it's not so short that people can just hit it with a bunch of parallelism and get the answer, you know, crack it right away. All right, let's go ahead and create a user. One more user. We're gonna create Sarah. Now Sarah's password, she's way more password sensitive and conscious than I am. She's going to use three letter A's, not just the one like I do. She's serious about security. She lives in Tennessee in the US. Oh, looks like I forgot to run one more install. Let's do that real quick. [no audio] Try again. It doesn't come with all the back-end computation for the different algorithms. You've got to add those separately. Again, highly security conscious. NSE, US. Did you notice that little bit of a lag there? That was that 200 milliseconds of We're thinking really hard, So if anyone else tries to replicate this, they also have to think really hard. And let's just go find her by email in the database. There it is. And remember, she used the letter A three times. Look at her password here. So argon2 stores what algorithm was applied, what version of that algorithm, some other startup data, how many foldings go through, and then it has the salt and then this huge cryptographic thing over here. All of that from the letter A and it's incredibly hard to guess. Okay, so super, super cool. And now we're storing our passwords safely. I know it's not really part of the course that we're creating users safely. So we're not going to go too much. We're not going to talk about this anymore, basically. But I did want to show you like, look, if you're putting users into MongoDB, You really need to do one-way hashes on things like their password or other stuff you want to verify, but not even we can decrypt this. We can just say, given the password again, the three letter A's, does it match, right? That crypto.verify. That's all we can do. So really, really excellent. Highly recommend PassLib as one of your options for this kind of stuff.
|
|
|
|
52:43 |
|
|
transcript
|
1:23 |
With that fairly involved application we just wrote, where we have Beanie and we're answering certain questions, we built that TUI, that text user interface application that allows us to ask questions like, how many packages do we have? Let's create a user, let's add a release to a package, find me the most recently used ones. We created that in a really well-structured way. We had our models, we had our services that aggregated the database calls and isolated all the queries that we wrote. Well, all that nice code that we put in place, we can reuse that for any kind of application. And in this chapter, we're gonna build a fast and pretty simple, but still realistic FastAPI app. And this will allow us to take that same code, but to surface it as a true HTTP, JSON, RESTful API with even cool things like documentation based on our database classes in FastAPI. So we're gonna go through and do that right now. If you know FastAPI, that's great. You'll probably learn a few things, and in a minimum, it'll be cool to plug Beanie into it. And if you're new to FastAPI, don't worry, we'll talk about all the things you need to know during this chapter. It's a pretty straightforward framework that's a lot of fun to use. So I'm excited to get into it with you.
|
|
|
transcript
|
6:09 |
We're going to build a pretty simple but feature-rich FastAPI site here. And what I mean by that is we're not going to skimp on having things like actually returning a little HTML to help users of the API know what's going on, or properly factoring our API so it's not just one ginormous single Python file, as well as generating API documentation with OpenAPI. Now to get started, what we're going to do is take a copy of the old code. For the most part, all the things we did previously, we would just kind of start over. But like I said at the opening, we're now building on our previous work, we're now bringing like everything we did in that CLI app, we're bringing it over here and just using it in the web instead of in a Tui. So we're going to take this code, everything but the CLI itself, and we're going to just copy that over. Now remember, when you have multiple files like this, and you've got basically multiple projects or sub projects loaded in PyCharm, you need to come here right click, mark directory as unmarked as sources root. See there's a hotkey. It's typically how I do it. Close that off over here and mark directory as sources root. So when this service over here, says things like from models dot package, it knows, look at the source route, go to that models that module, that package, okay. So we're using the latest one, don't forget to do that, or it might still run, but just use the old models, which would be very confusing. Alright, so we can close this off. we didn't have, we didn't copy over the CLI because typically in FastAPI, this is called main and let me just set it to run real quick. So when I hit the Ctrl R hotkey, it runs the correct thing you can see up here at the top, set to go. Okay, so how do we work with fast API? Well, let's try this. Errors, because we haven't installed it yet. So one more round of setting up the requirements. I'll put this up here, maybe we could alphabetize this a bit. Here we go. Again, remember you don't really have to mess with this file unless you just want to use this style because we're going to generate the requirements.txt file, then pip install-r requirements. Here you can see now we have FastAPI and Starlet, the latest releases. So curious what has changed, we can come over here, see the diff. So we got HTTP core starlet because of any IO FastAPI directly. Identic is also now requiring FastAPI or FastAPI is now requiring pedantic and so on. Right. So that's how that's changed. But this is all good. In the examples, you'll see app equals FastAPI, not FastAPI. this, you can see there's a couple, just a couple of arguments that go in here, you can really, really configure FastAPI. When I build an API, I kind of like to call it API instead of AMP. But you know, you you do you whichever you prefer. So what we need in order to do this, let's just get the Hello World FastAPI in there real quick. So we're going to create a function, it could be async, or not FastAPI will go either way. We'll call this hello world, whatever the name is, it doesn't matter. And we'll return a dictionary of messages, greetings to the world. Right. And in order to make this an API, if you haven't done this before, you have to say this has a get or a post, whatever, and you give it the URL, we could just say slash or slash API. For bonus points, you could spell greetings, right? Now if we run this, it's not going to do anything because it's defined the API, but we haven't started the server. So we need the section down here where we have, I guess we can have our main, sure why not, define the main function up here. We need to say server run. And that brings us back to one more round through here we have uvicorn is a really good asynchronous capable server that we're going to use. Might use something like g unicorn with uvicorn workers in production if we were putting this out there. But just run through these real quick. Now you can see uvicorn is running so we can say uvicorn, import that dot run. And we give it the API. Clean it up, get rid of the squigglies for the PEP 8 violations. Now let's run it. Hey, look, our server is running. Let's click on it. Message, greetings, hello to the world. And let's put this in something like Firefox and see if it'll treat it like JSON. In fact, it sure does. We have pretty printed JSON. Whenever you're working with direct JSON responses, I find that Firefox is better than any of the Chromium-based browsers like Vivaldi or Chrome itself. You can see we're missing a favicon. It's fine. We don't need a favicon. We're getting /ok, working, /working, okay, you know, 200. So that is a standard FastAPI app. And what we're going to do is we're going to define three or four APIs that have to do with our PyPI data, like API/stats, API/packages/recent, and so on. So we're going to take this model and expand it out to talk to our database. But if you're brand new to FastAPI, here's what you need to do. If you're not, awesome, I'm sure you already love FastAPI. It's quite a popular framework. And here's the skeleton we're going to use to build out that API.
|
|
|
transcript
|
8:11 |
Now there are three APIs I want to get started with. /api/stats, the recent packages where you can pass over a count, or get details about a particular package, like show me the details about /detail/beanie, and we'll get those back. So let's start by structuring our FastAPI application, like a real professional application. It's easy and it's worth taking the time. So many web demos are like, we don't want to trouble you to think about how you might structure your apps are going to put everything and recommend everything just goes into this one main here. Don't do it, folks. So what I'm going to do is I'm going to have a potentially a set of modules that handle the different API roles. And in order to coordinate them, we're going to create a directory or I guess, since we already in a package story, we could just create a package sub package here, we'll call this API. And let's go and add a Python file for package API, we could have maybe one for stats, we could have one for users, right, this is a real simple application. So we're kind of pushing the pushing here, but still probably worth doing. So what we do is we come over here. and let's just say that these two are coming over. So it doesn't make sense to say API equals fastAPI, which we do need, not fastAPI. There can only be one of those. So we're going to need to come up with something that we can use as a decorator on these functions. But let's go ahead and write the functions first. So how about we just call them, since it's in the package API already, already, just call it recent and details. Now doing nothing, returning none, it's not ideal, but that's a start. Remember that we want to use Beanie and so this is going to have to be an async function. So async. Luckily, FastAPI knows about these and it is really good at running them on fast workers just the way you would expect. Things like uvicorn using uvloop, a high-performance async I/O loop based web server. So we can just make these async and they'll run asynchronously. But how do we do this? We can't use that one. If we try to pass that over here, we're going to have to import them back here. We create the circular relationship. It's not loved. So what we're going to do is we're going to create something called a router from fastapi.api router. And that's kind of a deferred definition of all of the routes. So over here, we can say this one, to the same @API_ROUTER_APP, we say @router.get. These are just gonna be get API endpoints. If you build RESTful services, you typically have modifying operations, taking a post or a put, or possibly a delete, and then read-only operations being get, but really we're not modifying, we're not like uploading new packages or something. So what do we wanna put here? We want to put, let's say, this is recent, so we'll put that. And we want to put this count in here as an int. Okay, and let's just say something real quick, like return count. Count, we'll just echo it back, just to make sure that everything is happening correctly in FastAPI. Again, down here, we'll say @router. I get and this one is going to be the details of a package. Similarly like that. This will be name, which is a string. All right, so those are the two API endpoints we want to put here. Maybe we'll make a stats API for the third one. Let's just make sure this is working though. In order to, for FastAPI to find these routes, they're no longer included in a particular file. So what we need to do is we want to go to the top and say, ""From API, import the package API. And then down here, we're going to have a couple of steps. We're going to say, ""API.includeRouter,"" and we give it the packageAPI.router thing that we defined at the top. And we're going to want something similar for the stats, so let's just do a quick copy and call this stats API. And this is just going to be slash stats. Like this, just something real simple. Again, we're gonna have to work that out. But up here, we'll have stats API. down here I'm hitting command D or control D on other OS's to do this so to make it duplicate like that. That's how I'm doing that nice and quick. Dot router. All right. With these we should be set. Let's go ahead and run it again. Looking good. Greetings from the world. What if we say API slash stats. No packages. Look at that. Stats is one. packages slash details, I have a FastAPI, the packages FastAPI, just to show you, I put it to it's a two. Put recent five counts five, six. Notice also, there's no quote there. This is a number, even though technically, this comes in as a string to FastAPI. we told FastAPI it's an integer, it converted it to an integer for us. FastAPI is super nice. It has a lot of these really nice quality of life types of things that take a while to really discover, but they're awesome. All right, so now we have the three API endpoints that we want, and we have them created as async functions. And you notice we didn't have to change anything. Like when we ran uviacorn up here, we didn't have to change anything. know, a FastAPI just looks at the view function says this one is synchronous, we'll run it directly. This one is asynchronous. So we're going to run it on the asyncio event loop. There's one more thing I want to talk about really quick here is getting set up to run this. Now, when we import this, if we run it, this bit of code is run, as well as this. It's great. That's how we're running it now. But in production, this is sometimes not at all obvious. In production, this file is not being run. What happens is we go to a real, quote, real web server like Gunicorn or MicroWizGee or something and then we just say go to the file called main, find the thing that's been configured called API and you in your way more complex production level mode, run that server and do whatever you need to do with it. What that means is this code doesn't run. So that code doesn't run well, and the routing doesn't get set up. So let's, let's fix that right now. Let's go over here and we'll create a extract a function called and figure a routing. Okay, super simple, right? We just took those lines and put them here, but what that lets us do is say else we need to run this other startup code. It's a little bit tricky that only in production you would be getting 404 as route not found, but in dev it would work fine because the main is the name of this module. A little bit tricky, but you want to make sure you run that in both cases. With that, I think the skeleton of our API endpoints is up and running.
|
|
|
transcript
|
12:06 |
So let's go ahead and implement one of these. As I said at the beginning, when we started this code, writing this code, we already did all of the work. Recall these services over here. We have a package service, and it has really cool things like package by name, which is already async, goes and does the query asynchronously with Beanie. Excellent. And moreover, the fact that this package itself is a Pydantic model, FastAPI has deep integration with those. So we can just return it instead of returning this dictionary. So that's pretty excellent. Let's try this. So we'll come over here, we'll say package equals package service. Package by name, passing name here. And if we go look again in here, we might want to do some normalization, all of our names are stored as is lowercase, it will say something like if not name or not name dot strip return none, right? So if they pass nothing, then we don't want, we don't have anything going on there. But we can also say name equals name dot lower dot strip. Actually, we don't need the second one. Maybe for some reason, we'd want it for performance reasons. But if it turns out to be nothing when you strip it, it's still going to come up empty in the database. We have nothing called nothing. There's no primary key. That's just empty string, which is good. Okay, so we're doing a little bit more validation whenever you're accepting arbitrary input from users on the internet. This is a concern. Also, you want to be careful whenever you're talking to a database that you're not falling into the little Bobby tables trap. Just Google or search xkcd little Bobby tables. It's amazing, it's a cartoon about SQL injection, but because we're using an ORM and because we're not using a SQL database, we're pretty much fine here. So no worries about that, but we do want to make sure we canonicalize the name and also test for it being missing. Excellent. So now we have our package and we should be able to just return package. Let's start with that. This looks like it should work. And again, remember, this is asynchronous, so we have to await it. But that's totally doable because we're in an async function. Thank you, FastAPI. However, I don't know how far back you remember exactly the order in which what happened. But this is not going to work out well this API slash package slash details, it's going to crash, it looks okay so far. And I got that internal server error response 500. That is not great. What's going on here? weird errors about, in fact, how the package ID has no attribute. Okay, that's a little bit weird. The thing that we're missing, the thing that is actually missing here, because we know that that code was running, right? We ran that code over and over again, previously in the Beanie world. What's missing here is actually connecting these models over to the database. And recall, we wrote this Mongo setup thing. So this should be easy. So let's do it right here. We're going to say Mongo setup, little control space couple times, we'll import that at the top right there. And we just in it, and it's pi pi. And of course, this is asyncio. So we got to wait it, but we're not in an async function. And there's no real other place to do this. So So we can just let's try this. This is not the way asyncio that run things like that might work, right? Why would not work? Run it again. I see it. It worked. It connected a pipe. Yeah, ain't no problem. Internal server error. Event loop is closed. What? I love this closed. Yeah. Okay, so here's what happens. When we set up that connection, the event loop that runs to actually do the setup, the event loop that runs to do the setup, that the motor client that persists for the life of the application that is running and that's basically grabbed onto and used for all the other async work done by motor and beanie. But after line 15 is closed, and then FastAPI manages its own async event loop. So this is a no, don't do that. It looks like a reasonable thing. What we need to do is kind of come along here and have another function called configure DB. And take this code down and we await it. Seems normal. How in the world is this supposed to be any different? So what we can do is hook into the FastAPI apps on event and it is startup, I believe. Let's run it again and see, make sure it's all cleaned up. Run it again and see, oh yeah, look at that. As the application is starting up, the on app startup ran, but the important thing here is this is running on FastAPI's internally managed AsyncIO event loop, which will be consistent with the same event loop that runs this function asynchronously. So when we do this query back into the client, everything's going to hang together. It's really important that the startup and the server execution or whatever other work you're doing talking to the database happens all on the same consistent event loop. One of the annoyances of Python's AsyncIO, I feel like that should be handled way more seamlessly for us, but it is not, which is okay. Let's go run this again and see what happens. Oh, there it is. FastAPI, high performance, easy to learn, fast to code, ready for production API framework. We can go just check it out. Like you remember, this is the readme on the PyPI page. This is long, and then you can see all the releases. But check this out. We went straight from MongoDB using beanie, turn that as a model, which is a Pydantic model, right, something more specialized, but it, the beanie documents are Pydantic models, as we know. And so it just plugs straight into FastAPI. How awesome is that? Let's duplicate this over here. And let's look at one more thing. Okay, so we go back here. With FastAPI, you can say slash unless you turn this off in that huge constructor for the FastAPI object. And it says, look, these are all the things that you can do. And check out how awesome this is. This is detail. This is reason. Well, this is the one we wrote. We give it a name and what comes back is a string. Wouldn't it be nice if we could tell people? No, it has a whole lot of structure. What is the structure exactly what is in MongoDB for this particular example. So let's add that real quick over here as well. So in the decorator, not in the function, we can say response model equals package. Import that from our models. Run it again. Look at this. Look at this schema that we're telling everyone. This is what it looks like to receive a response from my details. It has a dox URL, which is a string. It's the last updated, which looks like a date, but they can't say date because it's JSON. It has a list of releases and each release embedded looks like this. There's maintainers, which looks like a string, you know, converted from an object ID, right? So here we go. Look how awesome this is our first glance at why it's so cool to use Beanie along with FastAPI. Let us count the ways. All right. So it's amazing to use Beanie with FastAPI because FastAPI is awesome with async. And Beanie is 100% async native. So they work together really, really well there. Another one is when we model our database, we do that with these Beanie documents, which are themselves Pydantic models, FastAPI is all about returning that data, parsing that data correctly, and even using it for its help in schema generation, right? There's tools that'll take that open API definition and generate strongly typed consumers of our awesome PyPI data if they wanted to. Cool, right? One final thing before I'm willing to call this done. could come over here again and say FastAPI to internal server again, not again. What is it? It is that none is not allowed an allowed type. Okay, for package. But if we just do a print name, guarantee you, that's still coming through. Somewhere. It's still coming through, right? It's deep down in here. So what we want to do is, like the errors, we're trying to return none when we said the response model was a package. So what we want to do is say, you know, if not package, we could say like this, I guess if package is none, if you prefer to kind of be explicit like that, what we want to return instead of trying to return none, which we saw as a crash, we can return error out of our API. So we can go to FastAPI responses and return a JSON response where the error is, let's say, be more specific name, package name not found. And very importantly, the status code also communicates that this resource doesn't really live here. Let's try again. Try again. Look Look at that, not found. If we go inspect, go to network, try again, you can see the response somewhere here, a way on the left, or the wrong way, is a 404. And if we go to the raw data and pretty print it, the error is package FastAPI two is not found. But of course, if we do this one, we get a 200 A-OK and we get all the details. Similarly, if we do Beanie and others, right? Really, really cool. So that's what it that was the final step needed to kind of round this out. But look at this code. Look at how amazing it is. That's the entire implementation of package slash details slash give us a name. Really really cool. This is an incredibly small amount of work to add on to go from we have these core services that talk to the database and these models and pedantic and beanie models to just turn them into async user facing HTTP services with proper error handling and proper documentation and schema communication there with open API. Hopefully you are impressed but do not forget, do not forget that you must initialize the connection to the database on FastAPI's startup event. If you try to do it directly, you just get some weird, hard to understand message that the event loop is closed. You're like, ""Well, this is broken. I don't know what to do. All right, this is what's happening. Hopefully that will stick. Just come back to this example if you forget. All right, I consider this a huge step forward. We've already connected to the database. We've already created a package and returned all of the details. And the integration is really, really sweet.
|
|
|
transcript
|
8:35 |
Well, that was really easy. Let's just do the same over here. Okay, so how'd this go? So we've got this count coming in. Maybe we'll say count equals max of one and count just to make sure that it's a positive number, right? If they pass like negative one or something silly in, we won't let them pass that over or zero. So we're going to get our sum number And we have our package service, we've already written all this code recently updated, and we'll pass in the count. We have to await await this. And what do we get back here? Remember, this is going to give us not how many packages were updated, but actually, the packages themselves. So in a sense, this should come back as a list of package, which we didn't say, did we. But that's what we're getting as we call to list on our packages. Okay, great. So we can return what do we want to return here, we could return just an array, not sure that's gonna work out. So we can say packages, we could pass back the count. Yeah. And maybe we want to return packages. store this in a variable, then we return that. Okay, we don't yet have any documentation or anything like that. But let's see if this will work packages recent. Okay. Well, there it is. Look at this. It totally worked. How big of a response is that? 265 kilobytes. What if we asked for 50? The response time starting to get up there is two and a half megs. Maybe, maybe we don't want to return all the details about it now. Maybe the goal is just to say, I just really want to tell you the name of the most recent one. And if you really like, for example, let's see, what is this? Oh, it's Beanie. So what if the goal was like, okay, well, if I see beaning that list and I can just go into detail slash beanie and get the details if I want, right. So maybe the last updated date would be interesting and the name as a response there. So well, then what do we do? Do we go into a list comprehension? I'm going to try that. Let's try that for P and package. And then we're going to return what name? dot ID, comma, date are updated. Let's just say that you don't last updated. How's that going to work? Oh, not with the details one, but this one. Okay, that's better. The size is back to 2k, we kind of still get the same information. All right, I'm liking this. I'm likeness. What about over here? Am I still liking it? I'm gonna tell you no. Because again, what I get back is a string. That's not really what I was hoping for. So how do we approach this? So here's a little bit of maybe a cold splash of water, not terribly bad, but maybe somewhat. We've got these pydantic models in the database, and we're modeling them. And they're, let's just assume they're perfect, we love them. And sometimes that is the thing you want to just send back you like, well, here's everything we have doesn't have any personal information we need to redact like a password or anything, we can just return it back, it's fine. But here, we don't want to return back just a list of packages or even a straight array of them, we want this subset of data with a name and an updated. So in order to do that, Even though what we get back is somehow involving Pydantic, we need to create API focused Pydantic models specifically for both the return data and the documentation and schema generation. So without this already being called models, I might call it models. Where will we put it? I thought about calling this API models and putting those models in there. I don't want to mix them. When I look here, I want to see only database stuff. That's my opinion. So I could have API models and models or how about API and just in here, we just make a thing called models. Okay. And what is this is a recent. So call it recent package model. Recent packages, how do we make a Pydantic model derives from base model. Over here, we were trying to return something like that's well have name, which is a string not optional, because that's the primary key and updated. The date time, date time, date time, there we go. And that's it. So let's go. Let's go and say we want to take the same data here. And actually, I want to retract right, but there, let's, let's also include the count and packages over here. So let's, let's make this a recent package. I'll call it recent packages model. So this will have a count which is an int, we're echoing that back and this will be packages. This would be a list of recent package. There we go. Leverage the embeddability, the embedded nature of that. So we'll say model equals one of them, right, one of these characters. And what goes in here, the count equals count. And then packages equals let's call this package models. We've got to define that and we already have this list comprehension here, right? I'll comment this out just for a moment. So I can commit it you can see it in source control. If you go into history, right? We're going to say it's equal to this but instead of creating a dictionary, we'll create a package model. We call it recent package, sorry. Name equals p.id. Updated equals. Like this. We'll use a little list comprehension to generate that list and project down into this much smaller set here. And then for our recent package models, we'll just return model. And we'll round it out by making this part of the documentation by saying response model equals that. Let's see if this hangs together. Here this should look the same. It does. Whoo, that's good. But this, this should look different. Recent packages and look at that. Here's the schema that we expect to get back is application slash JSON. Super cool. Again, really easy to implement using the fact that we already wrote the code to go and get the recently updated packages. But in order to transform that into something that makes sense for this API, even though what we got back is a list of Pydantic models, effectively, that's not enough, we don't want to return that all we want to give them a different view, this is going to turn out to be really important when we get to the high performance section. Because if we had returned, you know, that 2.5 megs of data, that is a lot of data coming out of Mongo. That's a lot of deserialization into Pydantic models in memory on the web server side. And then serialization back into JSON and then shipping that over the network. That turns out to not be awesome. Remember this is 100 times smaller, maybe more, and went down to 2.7 kilobytes. I don't remember if that was compared to the 5 or the 50 or more. So anyway, it got much, much smaller, which is excellent. So there's this little bit of extra work that we had to do to transform our data. And that's just the way it is. You don't always want to just turn your database into a thing that users request over the internet, right? Maybe you do, but most of the time you want to have more structure and more control over it. And here's one example of doing that. We'll see the same thing with the stats in just a moment.
|
|
|
transcript
|
3:36 |
Even the database, we didn't really have this model for stats, did we? We just said how many users are there, how many packages, how many releases. So we're going to go just like we saw before, it's not 100% required, but it's preferable that we have a Pydantic model that is the well defined schema and exchange for this API. So let's do the same over here. have a file called stats model. And here I have a class which says stats model. And it has user count, which is an int, package count, and release count. I think those were the three things that we were modeling. So instead of this, we'll say model equals one of those import it. We'll come up with some variables, users, packages, and so on. So again, we can go back to these services. So package service had a, not for users, packages. We had a package count, recall. And we also had releases, which will be the release count. Then we had our users, which was not the package service, but the user service. And user count. And what do we have going on here? Int, int, int. So what is the problem? If we go look at this function, what does it return? It returns an int. Why is there an error here? We'll hover over it. We expected an int and we got a coroutine. This is something that's so easy to forget all the time. So until we await these, they never even execute and they definitely are not going to be integers. Now they are. All right. And so instead of returning this silly thing, we're going to return model and then to wrap out the FastAPI integration response model, this as well. it one more time. I guess we can see the documentation straight away. Stats. You can see exactly what you expect, but let's also see it with real data. Perfect. Those are the numbers we would have expected, right? We were last playing with adding new releases and we got that from 804 up to 812 while we were fiddling around. But yeah, there it is. If we look of the raw data exactly as like you would expect. Yeah. Super super cool. Let's just do one more thing. Just look at the network here for a little bit of performance. 17 milliseconds. Pretty stable. Really really excellent there. Okay. Guess we can do the same thing. I don't know if we did that here but we can. Let's do it again. Again pretty fast but this one 100 milliseconds, shouldn't be happy with this. We can do a lot better as we'll see. But let's save all that for the performance side of things, okay? You know, that whole chapter. All right, so we've got everything working pretty well, don't we? We've got our three endpoints created. Two of them required specialized models, but one of them over here was able to leverage the database model because that's exactly what we wanted to return to people. Excellent.
|
|
|
transcript
|
2:01 |
There's two more really quick things that I want to do just to round this out, we could call it done, we have our API pretty much working, don't wait, it's pretty awesome. But I want to just do two real world things that you would do for FastAPI, I already told you, right, we're going to kind of build this out proper, like with documentation, which what we saw over here with our model response model integration into open API, those sorts of things. Here's one though, Hello World, or if we named it, you know, something down here, just like index or home, whatever you call it, and we refresh this, it'll get a slightly different name. But is this really part of our API documentation? No. It's just here so that if we visit the site, we didn't get a 404, right? We just got at least something here. Now, this is not a great response. We're gonna work on that. But we got something that wasn't just a 404 not found until you managed to somehow type in the API endpoints. All right, but it shouldn't be here. So let's exclude the parts of our site that either we want to just keep super duper private, or for things like this that are really just about exchanging information for a user, a human for a browser, not for an API call doesn't belong in the API documentation. Turns out, it's incredibly easy. You go over here to this endpoint, this is the homepage, and a really, really loose definition of that. And you don't want to show up, you just say, instead of response model, you say include in schema false. This is not part of my API. Don't think that it is, please. Run it again, refresh. Better, there we go. We have our three endpoints over here in our open API, FastAPI documentation. And the thing that was really just there to support normal use of a website, but it's not an API, is now gone. Just include in schema, false.
|
|
|
transcript
|
10:42 |
I told you there were two things that we needed to wrap up. One was this index page, quote page was included in the open API documentation when it clearly had nothing to do with the API. The other one is, what the heck is this? This is a web page, right? This is supposed to be the page you see when you just go to the server. You're not supposed to see a JSON response. one should have a message like welcome to our API, here's our docs, here's the things you could call. Here's a getting started guide and then go into the API. At least that's the way I see it. So what are we going to do to fix that? Well, FastAPI has integration with Jinja templates, same things you probably know from flask if you've done that, for actually returning real web pages. So let's add a proper web page here. The first thing to do, well, Let's have some HTML. Okay, so close that back up. And I'm going to create a folder. And very, very commonly in Python, this is called templates, all the frameworks, so much so that if I right click on it, I can mark directory as a template folder. And that triggers PyCharm to says, go say, what kind of language are you working with? Are you working with Jinja, Django, million? Let's go fix that. we'll make sure that we have proper chameleon auto complete and syntax highlighting out of our HTML files. And it's purple. It's cool because it's another color play with that's always nice. So then what are we going to do? Well, a couple of steps. The first thing is we have to set up Jinja and plug that into FastAPI. So up here, we can say from FastAPI dot template in import Jinja templates. So we come over here and say templates equals Jinja2 templates. What we need to pass in here is just a directory. So we'll say directory equals just the name, the relative name templates of this folder. So if you wanted really to call it something else you could, but it's not really the convention. That work yet. And there's the error I was looking for. So FastAPI uses Jinja, but it doesn't have to. And so it doesn't ship as a hard requirement with Jinja. In order to use it, we have to additionally install it, kind of like we saw with the argon algorithm for fast for passlib. So one more round through this world. And you do use this to generate our requirements file, which in here has a Jinja and we'll just install it down here, but you could click the button. Excellent. So go away. Now we should be able to run our code again. So the final thing is, wherever we want to refer to a template, right, first thing, we're going to need a template, but then we're going to use this template object to render it as HTML dynamically. So we come over here and say new HTML file, we'll just call it index, I like to call it the same name as the function here. So index, index, index, index dot HTML index. Welcome, welcome to the the PyPI API. Fancy, isn't it? I know, I can tell you're impressed. So then somewhere over here, instead of doing this, we're going to return templates, template response, and then we have to give it the name index dot html. And this can be a sub path name and have directories and sub folders and all that kind of stuff. But it's start here is the route and then go down so we could keep going from there. And then we have to pass in a data dictionary. So for example, if we have, it's called name, right, something like that, we're going to pass that in, we would come in here and we would say name equals the app. There's one colon, it's a dictionary. Here's one other thing we got to pass in. And that is the request. Jinja needs access to the starlet request so that we can so we can do its job basically and write out the HTML. So we got to come over here and say this takes a request, which is a type of starlet request. All right. We'll clean up. So we're using this HTML file passing this optional data and this because it's required by the page and Jinja the runtime needs that. Hit it again. Whoa, look at that. Welcome to the PyPI API is called the app. And we can view source. And there you go. That should look really, really familiar, except for that part right there, is that part right here. Super cool, right? Well, this is fun, but let's make a more realistic look on one. Let's just put in a little bit of, hey, you could click these links to try them out really quick. PyPI demo app. Rerun that, just to get it to reload the template. There we go. That looks good, but more importantly, now it looks like that. not much to see, but if I click it, now I can sort of interact with the API instead of just getting either a 404, just greetings as a JSON document. Okay, so I'll leave it as an exercise to the user to go and improve this. Obviously, it's not great, but it's at least when you open up the page, you go in, you get a little bit of something that feels like it's a working website. So that's what the whole goal of this is. One final thing on this serving up HTML, actually I have a whole class on building full web apps with FastAPI, if you wanna go check that out, it spends a ton of time really working on the nuances of making this side of FastAPI awesome. But just really quickly, if we just wanted to appear in this header, we just wanted to have some kind of style sheet link, like /static/site.css. Well, it doesn't exist, so that's a problem. But even if it did, right? This is also another layout convention is to have static here and let's even do CSS. So we'll have like a CSS. Even if this were to exist, notice PyCharm is starting to think part of the string is okay. I'll have a new style sheet site. And we could take this little style this a dot visited over here. Put it in there. Let's also say body background. Right, it's yellow. Okay, so that should work. We have our page is referring to it. And it is there and pi charm noticed thought it was okay. Hmm, well, that would purple. And it's not yellow. Something's wrong. If we look at the network, you see we're getting 404. So the final thing to do, you want a real app, just to leave it at this, is we have to do a little bit more on this configure routing. So up at the top, let's say, from starlet.static files, import static files. We're going to, in the configure routing, do one more thing. is when I say API dot mount static. So that's the URL to this folder. And then what are we going to put in there static files, and this thing takes a directory, which so happens to also be called the same static in a name equals static. Whoops. That belongs to the mount call. There we go. And again, so this tells FastAPI to serve up static files. Well, technically it tells starlet the foundation of FastAPI, serve up static files out of there, which gives us a chance for this to not be a 404. And instead to work and turn it into this yellow. I'm not sure I want to leave it this way. But maybe I'll leave it this way. Anyway, you can see clearly that this now is serving up our CSS file right there. Excellent, excellent. Maybe the last thing just change this title. That's kind of silly to have it like that. refresh it. All right. Now, if you bookmark it, it doesn't say title or untitled or whatever the heck it might say. It just says here's your demo app. Cool. Well, you've learned a little bit of FastAPI if you haven't used it before. And if you have used it, now you know for sure how to plug in Beanie and the async MongoDB stuff and even the Pydantic models that come back from Beanie when you can plug them into or use them in your API responses and maybe when you shouldn't. We set up the routing, including static files. We used router so that we don't have to jam everything into one file, which is not the way to do it. But we put our package API endpoints here in the package API folder, as well as the stats one over there. the on startup async event to run the connection to Mongo through motor and beanie correctly on the right event loop. And finally, we set ourselves up for success in production by doing all the setup plus running the main or just configuring the routing and not actually starting the server. So that's it. That's our FastAPI integration. We're going to come back to this and do some more interesting things with it later in the course, but hopefully this gives you a good sense of why you would choose Beanie, why it's awesome to have Pydantic involved, why it's awesome to have async queries as part of Beanie. It all comes together in frameworks like FastAPI.
|
|
|
|
41:14 |
|
|
transcript
|
0:48 |
For the most part, throughout this course so far, I've intentionally not really talked about performance. But I know many of you are here to choose MongoDB because you've heard that it's fast and it's easy to make it fast. Well, that's certainly been our experience with Talk Python, with the courses and with the podcasts. It's had a ton of data and it goes super, super fast. But it doesn't do that out of the box. You got to apply three or four different techniques and taken together, they're really, really awesome. So that's what we're going to do in this chapter. We're going to go see what knobs we can turn to make MongoDB fast. And then we're going to go apply that to the code that we've written already for our Beanie PyPI API story.
|
|
|
transcript
|
4:38 |
So you've heard that MongoDB is fast, and yet you go and run a query, and here you can see it's taking 0.7 seconds. Now, I don't know where you're coming from or your perspective, that may seem actually somewhat fast, but to me, that's slow, slow, slow. We should be able to do so much better than going and getting our data back in a second or so. So in this chapter, like I said, we're gonna make it fast, we're gonna get that same answer back, but this time, it's going to fly. You can see now we got that 700 millisecond request down to be 700 times faster to being just one millisecond. There we go. So what knobs and levers do we have to turn to make MongoDB fast? What is available to us to actually affect and control how it runs? We have indexes, indexes, indexes, indexes, never forget indexes. They're easy to add, although they are a limited resource for you per collection. But they're really easy to add and they are like magic database fairy dust. You sprinkle a little bit of index on and wham, your database is so, so much faster. That thing you just saw where it went 706 times faster. because we added an index. Incredible. Another one we've touched on this, but not so much from a perspective of performance is document design or just how we model our data. We did talk about to embed or not to embed and all that. But reiterating that is a huge knob that you can control on how you design your documents. Query style. Previously, when we built that API a couple of chapters ago, what we did is we said, first, let's check and And make sure the package is there. And then we're going to do a request to get the package back, make some changes in memory and push all those things back into the database. That's one query style and extremely ODM object oriented style programming. And I do like that style and it has its place. But not always, especially not when you're worried about performance. So as we saw, there's atomic in place updates and those types of things we can do. So we can change our query style for pushing more of the work straight into MongoDB instead of inside our Python app. We can also do what are called projections. You may have heard that select stars a bad idea because it takes all the data and you should select only what you need. Well when we just pull back documents by themselves, we are effectively saying give us all of the document. But not just that also the embedded documents and possibly their embedded documents as well. So that can be a ton of data. If you don't need it, don't ask for it. And two larger deployment topology, distributed database types of things you can do with MongoDB that we are not going to cover in this course, 'cause it's not really about Python and async, you can look into this if you want, is we can create what's called a replica set. Oftentimes this is done for uptime and durability. So there's sometimes three MongoDB servers working in a cluster and you connect to all of them, if one goes down, then another one picks up and they're replicating within themselves, in that scenario, you can set it up so that you can read from the other replicas. So for example, let's say you have five MongoDB servers in a replica set, you could sort of 5X the performance or the capacity of your database by saying, I'm willing to read from any of the replicas. You start to get into consistency And it's it's can be tricky, but under extreme needs for performance, it's an option. Another one is sharding, which is to say, I'm going to take part of the data and put it in one MongoDB server, have another one kind of like replica, but instead of making a copy, we're going to put a slice of the data for each one, like, maybe if we're tracking people by where they lived in US states, each state could have its own server assigned to it so that we spread out the work across many other servers. That'll make reading and writing faster. Cool, but again, not something we're covering. You can look into those two things over at, it's a pure MongoDB server side type of thing that you want to control there. So interesting, knobs you can turn, not knobs that we will be turning in this course.
|
|
|
transcript
|
2:21 |
If we want to create an index, there's two ways to do this. They could be combined together or they could be two separate things, however you want to look at it. First of all, you can actually go to the database directly and create an index. Just using the MongoDB shell, you could do this within 3T or you could do this within the MongoSH, the MongoSH, or however you talk to MongoDB. And in this scenario, we go and say DB, remember, use whatever database. So in this case, it would be use pypi, then db.packages.createIndex. The first thing we pass is the key or set of keys. So in this case, we're gonna say package.releases.majorVersion. So we're gonna traverse way down into that hierarchy, through that hierarchy. This is why document databases still work so well, is you can have that hierarchy, but you can still do high performance index based queries deep down into those things. Remember, releases is a list, and inside that list is a bunch of embedded release objects. Excellent. And then we can set a direction. So either one or minus one. This is really used for sorting. So it's not super important just in terms of query speed, but if you're gonna do sorting, then it will potentially affect that. You can also set whether it runs on the background and it's a good habit to set the name of this index. The reason it's good to set the name is we will see when we get to the Beanie side that we can also set a name there. If those names are different, but the actual keys are the same, or somehow, basically if the keys are the same, you're gonna get an exception when you try to set that and when you try to run it. It says, well, we tried to create this thing called releases major underscore ascending. And there's already one called releases major. And if you don't set a name, they arbitrarily pick a name the different frameworks do. So setting it allows you to say in both places, like, no, no, no, this is the same thing. Don't worry about it. So you can set it here in the MongoDB shell, independent of Beanie or any other way you're talking to MongoDB. Or what I prefer to do for my apps is actually set it inside of Beanie.
|
|
|
transcript
|
8:48 |
All right, let's write some code. Over here, new chapter means new directory, so I'm going to call it chapter 10, like that. And again, we're going to see this blue, we could right click, mark directory as unmarked as sources root, or you could just hit whatever hotkey your operating system has specified there, which is what I like to do. Similarly, there's one to create one here as well. Now just like before, we want to take the code from the previous example and use it going forward. So I'm just going to nab all of that and paste it over here for now. This time, instead of having FastAPI, we don't want to have that. Instead we're going to have what we're going to call the speedy CLI. I'm just going to drop some code in here that we've already brought in. All right, let's talk through this real quick, because what's important is not how we're running the code, but how we can make the answers that we're getting from the code that our MongoDB service, our Beanie service that we created, how fast that is. So kind of like before, we can show the summary stats, we can search the database, we can find the most recently updated packages. We have just a header that says this time it's version 1.1. But now when we have these summaries and things along those lines, we're doing it a little bit different. For example, this time we have a timed async. And instead of just running the query once or these three queries once, what we're doing is we're running it some number of times. And it looks like that is 100. So we're going to answer ask that question 300 times. The idea here is anytime you're doing performance type of testing, just asking once doesn't make a lot of sense, right? There's in the motor package, there's a connection pool, maybe a DNS lookup in a network connection. That's actually where you spent most of your time the first time, but then the next time it would just be still talking to the database. So this lets us get a lot of that warm up stuff and out in the wash if we do it 100 times, and then we get the same output. Similarly, we can get the recent packages, but instead, we're going to do it a whole bunch of times and then return them. There's a bunch of functions in here about when I get a package, but let's get it 100 times, right? All of those things to make it go good and fast. So let's go ahead and run the program now. Let's also make sure we're running the correct one. There we go. So we can see our summary ran in 715 milliseconds. Again, every time you see these numbers divide by our times up here, which in this case is 100. Right, so we got that. Let's go over here and see the most recently updated packages. That's something we could do. So what do we get back? ran in one second. So in that case, let's go down here and double check. We're calling our time recent. Again, that does it how many times 100 times or number of times. So when you look here, divide that by 110 milliseconds, not terrible. One thing you do need to keep in mind for this data is there's only a quarter million releases, there's only 5000 packages, not a ton of data to work with. So we can make it better. If this was a real system with millions of records that had no indexes, and then we add them, it'd be great. But nonetheless, our goal is to make this a little bit faster. So let's go in here and see what's happening. The first part when the first idea, the first thing you want to consider when adding an And index is what am I querying on and or what am I sorting by. So in this case, find all, nothing we can do to make that faster. That's just get them all to us for now, at least with regard to indexes. But this sort by package last updated descending. Well, if that's something we're going to do often, let's go and add an index for it. So when I go over to package, and recall, we have our settings class and down here is where we can put our indexes. Now you can do things like just this negative last updated would create an index, but it doesn't give a name, as well as it doesn't let you do more specialized things like composite indexes as well. This is nice and clean. But indexes are so important, I think you should be a little more explicit about them. So what we're going to do is we're going to use PyMongo, which I don't believe we've really used at all yet. I want to have an index. The first thing that goes in here is the keys. And this is going to be a list of tuples, which is kind of funky. So what goes in here is last updated, and then PyMongo descending. Now this, I believe, would be enough. But the other thing we want to set, as I said, is a name. So let's call it, I like to say, something involving the keys and the direction. So I will call this last updated descending. Now if we go over to our Studio 3T, and we go to our package, make sure we refresh it just in case. Notice there's just the default primary key index. And we run this by virtue of Beanie starting up and looking at this. When we do the connection, we pass over the package, it looks at the settings, says, oh, that index is not there by that name, we're going to try to create it. So we run it again. Now we haven't done anything yet, have we? Let's go see. We refresh. And hey, hey, look at that. There's now this index here. And if we go explore the index, it has the field, the direction, other options if we wanted to make it unique or have a time to live. Those are for temporary tables that don't hold the data forever. All these different things. If you want to do full text search or geo, geospatial types of things, all of this business here, this is what we can specify using the full PyMongo index model rather than just the name. So you can sort of grow it and expand it as as needed. You can also do things up here and say that this is an index field directly, but I kind of like to put the indexes all in one place. Let's go read this code again. What we asked before before is the recently updated packages. They go off the screen there. Look at that quite a bit faster, run it one more time. 500, you know, the database is getting used to using that index, we could go over there, and we could actually verify that this index is being used. If we go back to packages, if you want to, you could write out that same query. So find not sort. And then the sort is going to be last updated minus one. And then we had I believe we had on there a limit of five. But we got back, if I disappear for a minute down the right, you can see that ran in two milliseconds in the bottom right there. But we can go to this and say explain, explain yourself, explain says MongoDB, what, what are you doing to run this query? Tell me more about it. So it's going against pypi.packages. Cool. Look at this index scan. Awesome. What index is using the one we just created last updated descending. Well, that's the winning plan because it was super fast. We're eliminating by five. And we're doing this index scan to figure out the order. Excellent. So you can see, we can understand how those changes we made over here in beanie. Right? How this index model we created, which then push that over to MongoDB, we can understand whether or not MongoDB is actually using it provided you're able to write the same query up here as we're running in Python and Beanie. There's one index. We have more to go.
|
|
|
transcript
|
6:40 |
Let's go back and think about how our code is being used here. So we use our last updated date, but we also might care about the created date. So let's add something in real similar. I won't type it in again. We're going to have created date. Could be ascending or descending. Let's go with ascending. That's fine. Another one we might want to ask is, show me all of the packages that has this author email set. So same type of deal, we're going to have this key is going to be author email. I don't think we'll ever sort by it. So that doesn't matter. And we'll just have author email ascend. Similarly, we might want to go to a particular release up here and say I want the one with the major version equal to this or the minor version equal that or the build version equal to that as well. Even possibly the created time. Let's go ahead and throw that in there as well. So how do we speak about the releases? It won't be capital release, it will be from this document's perspective. So it's releases dot created date. And let's call this releases created ascending. So this dotted notation here will allow us to traverse into the hierarchy, right? you see dot, that means go into the sub object and be for as far as indexes go, just forget that there's an list here, just refer to it as the thing as if there was one of them in there. So in this case, if there was one, it'd be a single release. Similarly, if you want to index on this ID here, we would just say, maintainer IDs flat, even though it's a list of items. We also might want those three major minor build. So we would put releases dot major version, or at least it's a minor version, or at least it's a build version, right and give them names. But what we were asking before was not major version, minor version, or build version, we were asking for all three, I want this major and this minor and that build version using element match. And so in order to do that, we have to do something a little bit more interesting. So you might have been wondering so far, like, why is this a list? That's weird. That's a little weird, Michael. Why is that the case? Because into this list, we can put more than one thing. So we can have the major version, the minor version, and the build version, all three of those in here. And this will be releases version, let's call this ascending. So this will allow us to use that when we're asking for all three of these. Although it gets It's a little tricky for sorting, you can only sort them all the sending are all descending by that particular thing. You can't mix and match like sort by major ascending but minor descending. But why would you ever do that in this data model? So it's probably all right. Let's run this again. Beanie will create all these indexes. And we'll see where we are. Heading back over here, refreshing our indexes. Whoa, look at that. We have our composite key on all three of those. That's pretty cool. And then the others would be just as you expect. So let's run our code again. And this time we can search the database for packages. So F, and instead of asking you over and over, we said, let's find a package, we're going to look for FastAPI, we're going to do that 100 times. So we got it back in 300 milliseconds. That's pretty fast, isn't it? You should feel pretty good about that. So that's 0.3 milliseconds to find the package and all of its releases and pull it back. You can see right here with 154 releases, and as well as like all that description text and everything that is epically fast, we could do better. You'll see we're going to do better actually. Now if you say I want to find all the packages rather, I want to count how many packages there are with the version 728. That took 100 milliseconds 135 milliseconds, that's a 10th of a millisecond. We went through a just under a quarter million releases. They are interspersed within 5000 different records packages as lists embedded inside of them. quarter million of them embedded inside 5000 different records, we were able to ask how many of them are have a version exactly 7.2 dot eight, there are six apparently. But we got that answer in 0.135 milliseconds. That is ridiculous. indexes, their magic. Let's see if I can come over here and remove all of these. Try it one more time. Let's just say find a package. Look at this. Holy moly. 2000 milliseconds or 20 milliseconds per one query. All we had to do to make that happen, a little bit of this, a little bit of this. Think about where is your app's performance, what kind of queries are it running. You've already thought a lot about this because you've thought about the document design. So you're like, well, we're going to need this data with it and we're going to ask questions like this. So you probably have a really good idea here. Let's run it one more time just to see, we'll get it back. Look at it this time. Look at this. 89 milliseconds. What is 89 over 100 divided by 1000 to get it into seconds? 0.0009 seconds. Incredible. So less than a millisecond to go through those quarter million releases embedded and sprinkled throughout 5,000 packages. Indexes, they are so awesome. Don't forget to turn on your indexes. Again, another Another kind of question we could ask is the most recently updated ones. That ran in four milliseconds per query. Still seems kind of slow, doesn't it? We're not done. Indexes are awesome, but they are not the end-all be-all. There's still more to do here.
|
|
|
transcript
|
3:48 |
Before we move off indexes, there's still one database class to go here, and that's user. Let's go ahead and add them here. Remember, indexes never go on the base model. They go on the top-level document. And in here, we're going to almost always want to know if we're tracking it, we're tracking the created date, we very likely will want to be able to ask questions like, ""Show me the users created today. going to be a filter into a before after time window, or we could also be sorting by the most recently created ones. So that's going to lead to two indexes, created date and last login, because we probably want the newest who is logged in most recently and who has was recently created. Let's put descending as that would be the default way to go. The other thing we're going to want to have is find users by their email for sure. So that gives us one more index which will be find them by their email, ascending, descending. We're not going to sort by email so it doesn't matter. But this is interesting. This is new and we have not seen this part yet. You can specify that this is unique. So remember we didn't want to use the email as the primary key as the underscore ID which itself would have been unique. That would be not good because we want people to possibly change their email but not change their primary key. Still though, we don't want two users with the same email. We kind of talked through that scenario before, but here's how we make it happen in Beanie and MongoDB. So if I run this again, refresh our indexes. Now we're looking at users, of course. one options that unique, you can only have one email. Perfect. So that's what we want. And we can try to verify that this is working. So if we run this, we come over here and say we want to create a user, the user is Michael Kennedy, I think I'm already in here. We'll We'll see. Error, cannot create a user with Michael Kennedy at talkpython.fm already exists. How do we know that? How did that surface to us? Over here, let's track this down. So we go to create user. We're just checking now, but if we actually tried, if we turn this off, okay, I guess if we just turn this off, we're being a little bit kind and checking ahead of time. You don't want to ask these questions and then tell them all that data you entered is wrong. But let's say we'll create a user, a letter A as you know, Oregon, USA, and an exception. We're making our way down. Eventually we'll get an exception all the way down. Here we have that MongoDB is not happy with us trying to do the insert. That's the one we're looking for, a duplicate key error out of PyMongo.errors. That was caused by this index that we set. You can even see the index, email ascending, duplicate key, and on and on it goes. All right, so it is impossible for us to insert data that would violate the uniqueness constraint. Let's put these back. So it's got a little more friendly interaction, but if you try to force it into the database, you can see it's not going to let it go. And the reason for that is over here is this unique equals true. Excellent.
|
|
|
transcript
|
9:08 |
A quick note, I just switched this to the match statement that I was using in this example here, rather than the if else just so you have it exactly the same, nothing, nothing too much going on there, but just a minor update. Okay, so we saw that some things are fast. For example, when we search the database, that was really, really fast. They're getting timed packages 300 milliseconds. And what we did is we got a FastAPI, all of its details, its description, which is the whole readme, as well of it, it's 154 releases. And one thing you might say is, well, you designed your documents poorly. Here's a scenario if we go see where it's getting used. Where we get the package back, and we just show the ID and the last updated and we don't necessarily have to show the releases. we're just going to do like this, like that. It's still not going to change the time, about 300 milliseconds still, because regardless of whether we're using the description, regardless of whether we're using the 154 releases, we're still pulling them back over and over and over again. Not ideal. So what can we do? We can do a projection. We talked about projections when we talked about the MongoDB query syntax in the native shell. But what about Beanie? What do we do here? We go back to Pydantic, and we express a smaller class that we would like to project into, which is a pretty neat way to do it. So what we're going to do is we're going to go here and we have our regular package, which derives from Beanie.document. But down here or in a separate file, we can say a class will have package top level only is what I'm going to call this. You call it whatever makes you happy. It's going to be a Pydantic.baseModel. And then you just go up here and you cherry pick. You're like, ""All right, well, the ID is important. The updated date, not last updated, but summary. I'll just copy those and we can throw them away. We don't need the defaults because we're not creating them. They're going to come out of the database, but we also don't need this. Let's say those are the three things that we need. It's not quite enough though, we got to pass a little bit of extra information to say how that projection is actually done from Mongo into these things because this could be called and created date if you are a monster. So in here we're going to have a settings class as well, an inner class. And instead of having things like what collection does it go to, we're going to talk about the projection. So we're going to say we're going to want the ID and that's dollar underscore ID. This is the Mongo query syntax there. We want the summary, which is summary. And we want let's just say we want the last updated, I guess. Like that. Because that's the one we're using recall up here, we're not talking about when it was created, but when it was last updated. Okay, so we want ID last updated and summary. And this has way, way less data. Recall over in a package. It's the main amount of data is all these releases, right? For FastAPI, there's 154. That's a lot. We're not getting any of that, as well as the description itself, which is that read me the other huge piece of data. So we're missing all that. What happens if we now go and change this get timed package, which means package by name, and let's add a keyword argument, summary only. And in this case, we're going to set it to be true and we're going to have PyCharm add the summary only on there. And if we go to the definition, now you can see summary only is true, but we really want this to be false by default. We're just going to use in that one case. There's a couple things we can do here. We could write the query and expand on it or we could just do two different things like your most natural instinct might be if not summary summary only return this else what what I'll get the key right. What goes here? something. Let's write it that way real quick. And I'll show you a cool alternative. So onto this, we can say dot project. And all we have to give it is that projection model. So what was it was packaged top level, but PyCharm do all this magic to import it. So let's run this again. So let's see if we remember, here's the time to get FastAPI 309 before. Look at that much faster, three times faster, or if you call it much faster, but it's definitely an improvement. Let's look again. 83. Oh, so that's almost four times faster 3.7 times faster. So that's way less stress that we're putting on to MongoDB itself. There's a lot of less data on the network, there's less disk access, potentially, if you have a ton of data, all of these things. And all we had to do is say, we're going to project into this set here. And it works because we weren't making any changes. Now if I go back and reset this real quick. We run it again to have the packages back. No releases. We don't want to pull those back and we can't leave the code the same. We had to make a little bit of a trade-off there, right? I think it's fair. We're like, ""All right, we don't really need to see how many things were. What we're actually interested in is that."" Just keep Keep in mind you only have the data comes back here. Maybe one final thing in this. We said we're getting an optional package. Should probably say or a package top level only. Right. That should be a one or the other. You might be able to convince me to use none right here instead of optional. But you're going to get this or possibly this. So you want to be careful now that we're we're talking about what comes back accurately in in terms of the typing, not a big deal, but just keep that in mind. Finally, this is the naive way, and it's fine if like this is the code you're writing, it's super simple. If you had a complicated query, something like this, you probably don't want that. You probably wanna be able to reuse as much of that as possible. So watch this, if we go over here and we create a variable called query like that, we're doing the whole query and either we're executing it directly here or we can then apply on further things like to list, list and etc. It doesn't actually apply right there, but whatever additional things you would chain on including potentially other filter queries, other filter aspects, you can just keep piling those on before you await it. If you want to make sure you have a single copy of the query and sometimes you're going to not project it and other times you will, this allows you to have one and only one definition to maintain. That may or may not be worth it. Like I said, here it's questionable. Down here it's probably a good idea. Okay. Excellent. Let's just make sure it still works. Sure enough, we found FastAPI with the same last updated date, still the same performance. Let's go switch that back one more time just to see what the meaning is the effect is. Here we go. Still back to 300. So roughly three to four times faster by doing that projection. It's also worth noting that what we're doing is we're exchanging data with a local loopback MongoDB server. If we were talking to a production version, probably MongoDB would be somewhere across the network. So having extra data or less data go across the network will matter more. And if you're doing some kind of distributed thing, or you're talking far away to some cloud service, that that's where MongoDB lives, it's only going to be more true. So this is this dev scenario, this has the least effect that it probably would in production, or some other production like scenario, this would probably have a bigger effect still because the network would get involved in that.
|
|
|
transcript
|
1:11 |
Just reviewing projections as a concept in Beanie, remember what we do is we create a class. Here we have package top level only view, and it does not derive from the document-based class because you can't do additional queries, you can't insert into the database, none of those things. Kind of like a view into the data. And so the way we accomplish that is we just derive from a pedantic base model itself. We put in the variables or the fields that we're interested in and then don't forget this, if you forget this, you'll come up with none for all those values, which is not ideal, that you create that inner settings class and you do this projection where you have a dollar and then the MongoDB in the database name and then the field name that you want that to map over to. Then to use it, we just have our regular query and then on the end here, we just tack on a dot project. So here Or if we wanted to find all the most recently updated packages by some count, we're using five in our demo, but we just want the summary information, well, it would sure make a lot of sense to say, project just that summary information as we saw.
|
|
|
transcript
|
3:52 |
Let's chat about document design just one more time and focus in on a few issues. We did talk about this when we talked about modeling and I said, ""Hey, it's important for performance to get this right. But now that you see sometimes you want to project in or out certain pieces of data, you want to have an index that traverses this hierarchy in this way to ask those questions, you might think about document design with some fresh eyes. So let's look at what we've done here. We have our package and our package has a list of embedded objects that are releases. We saw that we can be insanely fast about querying those 0.1 millisecond to find to sort through quarter million releases interspersed over 5000 documents. So on one hand that tells you, oh, we're not actually suffering hardly at all from a response perspective in terms of querying. So when you think about this, that is not the issue, although it might've seemed like it would have been. The issue is when I pull back a package, if there are a lot of releases, I'm gonna be taking all that data with me by default. So you need to ask again, how often do you need these? I put them embedded here, so we just had some really good examples for this course. I'm right on the fence of whether this is a good idea or not, it may be, it probably is, but maybe not. For example, by embedding it, we have to have that second analytics field that we gotta keep in sync, which is a little sketchy. It's not terrible, but as long as you don't do it too much, but it is a consequence of this, right? So for those reasons, it's probably a good idea, but maybe, maybe not. We were able to use projections to avoid worrying about it when we didn't need that data. Again, how many releases are possible? Is this a set of 10 or a set of 10,000 embedded objects? That's also, the more there are, the less likely you want to embed all of them, especially if it's gonna go past that 16 megabyte limit per document. So should these be in a separate collection? Additionally, we also have the maintainer IDs, which is the IDs of the user who maintain the package. Now, you never, never is a strong word, you almost never, ever, I have never, ever seen a normalization many-to-many relationship table. So like a package underscore to underscore users table that just has the package name and the username, the user ID, never, never seen that you don't need it in a document database. In this case, what we decided was inside the package, we're going to put the ID which is a small bit of data, not huge, the ID of every maintainer, and there won't be that many maintainers of a package, it won't grow dramatically. So this should be totally fine in terms of the scenarios below. The one question you might ask is, does this belong on the package? Or does it belong on the user? Right on the user, we could say, okay, the user has a list of maintained packages as a list of strings. And then we could go and anytime we show a package, we could say query the user table, this ID is in the users maintained packages list, right? That would give us back a list of users. So either way you go, we decided as much as we need to release this, we probably want to have the information about the users who maintain it as well. So I put it on the package, not the user side, but it could go on either side of that many to many relationship. Right, there it is. So again, thinking about document design is more about the data transfer and the type of queries you can answer, not so much about the query speed as we saw with releases we can still ask super fast questions about.
|
|
|
|
54:17 |
|
|
transcript
|
1:14 |
So you built your app, it's working great on your local machine. Now you want to share it with the world. If it's a web app, that means deploying it to a server where it's going to be also talking to a production MongoDB database or database cluster, depending on how you set this up. In this chapter, we're going to talk about actually working through the steps to deploy and connect to a cloud-based MongoDB. We're gonna go to a cloud provider and we're gonna set up a virtual machine, one for the database and one for the web app. We're gonna take a simplified view and not really worry too much about the web app deployment side of things. It's outside the scope. But we're gonna simulate a web app talking to our MongoDB in a safe and secure way. So I think it's gonna be really valuable. I'll also show you some no effort cloud hosting options that you might actually choose instead. We'll talk about those trade-offs. But in this chapter, we're gonna see how you run and maintain and manage a production level MongoDB database. MongoDB database.
|
|
|
transcript
|
2:08 |
To set the stage for deploying and securing our MongoDB server, let me just give you a little bit of a warning. Now, this is clearly not meant to dissuade you. I'm a huge MongoDB fan. I've been using it in production for a long time. It's awesome. But you can set it up wrong, just like working with S3. You've heard about all sorts of problems people have had by turning off some of the access controls and things there. Similarly, if you don't go through the steps correctly, there's big problems. But if you do, awesome. So here's a few ways where work of MongoDB can go a little bit wrong. Here's an article, it's a little bit older from 2017. I think that's relevant. MongoDB has made a lot of the defaults better, but MongoDB database systems are being hacked for ransom using ransomware something or other. Here's another one, MongoDB ransomware compromises double in a single day. You can see right here that it says, your database is backed up on our servers. Send one Bitcoin to this address. Probably it's not backed up, probably it's just deleted, but you never know, right? Terrible. Massive ransomware attack takes out 27,000 MongoDB servers. These are not ideal, right? All from 2017. Here's another. Two million recordings of families imperiled by cloud connective toys, crappy MongoDB. And by crappy, what they mean is no username, no password. That's true for all of these. This is not some kind of security vulnerability in MongoDB. Definitely not. This is just people putting MongoDB on the public internet with no access control whatsoever. And if you can find the port, then you just connect to it with Studio 3T Free or Mongo Shell or whatever you wanna connect to it with and you have full admin access to it. Terrible ideas, don't do that. So in the next few videos, we're going to talk about how to not do this, but to put our MongoDB up in a very secure and proper way. It's not hard, it just takes a little bit of knowledge, hence this chapter.
|
|
|
transcript
|
2:04 |
One of the best ways that you can secure your MongoDB, put it on the internet in a safe way, is to not do it yourself. So I want to encourage you, especially if you're really new to MongoDB, to maybe consider one of the database as a service options. If you're working on AWS, Azure, or Google Cloud, then MongoDB themselves have a pretty cool system called Atlas. Atlas, basically you give them your access to your cloud setup, and they will create the virtual machines, they will install and maintain and upgrade and patch MongoDB, as well as run them in a replica set, and all of those things automatically for you. You still pay for those cloud machines, but they take care of it. Another one is there's other services that are not just MongoDB, and not the big three of the cloud providers. For example, if you're on DigitalOcean, then you can connect to their MongoDB managed server, starting at $15 a month, and they will completely run and manage it just like I sort of described for Atlas, but maybe even in a bigger scale because they're doing it for all of their customers, not just managing a few servers for you behind the scenes. So either of these two options, as well as others, really good. Really good. So you might consider this if you think this is a better fit for you, then you don't have to worry about maintaining and patching and running servers. But if you're already running a bunch of servers, and you do want to do it, well, that's what the rest of this chapter is about. So if you want to go down this path, that's awesome. You could even skip the rest of this chapter. For the most part, we do need to make a minor change to our code to talk to any external server that's It's not just local host. But beyond that, if you want to go with one of these, you can, you're welcome to just like jump ahead. But if you want to see how to host it yourself, and how to do that safely, then you know, keep watching this chapter, we're going to dive into that.
|
|
|
transcript
|
2:11 |
MongoDB has put together a security checklist. If you are hosting MongoDB yourself or for your company, either this is internally in your data center or maybe even more importantly, on the cloud, you might set up a virtual network in the cloud and somehow it's gonna be part of that there. So here's the checklist. Limit network exposure. So people should not be able to connect directly to the server, period. There's really no reason for this. You might say, ""Michael, we need backups. We need these other things. We need to be able to admin them. Yes, I mean, maybe SSH access to that particular server with just a certificate, that's needed, yes. But I mean, directly connecting to the MongoDB server over the internet, probably never is the right answer. Certainly that's the way we run things at Talk Python. You want to enable access control and enforce authentication. These two things are what went wrong in all those examples I showed you. They were publicly open on the internet to the world and they had no login credentials required whatsoever. That sounds bad, doesn't it? It is. Encrypt communication. Obviously, if you're sending like a connection string with a username and password, you don't wanna do that in the open because well, then not so great. If you have very sensitive data, you could consider at rest encryption. I do not believe the community version supports this, but maybe some of the paid versions of MongoDB do. You can audit system activity. That doesn't help you prevent data loss or anything, but it will at least let you know what happened. So if there's some kind of ongoing incident, you'll know that. Backup, backup, backup, backup, backup, all the time, backup, make sure you're taking backups. Something could go wrong with your server. You could lose access to the account that runs it. You never know, right? Just backups are always important. So don't forget that backups. Give a big long write-up here about admin security checklist. You can see it at the URL at the bottom. Go check that out if that's relevant to you.
|
|
|
transcript
|
3:12 |
Now to set up our MongoDB server, well, I had to create a server, right? So I actually went to DigitalOcean and created a $20 Ubuntu server that we can use. Now, you might need something a lot less. This is honestly pretty high end, but we're gonna do load testing later and I wanna give you a sense of what you can get out of like a reasonably powerful, but not insanely powerful computer. Also, I took the IP address that they told me my server was created at and I said I went to my hosts file. So on Windows, that's system32/hosts, I believe. And then on macOS and Linux, it's just /etc/hosts. And I put in this IP address, I gave it a name, mongo-course-server. So let's connect to that. It says, ""Is this your first time connecting? You wanna do that? Yes, it connects. you can notice that it comes out of the box fairly insecure. There's 104 security updates. So yikes, yikes, yikes. The first thing to do is notice we're running as root. So because of that, we don't need to type sudo. So we can say apt update. See if there's any more issues. Nope. And we can say apt upgrade. So first thing, as soon as it's on, you wanna just get it patched up and make sure it's the latest. With all those changes, there's a really good chance that it's gonna need an update, a reboot. So let's, you can disconnect and reconnect, and you can see system restart required, so nothing's running here. We'll just give it a quick reboot. Maybe give it, normally it's really quick, but with all the changes it has to apply, maybe give it 20 seconds, and we'll try to connect to it again. Not yet. Not yet. Here we go. And we're back. Zero updates. Excellent. I want to do one more thing. I noticed that this terminal, that this prompt shell here is bash. I really don't like the way bash remembers the history and lets you kind of go back and forth between some of your commands. So I'm going to apt install zsh on our way to install ohmyzsh. Certainly something you don't have to do, but it is just nice. but it is just nicer in my opinion. So the next thing we're gonna do is run the install command from ohmyzsh. Now, all of these commands here, don't worry about them. Don't try to copy them down or anything. I'm giving them to you in a file that you'll see in just a minute, but let's just get the server safely running on the internet here. So now we have this new shell and why do I like it? So you can type things just like part of a command and just arrow through the history and it's just nicer. So our server is now running on ohmyzsh and we're about ready to go. The next thing we're going to do is actually set up the MongoDB details.
|
|
|
transcript
|
5:36 |
In order to get MongoDB set up, we're going to need to run a bunch of commands. So I'm going to put those into a certain part of our project here. We'll also need a couple of configuration files. So while there won't really be much code here, we're going to go ahead and make another chapter. Chapter 11 deployment, let's say. I'll go ahead and mark that as a source as root, unmark that as a source as root, and I'm going to paste a couple files. We have our MongoDB config, which we'll talk about in a minute, and those steps that I told you, this is the first step for the server, this we don't really need. We're going to have those steps, that's installing, optionally installing ZSH and OMIZshell, And then we're going to start working on protecting the server. So the next thing that we want to do is we want to make sure that there's no way to talk to the server at all. We're going to use something called the uncomplicated firewall because it's uncomplicated. So let's go back to our server and we're going to run uncomplicated firewall, deny any connections. You got to be really careful here. We do want this thing to be able to talk outbound. So we're going to allow going and the most important, not the most, one of the very most important things is if we're going to block all incoming connections, we still need to be able to admin the server over SSH. So we're going to say allow SSH. Okay, so we can, we should still be able to access it. Now, none of this is actually yet applied, because we have not enabled it. So we have w enable, it says you may be breaking the system, especially if you did not have this, you may never ever come back, we'll be fine. And let's just double check by disconnecting. Reconnecting. Alright, everything is good. We can get into here, but only from SSH, nothing else. Now, the final thing we need to configure in our uncomplicated firewall is what inbound requests we're going to allow into the server. We have two options. We could whitelist the allowed incoming connections and say we're only going to let connections come to. You can see down here I have these two servers. This is me just testing before, but these are the ones we're going to be working with. We have this web app, which is that IP address, and we have our MongoDB server, which is this one. So one option is to say we only allow connections from this IP address. It could be the public one or ideally, whenever we create a set of resources or servers over on DigitalOcean we have a virtual private network, a VPC. So those are already protected IP addresses, right? They only make sense to things within that network. So we could work with a public IP address, but ideally let's just work with our virtual private network here, in which case this would be the one. We technically, if we had a more complicated setup, we could say allow anything to connect to the server, but only allow the server to exist publicly on the virtual network. So there's some options here that we could choose. Going back here, that's what this thing says. Only use from any to any port here if MongoDB is only listening on a virtual IP address. Alternatively, we could put this here like this for this specific example. And let's say, what port do we want to listen on? That's probably a decent port. So we also want to listen on not the default port. The default is 27017. One of the things people do when they're scanning for vulnerable MongoDB servers is go to every IP address they can find or guess and try to connect to that, you know, that IP address, that port. So by using a different port, it's not like a super secure type of thing, but it just is one more step that doesn't advertise and scream to the world, ""Here's my MongoDB server, come try to talk to it. So we're going to use that here, in which case that's the MongoDB server port there. I'm going to put any, but I want to triply underline this only works, this is only good enough if this is going to be inside the virtual network. If MongoDB is only available in the virtual network. I'll show you how to do that in a little bit. So last thing to do, we want to run this. So far we don't have MongoDB installed yet and we haven't told it where it is publicly available or open on the network. So no big deal, there's no rush to do anything about that. But this is the final step for configuring that firewall. Alright, so everything looks set here, we have a limit network access. That's a really important thing. It's one of the very, very first thing that MongoDB suggests. So we're good to go.
|
|
|
transcript
|
1:18 |
The next big thing to do on the checklist is to encrypt communications. So we're going to go to our SSL folder on the server. CD etc/SSL. And we're going to create a self-signed certificate. That's going to be good. You know, this doesn't need to be that short. Make this 10 years. You can make it however long you want, but you better remember to update it if you set a short number there. It's going to be a problem. So I'm going to make that good for 10 years and it's a new 2048-bit certificate that we can use. Put in something that makes sense here. It doesn't really matter. So now you can see we have these two keys. We're going to combine them into one with this. We can see we have the private key and the certificate. Excellent, MongoDB is going to need that. Perfect, so we have this key setting here. We don't, until we install Mongo, we can't actually plug it in. We'll do that in just a moment. But you're gonna need to have the certificate and the key here, so that part is done.
|
|
|
transcript
|
3:44 |
Now we're ready to install and run MongoDB on that server. You can see the guide is right here. Make sure you go back and double check because, for example, if there's a server version 7 for the main version number, you'll want to update this. So these change just a little bit depending on what version of Linux you're running as well as what version of MongoDB is out. So we'll go back home. Then we're going to set up a key ring here, so that when we do apt update apt install, MongoDB's details can be found. Carrying on with that here. Again, don't try to copy these, just get them straight out of the list. So we're going to say go refresh your app details based on these new servers that you know about now. Perfect. So now we should be able to say apt install, yes, don't ask, mongodb.org. In mongodb.org, the package actually represents the server, the database tools, the shell. It's like a meta package for other things. So let's go and do that. You can see all the stuff up here that it is a meta package for. Excellent. It also added a MongoDB user, so it's not running as a root or anything like that. Thank you, MongoDB. So let's try to start it first. Enable means it's going to auto start. Every time the server starts, you're just going to reboot. If you reboot, it'll automatically come back. good so you don't have to maintain or completely babysit the server. Start will start it. Also stop if you want to stop. Let's go with this one first. Looks like it started. If there was an error you would see it but we can ask how it's doing here. And sure enough it is running. This is its log file. That all looks good. Another tool that's nice to have is we can install something called Glances. So do we have pip 3 here? No. Maybe we can install it with apt. apt install glances. That's going to add a little bit to our server, but you know I'm going to do it because glances is a fantastic tool. We'll want to use it later. Glances is like top if you're familiar with that, or like a process manager, task manager type thing, activity monitor. Take your OS. But this is really, really nice because it runs in the shell and it gives us tons of excellent information. Well, it was a big update, but let's type ""glances"" and see what happens. Excellent. If we make it a little wider, you can see even more. You get a cool little, sort of, not quite progress bar, but graph over here of how it's doing. And most importantly, you can see MongoDB is here. And if you hit M, it'll sort by memory. If you hit C, it'll sort by CPU. but we'll sort by memory and you can see that MongoDB is hanging out here. Not using too much, but as we do more work with it, it'll probably use a little more. Anyway, we'll be able to monitor what's going on with MongoDB and other things, as well as how healthy is the server. It's green because it's only using 20% of its two gigs that I gave it. All those kinds of things. So this I think is worth having. It's up to you. You can see it did require basically installing all of Python and a bunch of other things on the server. So it's worth it for me. If it's worth it for you, that's, that's cool as well.
|
|
|
transcript
|
4:40 |
Now that we have MongoDB set up, we need to configure it. So let's go back to the server. I can't remember if we actually set enable MongoDB. No, it looks like we didn't. So make sure you also do the enable or this thing won't start over. Okay, it won't start again if you restart the server. So now the instructions say C settings for etc/mongoconf. slash Mongo conf. That means this file over here. So when we did apt install MongoDB dash org, we got file not folder over here, it created this with a bunch of defaults. So you can see this is where the log file goes. But look, it's on port 27017. And we said we don't want that. But this is one of the really big changes they made, I guess probably around 2017 that is really nice. It said, by default, do not listen on the public internet. It's just localhost, nothing else. So no one can get to this server from the outside. And this is where we go back to our virtual private network. Remember, I said, what we're gonna do is only let it be visible on the network. How do we do that? Well, here's its VPC IP address. If I want it public on the internet, I could say, listen on that address. then I'd have to go back to my uncomplicated firewall and be real careful about what I let actually get through on that IP address. But here, long as you trust this virtual network, which is the heart of our data center basically, this should be a pretty safe option to let it listen here. So we're gonna change that. And let's go back. And we're gonna change it to the port as well. So we said 5621. Okay, that's pretty good. We also want to require SSL, but let's hold off just a minute on that. The time zone is good. Authorization, we're also going to hold off on that because we have to first connect to it and create a user. But let's just see that this is working here. I'll go ahead and copy this storage part over. Oops, if I remember the R. Just to be super explicit about this part. Those are mostly defaults, but I just want to be clear. Okay, so here's the data folders, /var/lib. Here's the log files, /var/log/mongodb. if you need to get to either of those. All right, let's write that out and we should be able to exit. And then we had sys, remember I had you install all my Z shell because if we just hit up arrow, beautiful. Those are all the, those settings, right? So we want to, let's try restart and then we can run status. Perfect, still listening. Let's just try to connect to it to make sure that we still can. So mongosh, mongoshel. This should time out, it said error, because look what it tried to connect to. This right here, default address. So let's go ahead and try to connect with the port of 5621. Again, it's using the wrong host. So we'll say host, and we wanna use our IP address. Yeah, we're already on the server, but this is the one it's listening on, right? Here we go. Excellent, excellent. So it gives us some warning like, access control is not enabled. Yes, we know we're gonna come back. I'm gonna go ahead and just disable telemetry for this 'cause I don't care about it. This is not a real system, is it? Okay, so things are looking good. Well, let me just connect one more time. All right, it still has a couple of warnings, but we're going to disregard those for the minute. Notice we're running 606 for the MongoDB version. Here's our Mongo shell version. Here's the connection string that the shell used to connect when we gave it those command line arguments. And this thing is nowhere near ready for putting in production. We need to go back and turn on SSL and all those things. But this part of getting it installed, get it set up, get it listing on a different IP address and a different port. That's all good. Looks like we have it working here.
|
|
|
transcript
|
4:40 |
So we got our settings sent. We were able to test connecting to the server. We haven't turned on SSL yet, so we're gonna come back and do that in a second. Here, we're gonna need that command when we do. But the thing we wanna do now is create a turn-on authentication. And so in order to turn on authentication, we have to have a user. The way we do that is, when I say use admin, and we run this long command, which we will run over here. So back to the server. Right now we're just on this test DB, but we'll say use admin. Notice the prompt changed there. Then I'm gonna go back, change the username and password. These are meant to be placeholders. So I'll call this HiPI DBA or database user. And this one, I have a command I can run here that'll just create some UUID and copy it to the clipboard. So we'll make that the password. So we have a user, great. How do we turn it on? We have to go back to that config file that we were messing with before. We're gonna run nano, just remember hit N, up arrow. It's glorious. Down here. We wanna go to the security section and say enabled. So security, enabled. Great. And while we're here, let's go ahead and do our SSH, our SSL certificate rather. So we'll copy this section over. It's under the, oops, it's under the net section. All right there. We have SSL, require SSL, and then this is the one that we generated in the script we just talked about. about it. Okay, write that. Don't forget to restart Mongo. No errors. That's a good deal. Check out the status. Yep, still running. So the final thing to do is let's try that Mongo connection again. Trying to connect and it should fail. Nope, that sure didn't work. And that's because we're not telling it it's allowed to use --TLS, which is SSL. We try this, it should still not work. Looks like it's not going to because we need to tell it that the SSL certificate or the TLS certificate is not a globally trusted one like you might set up for your website through Let's Encrypt or SSL.com. We just made it ourself but as long as we trust ourselves it's fine. Okay, so now it connected. Fantastic. Let's see what we can do. Show DBs. Nope, that requires authentication. Use admin. Show collections. Nope, that requires authentication. So you can't really do anything. It might look like we did something here. This use admin, but it just changes when you issue commands like DB dot whatever, what it will be directed that it didn't actually talk to the server to do that. Okay, so yep, can't really do anything and we have to have access over SSL. Perfect. So the final thing to do is exit back into the shell and run this command. It is now a four, I believe. With the port, the user is pypi-database, a user and that password is the UUID I created, which is this. And the authentication database is admin. Woo! We're in and it's starting to tell us stuff again. And that looks good. So what can we do? We could say, use admin, show collections. Perfect, looks like it works. So we've got our SSL, our encrypt communication, and our use authentication and require authentication to do things. Like for example, interact with the database in any way. So here's the great long command again, you're gonna need to change that to be whatever you actually have on your server you set up here, and as well as the username and password if you don't use exactly what I did. Then you should be up and running.
|
|
|
transcript
|
5:43 |
The next thing we need to do is just make sure that we can actually have Python talk to our production database. So that's going to take two steps. First of all, we need to change how we connect to MongoDB. Remember over here we have our Mongo setup, which is fantastic. Never mind this. It's just if I set that as the source root, it'll be okay again. Over here, we're just passing in the database name. And it's a local host. And it's this. And there's no more details. details. Well, we saw that that is not going to fly any longer, is it? No. We need to make sure that we're using the other port and the other server name as well as passing over the actual username and password for the database server. All of those things need to be updated in order for this to work. So we're going to do that, but we also need to get the code moved over so that we can do something on the server. So instead of changing what I've done previously. Let's go ahead and just make a copy of that and unmark it. And I'll make a a new folder here called PyPI app or something like that. And we'll paste all those things from chapter 10 right into there. And then we're going to go and update our infrastructure to allow us to talk to the server. So in this case, this is what this app is supposed to consider as a cohesive whole. We're going to take that and mark it as a source's root. Excellent. Now there's some warning from PyCharm here, but let's just run this. I don't think this is any sort of problem. And sure enough, it's not. We can ask for a summary locally. It looks like it's working here. Now for this to work, we have to pass in a lot more information. So let's go and work on this here. Now first I'm going to make a function that allows us to create a slightly more complicated and interesting connection string. So I'm going to actually go over here and say extract method, create connection string like that. And then I'm going to go ahead and replace this with something more involved and we'll talk through it. Okay, so instead of having just the database name, which we still have, we now have the server that defaults to localhost. So we can use it in a simple form. But if you need to pass it, say in production, that'll override it. Same thing for the port, we need to pass the username and the password. Again, they have defaults, so you don't have to pass them. But in production, you'll need to have a use SSL. Because on development, you don't production you do. And I guess we don't really need this. The next thing we're doing is for some reason if they pass in empty string or none for the server, go ahead and just throw that back to localhost. Again, same thing here, right? And then I have this function I called motor_init. And let's put that down here. It's a little bit more involved again. So it's, what it's going to do, it's going to be createConnectionString. What it's going to do is take the database, all that information, create the connection string, which we're going to have to upgrade as well. It'll print out a little bit about how it's initialized. It's going to use motor, which is actually motor async. Like that. And just like before, it's going to pass all that stuff off. It's going to pass all that stuff off to Beanie using the motor client that we got from no longer a simple connection string, but a quite complicated one. And it looks like this models was conflicting with that right there, so we'll change that. Okay, the last thing to do is we need to create a much more interesting connection string. Let's go over here and paste all that in, like this. And so the idea is if you're passing in the username and password, you're doing all the things. You're also passing in a special port, a server. We're going to have this nice complicated connection string, MongoDB slash slash for the scheme, username colon password at server colon port. Our source is this TLS, whether or not we're specifying it. And this insecure, this means use our self-created certificate. So that's what we do in production, But in development, we're just going localhost and port and so on, very simple stuff. So we don't have to worry about configuring the dev system to be really complicated, but we do for production. All right, so all of these things here are working great. What is this about? Okay, no need to make that async, so that error goes away. All right, looks like we now have way more interesting setup, isn't it? So hopefully, I didn't want to hit you all with this in the beginning, right? Because this, it can seem like overwhelming what's going on here, right? It doesn't have to be but now you know all the stuff we got to do to connect the server find the server, use certificates and passwords. You can see where this all comes from. So hopefully you appreciated waiting until the end to see this. But here we are, We should be able to run this code on a server inside that virtual network and do database things. That'll be cool, right?
|
|
|
transcript
|
3:06 |
We want some data in our production MongoDB, right? And we already talked about how to install the data, import the data into the server. And over on the GitHub repo, we have these steps here. Well, the exact same thing applies for our data on the server. So let's go copy that URL there and go over to our server. Now, in order to get the data downloaded, don't have a web browser so we're going to do a wget this and see it downloaded it and let's call that .zip and there it is. We want to unzip. We don't have unzip do we? apt install unzip and while we're here just for symmetry let's do that one as well. Excellent. again. Oh, look, it works. So here we have all of our files. Now in order to restore this, we need to run this Mongo restore --drop command. But because our pass our server requires username and password and SSL, the command is not so simple. So what we're going to do is we're going to say Mongo restore --drop --DB this slash local directory, the directory we're in, but we're going to specify the connection string, pi pi database user, password host port, SSL, use SSL or TLS and allow self signed certificates. All right, let's give it a shot. And of course, that's going to need to be in quotes to escape it out of the shell. Try again. Here we go. Awesome. So let's do our Mongo shell again. And just make sure that we have data here. Use, well, first of all, let's show DBs. Oh, PyPI is there. pi pi show collections. Excellent. Let's say db dot packages. Let's do a users, something a little shorter users dot find limit one. Pretty. They have it. Here's our to capture one that we saw before right at the top. Excellent. Our data is imported. Not the easiest thing to guess here because somewhere in between the options, these are the options, and the working directory we have to put the connection string now that it's not just localhost and 27017. Not hard, you just got to know how to do it. So here's the way that we restore the data into the production database server.
|
|
|
transcript
|
6:24 |
Now the final thing we would like to work on here is we want to be able to back up our Data somewhere off of the machine right like I guess it's great to back it up Privately on that single MongoDB server, but it's not super helpful So because if something goes wrong with the server probably the local backup will be messed up as well or at least inaccessible, right? the other thing is we would like to be able to use tools like studio 3t or robo3t or you name it to be able to actually talk to and manage our database. So that's a bit of a challenge. Let's pull this up again. What did I tell you, you do not want to make possible a new connection, I want to go put in the server name, like Mongo server, course, whatever we call it, it right. And we said the port was 5621 or whatever that was. I said you never ever want to be able to connect to this outside of that virtual private network. Well, how are you going to fix that? Do you want to put your computer inside that network? No. What we're instead instead we're going to do we're going to create an SSH tunnel. The one thing we can do to our MongoDB server is create an SSH connection. An SSH tunnel says we can create a way to you over once we set up an SSH connection, tell a local port that it actually flows through SSH over to the server. It's slow, but for admin stuff, it's totally fine. So that's how we're going to connect to it. We're going to create one of these SSH connections. There's a little bit of a shortcut we can use here, we can give it a connection string. And down here, we happen to have a great long connection string that we can use. Now it doesn't import perfectly as we will see, but it's a good start. So we're gonna connect over here to this and the IP address is going to be localhost and the port is fine. 'Cause we're gonna use SSH as we'll see. So hit that, it says it's been auto-configured mostly. Let's give it a name, MongoDB production and I'll put course in here to not confuse it with other things. So localhost actually is where we're going to go to, but then the SSH is going to redirect us. So let's do that. Use a SSH tunnel, MongoDB core server. And this is the SSH port, which is right. Username is root. And then you need to set your private key. I'm going to browse over to mine and set that up. This test connection is for the whole setup, not just for the SSH tunnel. So hold off for a minute there. Over to SSL, use SSL, yes. But this is one of the things that did not get set up correctly. Actually, so actually that did get set up, didn't it? Okay, very nice. Authentication. This is our database auth, so username and password, admin, that was what we had. And finally, the server is localhost. This might work, let's test it. Yes, okay, it works. Save. Now in order for that to work, there's one minor change I actually had to make in the in the setup Because we're only listening on the server on this IP address Turns out that the way this tunnel was working when we tunneled the localhost It was it was not using the virtual IP It was using just localhost So over here I added instead of just this IP address in quotes with no spaces between the commas Localhost and this it doesn't change the security really because it just adds a local loop back But it was what was required to make this actually work. So now if we connect This we got our data and we go to the packages We do a find on them the data comes back a little slower, but because it's tunneling through SSH it still comes back Great, look at this. So now we can manage it this way. We can also use things like the Mongo dump. Over here we can export the entire collection or view. You can add more things, but Mongo Restore has an opposite operation called Mongo dump. Let's see if we can use that. And we're going to set up our own SSH tunnel like this. I'm going to say the -f to tunnel it and -fnl from here from the local one to that one over there. So it's just going to kick off in the background. All right, well, let's try that. CD desktop. And now we're going to use a Mongo dump command. I put that over here in MongoDB, --host, localhost, all of the commands we have here. And what we're gonna do is we're gonna take the database, PyPI, and put it into the output into the working directory. And also here's the command. Again, you're gonna have to change the server name to whatever you named yours. We're gonna dump this out here. You can see it's downloading over the SSH tunnel. And you can look right here and there's all the data backed up. Excellent. So we have the ability to use the Mongo tools using the SSH tunnel locally, as well as within studio three T we can use the SSH tunnel as well. All right. Pretty excellent. Pretty excellent. I'm not sure how that landed with you. If you've done a lot of things with Linux and the command line or the terminal, you should feel pretty comfortable. But I understand that sometimes that might be overwhelming. So again, decide, do you want to use some hosted service or do you want to create your own? Honestly, once you get it set up and running, as long as you make sure it stays patched and backed up, there's not a big deal, not a lot of work to running your own MongoDB server. Here's how you do it. It's up to you on how you want to deploy your code.
|
|
|
transcript
|
6:26 |
Very last thing, let's put it all together and make sure our web app or API or the thing that is a client in Python talking to the MongoDB server in production can actually talk to the MongoDB server. So remember, I created two servers, I created this one, this is the one we've been messing with. But I also added this Mongo course web app. And that is where this code here is destined for. So let's go over there and just get it set up real quick. So again, I changed my hosts file slash etc slash host to know that that goes to where its IP address is. And this thing is completely untouched. It's a brand new Ubuntu 2022 10. Other than just running the apt update apt upgrade to make sure it's not out of date, So what I want to do is somehow I want to get these files that we've been working on in GitHub over there. Well, Git is a pretty good way to do it. So we're just going to come over, copy this. So we'll just say Git clone this. Now for you, you don't need a username or password. It'll go right through because it's private until I release this course. I want to keep it basically hidden. A decent way to do that is make it private. I mean, what does that word mean, right? It means make it hidden. So keep it hidden. So I've got to put in my username and password here, but you won't need to do that, of course. There you go. It has cloned it. To a great long directory there. Let's see if we got Python on this machine. Hey, Python 3.10. That's pretty good. If you don't have it, you might have to apt install Python, but let's go into the code and we'll try to run this. It's not gonna go so great. Let's just run the CLI one. Oh, we haven't, first we're gonna have to create a virtual environment for it, aren't we? So we can have our things installed. Let's go back a little bit. I'll do it at the top here. Wait for requirements. Python 3-M. VENV, VENV to create our virtual environment. Oh, we need to install a little more. I think the reason we actually had Python is 'cause I installed Glances. So if you didn't install Glances, you have to install Python 3.10 and then this. Let's try again. Oh, no, it's still going. Try again. Then we got to activate it. Notice our prompt changes. And then we'll just Python, we'll say pip install -r requirements. That seemed to go well, so let's go into our code, chapter 11. Now here is the error I expected to fail. Can we talk to localhost on 27017? Nope. It's going to try for a while until it times out, and eventually we're going to get some kind of crash. So what is the problem? Well, in our production version, we need to go and make it run with a different connection. So let's do that. There's a bunch of different ways to do this. The part we want to see is in this startup here. In this init connection, this is going to have to get more interesting, isn't it? Where are we going to put this information? So I'll kind of simulate getting these values from the environment variables. You would not put your username and password and stuff directly in here in a real app just to keep it simple for you so you don't have to set up environment variables and all that. But just for the simple version, dev mode, let's call it dev mode is true or false. I'll say down here if dev mode, we're just going to do this. Otherwise, I'm going to do something way more complicated. Server I'm going to say server equals and remember this is in production, right? it knows about let's go to the network. It knows about this IP address here. So when we tell it the server, when and give it the server IP address, the port is 5621. All right, a lot to pass over, but it should work. So if I run it locally right now it's in dev mode. Looks like it works. And then let's just for production, we'll switch it over again. That'd be an environment variable along with all the other things or a command line flag or something. So we'll do a... I normally have been doing these git push details without you all watching, but I got to do it now to get it up to the server, right? So over here, you can see it crashed there once it finally timed out. All right, we're back. We should be able to have, if we show you dev mode is false, so we should be running this code here. Let's give it a try. Check it out. We got our initializing connection trace information and it's all set up. And look, it's working. It's working great. Let's just do a few more things on the server for the fun of it. Let's see the most recently used packages. We create a new user. All those things, right? Looks like we're talking to the database server perfectly. Excellent. So while this might not look like a big deal, and you're like, ""Oh, we're just passing this extra information over,"" just think about all the stuff that we've had to consider and put together to make this work. We had the database before, but we set up a server, we configured MongoDB securely to run on it, we put it on a non-default port, we gave it authentication, and we gave it encryption, and now all within that virtual network, they're talking to each other, looking
|
|
|
transcript
|
1:51 |
One final thing I want to just add here. I didn't highlight it before when I first ran this Remember, this is the speedy CLI that we're using So when you see these numbers like oh it took over a second to get the summary or if we say give us the most recently updated packages and that took 800 milliseconds Remember what we're doing here. This was a performance testing version where we're running these commands a hundred times each And then we're saying how long that took. So for example, for this one, that's 8.7 milliseconds in our production infrastructure to go from one server over the encrypted network to the other and back, right? So don't let these numbers here scare you. These are really pretty decent high-speed numbers for just a couple of milliseconds to do these different queries here. I guess just go and run the search one more time here really quick to get a package took that long, but again, divided by 101 millisecond. That was pretty awesome. If we go and ask for a certain version, that also took about one millisecond. That one searching remember quarter million packages interspersed embedded within 5000. Sorry, quarter million releases within 5000 packages. So it's, it's working great. It's super fast. Alright, that's it for the deployment. It takes a little bit of getting used to to put all these pieces together, but once you get it set up and you have a script to remind you these are the steps in this order, it's honestly pretty easy to do. So whether you do self-hosting or you do some kind of cloud as a service, a MongoDB as a service type thing, it's one of these two steps and it's not too hard. So have fun, good luck, and follow along. Be safe out there.
|
|
|
|
27:49 |
|
|
transcript
|
1:07 |
What an exciting time. We're almost done with this course and we've put a cool application together. We built a FastAPI to test and interact with our Beanie data using async Python to talk to MongoDB with all of our performance improvements and indexes and projections and those types of things. We've applied to it. How have we done? This chapter is going to be our report card. Our speedy CLI was maybe a early semester, first part of the year type of report card. This will be our final report card. What we're gonna do in this chapter is we're gonna take some full blown load testing tools that allow us to interact with our FastAPI in a way that will be similar to the way we might expect users to actually use the API. We'll be able to measure it really precisely and see just how much we can do and where things start to break apart, fall apart. So we're gonna build something really cool in this chapter. I hope you're excited. It's gonna be fun.
|
|
|
transcript
|
4:20 |
The tool I've chosen for us to do load testing and performance testing of our application and our data layer and our database is called Locust. 'Cause you swarm a bunch of things in and they all attack the application, right? And Locust is notable, not just because it's a cool load testing tool, but it is a Python first tool where we program it and interact with it and control it using Python in fantastic ways. It's a really fun tool and well put together. We're gonna get some good answers from it. It also has great graphs. Let's talk through a couple of scenarios. There's two ways to think about performance of our application. The first way might be a realistic way. Let's suppose, let's just say it's a web app or maybe they're interacting with this API through a mobile application. In that case, the user is not gonna be going, reload, reload, reload, reload, as hard as they can, as fast as their browser will let them do. What they're gonna do is they're gonna click, interact, that looks interesting, click. I wanna search for something, type, type, type, search. Right, there's delays and there's like a slowness. And the question is under like kind of normal usage, normal usage patterns, as best as we can predict, how many users can we actually support? So in this picture here, you can see it's just going up steady, steady. The important part really, for understanding how it builds up is the top and the bottom graph. In the bottom graph, you can see we're just linearly adding more users and more users. On the top, we're measuring requests per second. And when we're in a really scalable mode, as we add more users, it doesn't really affect the other users, right? As we add 20 users when there used to be 10, Well, you know, we'll do about twice as many requests per second, somehow related to the number of users, pretty linearly there. But at some point, the system is gonna get overwhelmed. And as it gets overwhelmed, as we add more and more users, instead of being able to do more requests, it's gonna just start to fall apart. And you can see that graph just curve off right where I put this dotted line around 765 requests per second, which is 5,100 users. So it was pretty stable there, after that, it's gone. And now, until recently in the middle graph, everything's been great until this sort of fall off. And then look at that, the median response time and 95% percentile response time just explode to like 20 seconds and just completely falls apart. So using this, we can understand how many users under a typical scenario we can handle, right? So you're like, all right, well, If we think we're only gonna ever have 2000 users concurrently interacting with the system, whatever scenario we have here, whatever infrastructure and hardware we have applied, plenty fine, no problem. On the other hand, you might look at it differently and just say, how many requests can we handle per second? We just wanna go as fast as we can, no delay, just more and more things clicking and refreshing as hard as they can. So in this case, we tried to apply that story and as we added just 75 users, they don't really represent users 'cause they're going completely crazy, but more like testing threads or in that regard, you can see that pretty quickly, we can ramp up to around 1000 requests a second, but no matter how many more requests we send at it, 1000 requests a second is really all we're able to tolerate. And once we get past this dotted line, Here we have a 35 millisecond response time, which seems awesome, but as you get much farther, things start to slow down, even though we're not doing more requests per second. So if you could say, well, I can't really conceptualize how many, how a user might use this system. The other metric you can look at is, well, just how many requests concurrently can we handle? Well, it looks like a thousand a second is a pretty good number for this system here. So these are the two perspectives you might want to take, and they both tell you interesting things. And with Locust, we can do both of those.
|
|
|
transcript
|
1:12 |
When you're doing these tests and asking these questions about your app, it's interesting and useful to do it on your dev machine. It's useful to do it just on your testing database setup. But if you want really, really good answers that you can apply predictions or make predictions from about how will your application actually handle. If we're going to run a huge ad or we have some kind of flash spike in traffic, because it's Black Friday or something like that, will your server be able to handle it? To do that, to answer that question, you really wanna run that on your production server topology. So in our example we set up, we had just the Mongo server and the regular web front-end server simulating type of server. Probably if we're gonna try to see how is our system gonna withhold all the traffic, we wanna test on that type of a setup. So go ahead and run it on your dev machine. It'll tell you lots of interesting things. If you make changes, is it better, is it worse? But if you want a really good answer, don't forget to run this on your actual server topology and hardware, just to make sure that it's as close of a fit as possible.
|
|
|
transcript
|
10:56 |
Working with Locust is pretty easy. Let's go ahead and make a final chapter folder here, chapter 12. And notice I still have chapter 11 hanging around and ready to run. So what we're gonna do is just run the code out of here, but then write the load testing code on the side. So I'm gonna add a new Python file called Locustfile.py. pi, not py. It doesn't technically have to be named this, but you can type less to start and control the tests if you do name it that. So let's call it that. Keep life simple, right? Okay. So in order to do this, it's a little bit class-based. We're going to have import locust, which we don't have. PyCharm will suggest we install it, but let's be a little more thorough here and put it like in here and I'll generate that requirements file for you. All right, looks like a bunch of stuff got updated. Also a whole bunch of things about Flask got installed. And Flask is used for Locust to show us real-time interactive reports as well as some of these green threads and G event stuff. So that is all good to go. So what we're gonna do is we're gonna create a class and we'll just call this API test. It's gonna drive from Locus HTTP user. Now, the way this works is we create a function and then we give it a name. And typically you wanna think about this as a scenario. So if we go back and we run that file, you can see it's ready to go up there. Remember, we were playing with the static files when we made the colors kind of insane. Well, let's not worry about that. But what we want to think about is there are four different ways that people can interact with our app here. One of them is to get the stats, right, this thing. The other is to get the recent packages. We could get details about the packages. This one turned out to be pretty intense 'cause in here we're returning everything. Now I said four, that looks like three. The fourth one is this page itself. So although this is not really interacting with the API, let's go ahead and bring this in. We'll see how this works in a minute. So we're gonna call this homepage. And the URL is gonna be just forward slash to make it obvious. Now the way we tell Locust what this is, we say @locust.task. And here we're going to say self.client.get. Now we don't want to put, you can see there's a bunch of options, we don't want to put the host actually in here because that might change. We tested in production, are we testing locally? So all that's left is slash. And what we can do, I'll put this off for just a minute, we can say host equals this. The other thing it wants us to set in here is we'll set the weight to one. Okay, we'll come back to that in a minute. So here's our homepage. And maybe that's not the only thing that users do. The users might also, coming back here, they might want to get the stats and say maybe the stats, so this will be slash API slash stats, maybe that will be kind of common. We'll say stats. And this is what goes here. What else might we have them do? Well, they're going to be surely looking for some recent packages, aren't they? And we'll just have them get five. And let's start with just these three here. So be just call these recent. Now nothing in this page, nothing in this file here tells you anything about what a typical user does. Does the user mostly visit the homepage and just rarely get the recent packages? Is this mostly what they're doing? And then I almost never come here. Also, how long, how quickly do they switch from task to task? Do they click around a lot? Are they thoughtful? Is there a lot of content that they need to interact with or not very much? Is it a game where every key movement is some kind of API call or is it a magazine? Right, so we're gonna come back to that. The takeaway here is what we built so far kind of that maximum request per second, not how many concurrent realistic users can we handle? How do we run it? A couple of ways we can do this, we could go to the terminal and CD into code, chapter 12. And here we could just say locust, I'll go ahead and do it just, we just run locust that might do it because the name of the file. So this running And look at this, if we click this, what do we get? Awesome, we get this locust file. It says how many peak users do we want? Let's say we wanna have 20 users and they come in at one per second. And here's the host, which we had to say, what was it? So here, let's come back. We put this in here now and we bail out. Make sure we hit save. And run it again. Refresh, notice it automatically loads that. Perfect. What do we want? 20 and one at a time. It is ready, there are zero users. And this importantly, over here is running, running this, so it's gonna be processing the request there. Not in debug mode, you don't want debug mode. Here we go, let's see what happens. All right, it looks like it's working. These are our different endpoints right now. The number of requests. This is useful, but what looks better are the charts. I'm gonna try to shrink these down so you can see them a little better. But look at it growing. You can see we're adding more and more users. Where are we? We're up to, pretty much up to the max. And at this point, we've got, you can see 20 users. How's the response time looking? So this is in milliseconds. The average response time is 33 milliseconds. Oh my gosh, that is awesome. And up at the top, we have 543 requests per second, zero failures, both of those are good numbers. You would see a red line growing up if there were failures. So, it's varying as you move around, but 500 requests per second, that's pretty good. You can also go up here real quick and look at my iStats menu, and keep in mind during this whole process, I'm using OBS to record the screen, to do green screening to cut my head out of whatever's behind me to just like have the minimal overlay of me, record the screen, do a bunch of color correction. There's a lot going on here. Okay, so it's really, really busy and that's gonna take a chomp out of what my computer can do. So PyCharm that represents running, PyCharm I think represents running both FastAPI and Locus, although Locus shouldn't be putting too much of a hurt on things. And then MongoDB is running about a thousand, a hundred. And if you're unfamiliar with the Mac percentages here, this chip is a M2 Pro, and I think it has 10 cores, eight or 10 cores, whatever it is, these numbers represent how much of one core. So a hundred percent CPU usage would be either 800% or a thousand percent, depending on whether it's eight or 10 cores. Yeah, I just checked, it's 10 cores. So this is 100% represents 10% of the total CPU. It's been running for a while, let's see how it's done. There was a weird blip here where it jumped up, what is this to, 43 milliseconds, not terrible. And those dropped probably when I was like messing with those tools and performance stuff, right? It all takes away from the system. But it looks more or less stable like with a little variation so what we're not seeing is we're not seeing it fall apart yet. So we can actually add more users to this run. Let's stop, we can start over and do new test. And it'll actually keep the same report, but I wanna start a new report. So I'll go back down here. We'll hit stop. I'll show you one way also that we can just put a thing you can run up in the top here, which is kind of cool. So let's go over here and say we're gonna run Python. So notice if we switch this to module, we can just say run locust and it doesn't take any parameters. You saw me just type it to tell it to go. What we need to do is just set the working directory to where the locust file is. Excellent. So let's go ahead and run it. Now notice we can just press this. You can see we have that running. We also want to have our main running. They can both run at the same time in PyCharm. Excellent. So here we have main and we have locust running. So if you want, you can control it up here, not just the CLI, it's up to you. Let's go back and say this time, that was good, but let's go to 100 and we'll add 'em a little quicker just so we don't have to wait for you all, and we'll do like that. Go to 100, add 'em two at a time every second. Switching over to the chart. You can see we're adding the users. I'll go ahead and zoom that back. Just look, the users are right here, 28, 32. Now notice something, as we're adding more and more users, we're not really improving, are we? So we kind of guessed, and it was a pure guess, pretty good guess around 20 users that that was the max. make any sense for this setup running right here, because just about there, that was our peak, right? That was 28 users and 550 requests per second. And we're still handling it, but notice the response time, the scalability starting to fall down. It's like 170 millisecond response time. Not horrible, but it is worth considering that the service starts to degrade pretty hard around, what is that, around 48 users and it, if you're just thinking request per second, that's really what you should be doing here. 550, 547 is really the number that we're kind of at the peak here.
|
|
|
transcript
|
9:05 |
Okay, so 500 requests per second, roughly, is what we can do. But that's not really how you wanna think about it most of the time. Most of the time, a good mental model is just, how many users can we handle? I would say, think about the max request per second is, if I make this change to an index, or if I change a projection, did it get faster or slower? Can it handle more load or less? That's really useful. But when you wanna think of capacity planning, you wanna think about how many users can concurrently be on the site or using the app that consumes the API or whatever it is consuming the API. How many of those things can you handle at a time? 'Cause that's what you can kind of think about. All right, we have, the other day we had a spike and there were 500 users on the site at the same time. Should it be able to handle that? I don't know. So in this section, we're gonna add another thing up here, which is gonna be wait time. And wait time tells you how frequently a user moves from one API endpoint to another, interacts with this part of your site and then the other. So this will be a locust.between, and what you give it is let's say, if they're really cruising around fast, it's five seconds, but a lot of times it might be up to 30 seconds that they're waiting to interact, right? They're reading a page or they're studying something like, oh yeah, I gotta go click the next button to get to that thing. So this tells you how active each user is, right? Gives you a realistic view of that instead of click, click, click, click, click, click, right? That's not realistic. The other thing is, do they do these things the same? Probably not. Let's say going to the homepage is not common. Okay, that's not really testing very much anyway because that's just FastAPI returning static HTML, right? Let's say that they get the stats five times as often as the first page, and they get the most recent packages, they do that maybe 12 times, maybe more even 15 times. So it's a rarely, somewhat often, really often. And it just happens to be going, increasing down, right? It doesn't matter. Like you just pick these scenarios seem to happen in ratio more likely. Now this one happens three times as often as that one happens. So we've done two things. You could have done this in the max request per second as well. You could have used these weights, but it's like, it makes a little more sense in this, but it also does there. So we're gonna do the same kind of test, but we're gonna try to answer the question of how many concurrent users in a realistic scenario, both from how frequently they interact with the site and what kinds of things they typically do more often or less often. All right, let's run it again. So, well, also it's a good plan to shut down, completely exit all the code, everything, shut down your FastAPI, API, and start it back up because it might've built up some cruft in memory, it might have cached something. There's like a lot of weirdness going on. And if you're testing it, like we're pushing it to the breaking point. So it could have those overwhelmed memory cache, whatever stuff just going on. So just start it over. So run the FastAPI, good. Run a locus. Again, you could do it from the command line if you prefer. And then let's go. So in this scenario, we're expecting to have more users than 20 or 50 or 100. Let's say we think we could probably handle 500 users. And just for the sake of, I would add this slowly, but just because we don't want to watch it too slow. Let's just go and we'll say we're gonna add five at a time. Let's go over to the charts. Notice you see up here, the number of users. So as we're adding them, we're not getting that many requests per second. That's not because stuff is not working. It's because it's five to 30 seconds per user. So they're just chilling, right? Let's zoom out a little bit here. You can see the response time. Excellent, 30 millisecond response time. They should be happy with that. Users are used to terrible websites. It takes three or four seconds. Got to check, is the spinner spinning? Yeah, okay, we're still waiting. So 27 milliseconds should make them happy. So we're still adding users. the, as things get kind of smoothed in in Python, right? It's really, really efficient here. Up at the top, request per second. Again, you can see them up here. It's going up. We're gonna need to add more users. We're definitely gonna need to add more users and do it faster. We can actually do that while it's going here. We can say, let's go to 1,000 and we'll add them 10 at a time. And notice the rate at which they're going up is faster. So is the endpoint. So this is great, we're still doing requests per second. It might've looked like before when we did our tests, it was like, whoa, 500 is all we can handle. Well, 500, as hard as they can refresh, but notice with this scenario that we planned out here, and you can say how real or unrealistic it is, but we're getting zero impact from having right now 700 users. We're gonna go up to a thousand. So let's see if we can do this up to 5,000 and 50 at a time, just keep going. All right, now we're starting to get more of them in here, but I think this is just a little blip. I don't think it'll affect, this doesn't look too bad. The average is still in the 50s. The top, even though it looks high, is still 190. kind of coming to terms with more connections. Up here, more and more requests per second, 130. Had any more users we had up to here, then we doubled it and then we made it quite a bit higher. So look at this, we're still going great. I'll edit again, put it 10,000 and put it 100 at a time just because I don't want to normally you would just let it go but right we're recording you don't want to watch this go super slow. But let's keep adding. Now again, this is not the full, not the full infrastructure of what we would have in place. As we're getting more and more users connecting, they're all connecting to the uvicorn server, which that would not be how it actually works. They would connect to Nginx, and Nginx would buffer all those connections up and then proxy them over to uvicorn. So not super realistic in here, but you can see, all right, this is where it's starting, starting to fall apart. And the requests per second are also kind of leveling off or going down. So let's say, we're starting to get some failures. I hit stop. Probably limit of number of connections to the server, the aspect that's not really supposed to handle. Let's look at these numbers. Those are not great. Right there. So right there, again, if we had Nginx and then MicroWSGI, we would do better, not sure how much better, but certainly better. What we got here is it looks like at 3,795, 3,800 users, it's kind of where it starts to fall apart. So it's pretty understandable to see like, okay, everything's just growing fine, and then it just hits a wall and it starts to get errors. And these slow down, like this is what it looks like when a website or a web application just is overloaded. It's just once it starts to go down, it, it gets worse, because as it slows down the request, even more requests queue up behind those right. So this is, this is our number, we can handle around 3800 users at the peak, the way it's currently set up with OBS recording on my machine, the database, and the web server and locus and OBS are all running concurrently. So this might not be the real number, but this is the number that we get under these constraints. Okay, pretty excellent, right? This gives us a ton of insight. And we did this by sketching out what a standard use case looks like. A standard use case is this franticness of a behavior, as well as this one, five, 15 split of uses across these. And if you really need to, you could have, here's a scenario where they click this page, then they log in, and then they go over to this other page, right? You can have these be not just one liners, right? But these can be complicated bits of code. I just made them simple for what we're doing. Okay, it's cool, right? Really cool stuff you can learn from Locust.
|
|
|
transcript
|
1:09 |
Now we want the absolute best performance out of our locus code because when you hit a limit It could be that some of that limit is locus itself as it's got thousands and thousands of things to manage it itself could be part of the slowness right and so locus comes with Not just the HTTP user, but the fast HTTP user this comes out of a locust contrib and so I don't know why this is not the default I don't know the history of the project, but for me, I would just make this be the default just always used fast HTTP user It's gonna use a slightly more efficient kind of an async I/O Equivalent behind the scenes to run it instead of spawning up many many threads which of course is the way you want it So locust and fast HTTP user, you saw when I installed it All I expressed here was locust. I didn't say locust and locust contrib and all that. So, should be good to go just by assuming that it's going to be there. It seems like it's coming as an automatic dependency and vendored in contrib thing.
|
|
|
|
8:24 |
|
|
transcript
|
0:42 |
Well, that's it. You've made it to the end of the course. I hope you really loved it. I think it's such a cool technology to be working with, many interesting pieces, and you made it here, so hopefully you can go build something awesome. You now know enough to build production-ready, production-grade applications based on MongoDB. So take the time, think about it, get excited, and decide what are you going to go build You can use a lot of the stuff from this course as a template or a skeleton. Feel free to copy the source code and use it as you need. And if you build something amazing, shoot me a note and let me know.
|
|
|
transcript
|
0:30 |
I'm sure that you've gotten it by now, but if for some reason you haven't cloned and downloaded all the source code for the course, here's the URL just once again. Go ahead and star it and even consider forking it so that you have a copy saved to your GitHub account. It's all here for you to use. Download it. Remember, create a virtual environment, pip install -r the requirements, and then just run the different parts of the code that we created throughout the course. Have fun checking it out.
|
|
|
transcript
|
6:11 |
Now finally, let's just look back on what we've talked about and what we've learned throughout this course and do a quick review. First thing we started talking about was document databases. These weird things that store hierarchical data, how do they work? Why would you use them and could they possibly ever be fast? So for example, out of our courses, we've got this green bit that looks like standard data in a database, but we also have this blue section of embedded lectures. It's like a pre-computed join we decided in pre-computing instead of real-time computing is faster. But the question is, can you still ask questions about stuff in that section? Because if it's kind of opaque and hidden in there, that's useless. We've seen multiple times that we can ask, we were doing queries for, give us all the releases that match something. When we had a quarter million releases in their spurs like this through 5,000 documents, it was still millisecond type of responses, response time. So really, really, yes, we can absolutely ask questions about the embedded data, not just the top level data. We saw Pydantic as a core part of this course, Beanie is of course based on it, and even the stuff we did with FastAPI. So we create a class based on base model, it parses JSON data and even validates or automatically converts from the underlying data types. For example, pages visited that third element, the three, and as a string, it just says, eh, I know it's a string, but it could be a three if we just parsed it. So let's just do that for you. Another super important idea was async and await and async programming and the ability to scale our requests using asyncio. So we saw that if we can communicate back to Python, right now I'm waiting on something, wake me up when it's done, but you can go do other things. We can get awesome scalability that looks like this instead of that four third request waiting for one and two to finish. Front and center to this whole course was the Beanie ODM object document mapper based on Pydantic, programmed with async and await. Awesome work Roman, Roman Wright for creating this. Really, really nice framework. Absolutely love it. When we talked about document design, the primary question was to embed or not to embed. and I had a heuristic that you could follow that I think works out pretty well. Is the embedded data wanted most of the time? If it is, it probably is a good idea to embed it 'cause it comes along for free other than serialization and so on. If it's not wanted very often, it's just dead weight. And then reverse that question, how often do you want the thing that is embedded without the containing element and all the other stuff around it? like if it's a list, all the other items in that list, that the more you want that stuff separated, again, the less likely you wanna embed it. Is the embedded stuff a bounded set? As remember, there's a 16 megabyte limit and a much lower practical limit on how much data goes in a document. So is that bound also small? And then do you have an integration database or an application database, which sort of controls how many different types of questions or how varied your queries are around that data? The more focused it is, the more likely you'll be able to design the perfect documents to match those queries. The more diverse, the more likely you're gonna have something closer to the traditional tabular type of relational data. Document design is only part of it. If you want your MongoDBs to go fast, we have a couple of knobs and controls that you can turn to make things really awesome. Indexes, they're like magic database dust. You sprinkle them on there, things go a thousand times faster. Indexes, indexes, indexes. Think about indexes a lot. They're incredibly important. We just talked about document design. That applies query style as well. You can ask questions that are either fast or slow depending on how you're running them. For example, you could pull all of the data back into memory and then loop through it, or you could apply a limit to the database query and then say, I actually only want the first five. Or you could do that as a cursor if you're gonna break out. that type of stuff is what I mean by query style. And a special subset of that would be projections, right? Where I don't want an entire package with all of its releases, I just want the title, the release date, the last updated date, and maybe the email, right? We saw we could do that with Pydantic models and create a projection view basically into the queries. And then stuff we didn't cover was MongoDB server topology, replication and sharding. Those are all awesome, just outside the scope of a Python course. That's more like a Mongo admin sort of thing. But they are knobs you can turn as well. We deployed our database up to the cloud onto some admittedly pretty wimpy little servers, but nonetheless, we saw that when we're running and doing development, you're probably running MongoDB just on your machine, just local talking back, but there's a lot of considerations when you're running in the cloud, we've got our web server, we've got our database server, we've got security and encryption, performance, all that different type of stuff. So that's what we just did recently, right here at the end of the course. And for the very last thing, we said, well, how much traffic can this web app handle and how do you know? So here's our max request per second version running out of Locust. And we said, let's just start increasingly hitting these endpoints faster and faster until it reaches some limit. Well, looks like the limit here is 765 requests per second for this particular app that we were testing. And once it goes over that, you can usually see it just falls apart hard. So you know, maybe don't push it all the way to the edge before you get that extra server or scale up the server, but gives you a really good sense of what's possible.
|
|
|
transcript
|
1:01 |
And so that's it. That's the course. That's everything we covered. I hope you really enjoyed it. I had a ton of fun making it for you. I know MongoDB is an awesome technology that's fun to work with, easy to keep running in production. You don't have to do a lot of migrations and stuff like you do with relational databases. Really good stuff. If you want to stay in touch, remember you can find my blog and essays over at mkennedy.codes. Listen to the Talk Python To Me podcast. I've recommended a bunch of episodes to try that were relevant to the people who built these technologies here. Also the Python Bytes podcast if you want to stay up on the news, the Python Developer News of the Week. And finally, if you want to have a direct chat with me, I'm over on Mastodon where I'm @mkennedy@fosstodon.org. You can also find me on Twitter, on email, places like that. Thank you, thank you, thank you for taking this course. I really appreciate you taking the time, especially to make it to the end here. I hope you enjoyed it. Take care. Take care.
|