|
|
|
28:46 |
|
|
show
|
2:54 |
Hello, and welcome to 100 Days of Code in Python, written by Bob Belderbos, Julian Sequeira, and myself, Michael Kennedy.
Maybe you're wondering what is this #100DaysOfCode.
You've probably seen it all over social media.
In fact, it's really, really taken off and people are finding this concept of 100 days of code really powerful for getting them to focus over a long time to actually get over the hump, and become capable developers, or maybe learn a new language, like, say, Python.
Here's an example of what you might see on Twitter.
Rene Sanchez says, "Day 11.
#100DaysOfCode progress.
Today I worked some more on bite 18.
Find the most common word from codechalleng.es/bites." This code challenge platform they're referring to is actually from your co-authors, Bob and Julian.
We'll talk more about that later.
Here's another Tweet: "Day Five of 100.
Did some short exercises about modules.
Imported modules, did a couple of my own.
Tomorrow IO.
#100DaysOfCode #Python." Way to go, Bricks.
Here we have "Round one, day 101.
Had to do an extra day due to one day off sick earlier in #100DaysOfCode.
Today more Python debugging, tomorrow starts round two." And Jeff says, "Round one, day 19.
#100DaysOfCode.
Did three exercises in the book.
Basically my average, been taking it slow these last few days.
#CodeNewbiePythonIndieDevIndieGameDev" And finally, let's look at one more.
Amit Kumar says, "#Day32.
Another autowebcompat PR pull request, just got merged.
Way to go, Python Tkinter, #100DaysOfCode." So he added some new feature or bug fix to auto Web Compat, very, very cool.
So you've seen this stuff probably all over social media, Facebook, Twitter, and so on.
What's it about?
Well, this is actually a very structured project put together by this guy, Alexander Calloway.
So Alexander, he was studying in business school but also wanted to learn programming.
And he was having a hard time making progress.
So he came up with this idea of #100DaysOfCode.
Here's a quote from him: "The idea of #100DaysOfCode originally came from my personal frustration with my inability to consistently learn to code after work.
I'd find other less involved activities to spend my time on, like binge watching a TV series.
One of those days, I was sitting in a restaurant with my wife, and sharing my frustrations with her.
I suggested maybe I should make the public commitment to learning for at least an hour every day.
I thought it would go for three months, but it turned out 100 days was the right one." How about that?
Well, thank you for creating this project, Alexander.
This is really a great thing for many people getting started, and this is what this course is all about.
We're going to give you lessons and exercises for every one of these 100 days.
|
|
|
show
|
1:05 |
There are a lot of things that people do to support each other and encourage themselves to stay focused and keep going on #100DaysOfCode.
But there's really just two main rules and they're really really simple.
The first rule is to code a minimum of an hour every day for the next 100 days.
And I would say taking a coding class like learning the lessons in this course and then coding a little bit counts, right?
You're immersing yourself in code for at least an hour a day every single day for the 100 days.
And if you got sick, like you saw the person before had gotten sick, had to take a day off, that's okay you just add some days on the end.
Have sick days and just move it to the end.
The second rule is a public commitment to making progress and keeping with it.
And they way that works is to tweet or to put onto somewhere like Facebook #100DaysOfCode with an update every day.
The PyBytes platform actually is going to help you a lot with this, but however you want to do it it's code an hour a day and share your progress every day.
Super simple rules, and we hope this course really makes this work for you.
|
|
|
show
|
3:06 |
We are going to cover so much content in this course, it's going to be amazing.
You'll learn many, many different things over these #100DaysOfCode.
In fact, there's so many I can't really enumerate all of them, it'll just take too long, but I do want to give you a quick sample into what we're going to cover.
We're going to talk about collections, lists, dictionaries, working with them.
We're going to test our code with pytest to make sure we build reliable apps.
We're going to create games, Dungeons and Dragons style with classes and inheritance and object-oriented programming.
We're going to deal with errors and proper error handling in Python.
We'll do logging to keep a history of what our application has done.
We're going to work with the popular exchange format called JSON, and it's a really great way to exchange data between Python applications and any web service.
Speaking of services, we're going to learn how to call JSON based web services from Python, and if there's no service, can still go to the website and do web scraping.
You can turn any HTML page, anything on the internet, into a data source using web scraping.
Another source that we might go and consume, RSS feeds, really popular among blogs and podcasts, but also other types of subscriptions.
We're going to use the Twitter and the GitHub API to interact with those services automatically from Python.
Want to send an email?
Maybe a new user registered for your site, well we'll see how to do that as well in this course.
Excel has got to be the most popular database in the world.
It's not really a database, but people use it like one, and you may need to program against it.
Turns out, we have the trick for you right here.
Want to automate something on the web?
Go login here, navigate over there, click this button, make that thing happen.
We'll see how to do that with something called Selenium.
You want to write a web application, well we'll do that with something called Flask, it's probably the easiest way to write a web app in Python.
SQLite is a database built into Python, it's what's called an embedded database, and you'll see how to program it, either directly, or from what's called an ORM from SQLAlchemy where you create these classes and you map them to objects in your database, so we'll have a couple of places where we talk about SQLite and relational data.
Graphs are wonderful, they explain so many things, and so we're going to use something called Plotly and draw graphs for you, based on a set of data that you have, and typically when you're doing science like stuff like this, that's done in something called Jupyter Scientific Notebooks, and a good portion of this class will be presented in these notebooks.
Not all of it, maybe about a quarter.
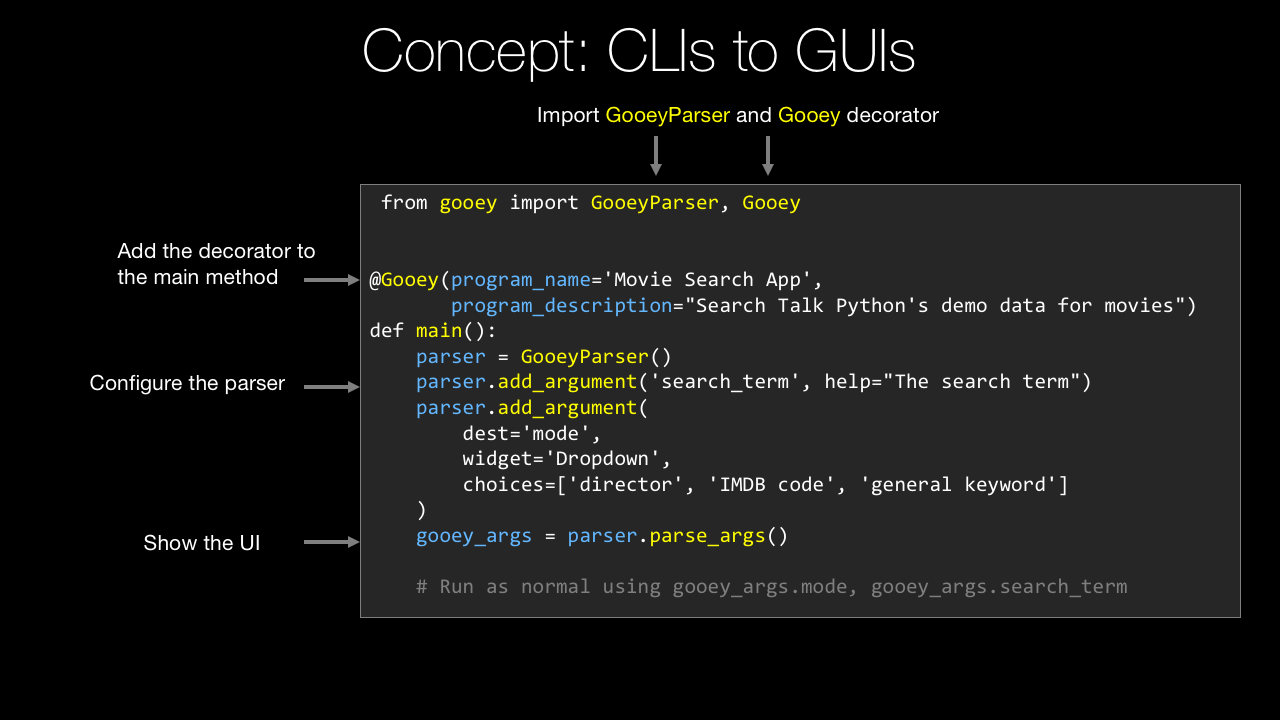
GUIs and Python, they typically don't go together, but in this course, they do.
You'll see in just a few lines of code that we can create a really powerful and cool GUI or desktop application, and this will run on all the platforms, Windows, Linux, and macOS.
And finally, it's fun to consume APIs, but sometimes you want to build them, so we're going to actually take Flask and extend it to create our very own API and put that out on the internet.
This is a ton of stuff right, isn't this exciting?
Well, it's only a small part of what we're going to cover in this course, so I hope you're really excited, Bob, Julian and I definitely are excited to teach it to you, so let's get to it.
|
|
|
show
|
2:05 |
You've chosen Python for your #100DaysOfCode.
Maybe you're a Python developer who has lots of experience.
You just want to go through this whole challenge, and that's great.
You probably already know the power and popularity of Python.
But if you're just getting into programming, and you're coming here and saying, "Well, let's try Python for this 100 days.
That seems like a great way." I want to tell you, you have chosen wisely.
So check out this graphic.
This comes from one of the best sources on the internet for popularity in adoption of technology, Stack Overflow.
And the data scientists at Stack Overflow did some predictions and said, "Well, how are the various languages doing over time?
Are they becoming more popular, less popular?" Based on their view into the industry.
And they did this up to mid-2017, and then you can see the gray part where they're projecting out.
One of these languages is unlike the others.
It is just going up, and up, and increasingly up.
Your other best bet is JavaScript, which is barely logarithmically going up.
Java looks like it's topping off.
The rest of them are going down.
So if you're going to focus on something, pick one particular language.
Pick the one that's got all the momentum and the popularity behind it, and that's Python.
Now, you might say, "Okay, Michael, this actually is against all these older languages, C#, Java, and so on.
What about the new languages like Go and Rust?
They're probably even more amazing and more powerful, and growing quicker." Well, let's see.
Yeah, they're growing up, they're going upward, not downward, that's really great.
Swift is going up, TypeScript's going up, Go is going up, but they are nowhere near Python in this graph.
I just want to leave you with these two pictures in your mind that Python is really a great place to put your energy and be learning.
My rough rule of thumb here is I would like to bet my career on things that are going up, not down.
So which one of these do you want to pick?
Well, you're in a good place.
|
|
|
show
|
1:33 |
Let's take just a moment and talk about how you're going to experience this course.
Yes, it is #100DaysOfCode, but it's not 100 different topics.
What we've done is we've broken the course into three day segments.
So day one, two, and three, days four, five, and six, and so on.
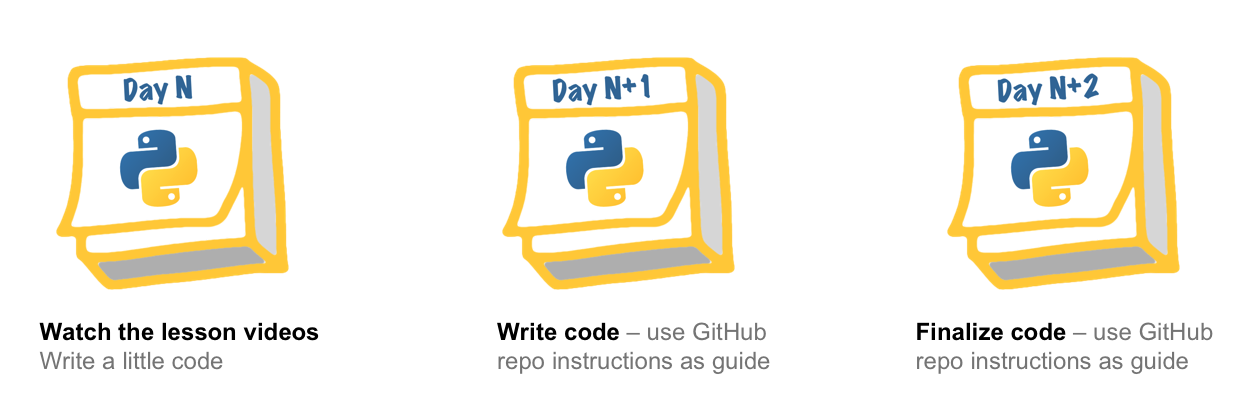
So, for example, on day 10, we're going to introduce a new topic, teach you how to work with it, the ideas behind it, do some live code demos, and then after that, you'll get a chance to write just a little bit of code, 'cause you're going to spend a long time actually watching the videos.
These vary, they would be between 15 minutes, maybe to 2025 minutes on average.
There's a few that are really involved that go out longer than that.
But basically, the first day of any three day segment on a single topic is going to be mostly learning about that subject, writing a little code.
The next day is almost entirely writing code.
We'll have a video for you, it may be just two minutes long, and we're also going to have in our GitHub repository instructions with hints and tips, and things for you to do.
So you'll be able to follow along there.
Then the last day is really about finalizing your code, maybe putting the polishing touches on the code that you wrote on day one and day two.
Again, we'll probably have some instructions to guide you, but if you want to deviate, that's fine.
This is your #100DaysOfCode.
We're just here to support you along the way.
So you can think of this course as 33 three day journeys through it.
And each one of those journeys will go through a particular topic: SQLAlchemy, Flask, Collections, whatever.
|
|
|
show
|
1:46 |
Hi, I'm Bob Belderbos, and I've been programming since ten years.
And for the last six years, I've been using Python, which is now the language of my choice.
I'm very excited to teach you Python in this course.
We're going to cover a lot of angles, so be prepared to learn a lot of Python.
These days I'm a web developer, software engineer at Oracle, and since end of 2016 co-founder of PyBites, together with Julian, where we blog about Python and do code challenges which we lately have transformed in a code challenge platform.
We are super passionate about getting people to code, have a very hands-on approach and really want people to get to the next level of Python.
And that's why we're so passionate about the #100DaysOfCode and this course because we get you to write a lot of Python.
I'm honored to teach you Python and look forward to our journey.
Hi everyone, I'm Julian Sequeira, and welcome to the course.
I've been coding with Python for roughly two years now.
I currently work at AWS, but surprisingly not with Python.
Python is something I've taken up on the side, and something I'm super passionate about and absolutely love doing in my spare time.
I'm co-founder of PyBites, along with Bob.
And everything I do with Python is purely out of love for the programming language.
And I'm totally looking forward to teaching you everything I've learnt over the past couple of years throughout the course.
Hey, welcome to our course.
I'm Michael Kennedy, nice to meet you.
A little background on me, I'm primarily a web developer as well as the founder of the Talk Python To Me podcast and Talk Python Training.
I've been a professional developer for 20 years, and I'm really excited to share that experience with you throughout this course.
Welcome to the #100DaysOfCode and Python.
|
|
|
show
|
0:39 |
Do you need a little help with the Python language?
Of course, we'll cover much of the little details and definitely the advanced features as we go through this course, but we don't start from the absolute beginning.
What is a variable?
What is a loop?
Instead, we've included a Python language primer.
So when you look at Python, if it's, you know, a little fuzzy, maybe you've done it a long time ago, but you've forgotten.
You haven't done very much of it.
Well, we put something in here to help clear it up.
So anytime you're confused about something in the language, just jump down to the appendix, Python Language Concepts.
Find that thing, watch the one to two-minute video.
Hopefully, that'll clear things right up.
You'll find this at the end of the course.
|
|
|
show
|
2:09 |
We've made all the code we've written over our 100 days worth of topics available to you in GitHub right here.
gitHub.com/talkPython/100daysofcode-with-Python-course.
You can go over here and check it out.
This is also super important because some of the projects that you work on have either data that you've got to start with, or they've got some instructions and all of that you'll find here.
Let's jump over to GitHub and have a look.
Here we are at the GitHub repository.
You have a little bit of a description here at the beginning.
But the main thing you care about is the days.
You can come in here and see the day one to three.
This is the stuff with JavaScript.
Here's day 13 to 15.
This is our text-based games.
Down over here is a Search API.
Let's just check this one out and see what's in here.
Here's demo that we built, and if you need the code for it you can see actually here's what we've written and so on.
These three pieces work together.
But what's most important is this ReadMe.
It's automatically displayed by GitHub when you come here.
You can see it talks about now that you've seen the videos what do you do?
Here it talks about, okay, so you watch this.
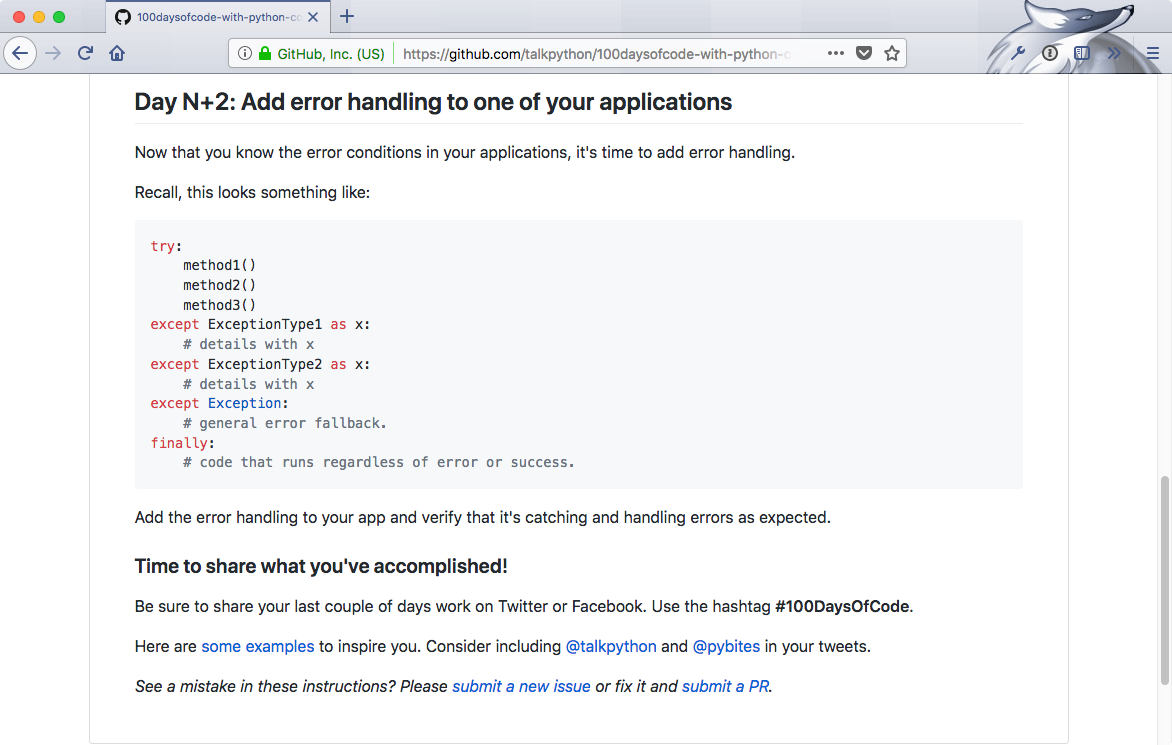
And the first thing on the day 43, that's the first day of these three, this is what we're going to do.
On day two, it talks about working with API.
It shows you how to use it with this thing called Postman.
And then finally, it also shows you how to build your app, and then finally it says, okay, on the last day, we're going to make it even better.
For the very grand finale, we're going to open it in a web browser if somebody picks something inside your application.
You can see that as you go through you want to make sure that you go to each day, look at the instructions.
They're going to be there to help you follow along, both the code demo we wrote as well as the steps and data that we put together for you.
Of course, to download this, you'll want to download it.
I would also say star and fork it if you have a GitHub account.
You could either come here and copy this and Git clone it if you're familiar, or if you don't want to mess with Git you can just download the Zip file and it will be a folder you can unzip somewhere to work with.
But definitely download this.
You're going to want it locally.
You're going to want to save it.
You're going to use it throughout this course.
|
|
|
show
|
1:42 |
When you dedicate yourself to taking a course, and carefully working the way that the instructor, the author, is working, you are effectively gaining much of the experience that that particular author or developer has gained through their career, through their jobs.
This course is special because it's taught by three people.
That means you get three experiences in one.
And this is super valuable.
Imagine that you have a job at this place.
You get to work with cool VR gear and on hardware and IoT things.
You'll gain one set of experiences.
But if you took a different job, say, you're starting a fashion start-up with your friend, this woman, from college, and you're just working on this coffee shop.
Being scrappy, working, trying to get venture capital and launch your application, you have a totally different experience than this dude in a VR headset.
Or maybe you go the corporate route, work at Microsoft like this guy here.
He's, you know, working on some new programming, language tooling around Python.
These are all super different experiences.
And these experiences are very positive.
They give you a different perspective and more perspectives on programming.
That's awesome.
How's that relevant to this course?
Well, with the three instructors, we each have a slightly different set of tools.
And slightly different way of working.
We're going to show you next, how each of us gets set up.
What you need to follow along with each of us: Julian, Bob, and myself during our particular segments.
You don't have to work like us, but if you want to do exactly what we're doing, we'll show you how we got started.
And we feel this is super valuable for you.
You'll have not just one experience, but three experiences kind of bundled up into one.
And so on the other side of this course, you're going to have a broader perspective.
And that's pretty awesome.
|
|
|
show
|
2:44 |
'Kay, guys.
This is Julian here, and I just wanted to quickly walk you through my environment for the duration of the course.
There's actually not much to it, and that's because I'm using Windows, and I really wanted to keep it simple.
Okay, I wanted to show that you don't need to use anything crazy.
Not that there's anything wrong with that, but pretty much bare-bones on Windows, you're able to code anything you want and just get into it, okay.
So the first thing you're going to need to do is go and download Python.
And you can do that at Python.org/downloads.
Okay.
And it will detect you're on Windows if you using Windows, and you can download Python 3.6.4, the current latest version, and install it.
It's just an Microsoft installer file.
It will install to a default path.
You don't have to change anything.
Don't worry about it.
Nice and simple.
And once you're done, you can actually just launch IDLE.
Okay, that's I-D-L-E.
Right?
You type that into your Windows search, and that will actually bring it up into the Start menu.
Right?
Once that's up, you'll see something that looks similar to this, the Python shell, which you can just type in Python code.
Okay?
And you can live code just like that.
This is the Python shell.
Now with IDLE, this Integrated Development Environment, okay, that's what IDLE stands for: Integrated Development and Learning Environment.
With that, you can actually create a Python file.
Okay.
This is actually going to be pretty much a plain text file, but when you save it, it will automatically save it as a .py file.
So your Python file.
That's what I like about using IDLE.
I never have to worry about accidentally using the wrong format.
Okay?
And other than that, you've seen some of my videos that I run my scripts through the command prompt.
Okay?
There's my path to my environment, to where I'm storing everything for this course, and I will just run the scripts straight from there using the Python command.
And that is pretty much the bulk of my setup.
You won't see anything else.
You won't see anything different.
That's it, okay?
So standard command prompt on Windows.
I don't even use PowerShell.
I've go the Python shell here, and I just save the files using the new document section of the Python IDLE.
And that's pretty much it.
So, I say keep it simple.
One day I probably will make the move to PyCharm or something, but for now, I'm happy with this.
|
|
|
show
|
3:55 |
I'm using Anaconda for this course, a pre-bundled, Python distribution widely used in the Data Science community.
And it comes with a lot of packages already.
You're not required to use this distribution.
You can also pip install my requirements, which we will see in a bit.
You can download the full version here.
We recommend that you use 3.6.
Really no reason to start a new project in Python 2 anymore.
You can also install Miniconda, which is a smaller version, which only includes the base packages.
And, mainly, what you need to know is for almost all the lessons, I will be using Jupyter Notebooks, which is a great way to experiment with Python code and more in the browser.
It's a great tool to both teach and learn Python.
You can try it out if you want to play a little bit at this point by going to try.jupyter.org, but I encourage you to install it to follow along with my lessons.
To install it, again, the recommended way is to use Anaconda, but you can also use pip install jupyter, and that should get it as well.
And let me show you that quickly.
So, first I need to clone the 100 Days of Code repo.
You cd into that.
At this point you really want to make your virtual environment to work on the project's requirement in isolation to not mess up your global space.
And in every lesson, I have a video how to pip install the requirements for that lesson, but I also have 'em all wrapped together in a requirements file.
So, for all the notebooks, you need Jupyter; and ipykernel, which I will explain why in a bit; and then I listed out the requirements for each lesson.
There are various ways to make a virtual environment.
The classic way is to use pyvenv built in module.
You can also use pipenv, the new way, which should be perfectly fine.
And Anaconda comes with Conda, a utility to manage environments as well.
However, I am used to virtualenv, just the classic one.
So, in this course I am making a virtual environment with this alias: virtualenv -p, pointing to the Python binary that comes with my Anaconda installation, and the name of my virtual environment.
So, let's run that now.
And then you have to activate it.
And that's what I'm doing, that a lot I have another alias, ae, and now I'm in my virtual environment, where I don't have anything installed.
At this point, you can just do it video by video, but if you want to have all the packages up-front, you can do pip install -r, requirements/requirements, and that might take a bit because it's not only pulling the dependencies, but some of the dependencies have other dependencies.
With that done, you can launch a Jupyter notebook like this.
And you can go in today's and do any lesson.
For example, Selenium.
And you can open the notebook like this, and you can follow the lesson.
And you see that the notebook discovered my virtual environment.
If that is not the case, you might have to tweak it a little bit, and that's why I pip install ipykernel and Tornado was pulled in as well.
That should have been enough.
If that's not the case, you might have to run iPythonkernel install And this will be venv, or the name of the virtual environment.
And then back to the notebook.
You should have the kernel, venv, or whatever you named the virtual environment, here, and you can switch to that, but I already have it here.
So, then your dependency should work.
It's in your virtual environment and you can follow along with the lesson and make any modifications in the code and experiment and that's how you learn.
|
|
|
show
|
2:46 |
Michael here.
It's time to show you how I set up the tools when I'm writing code.
Now, I'm going to be using a Mac, macOS High Sierra for this course.
That's the latest at the time of the recording.
However, you can use Windows, you can use Linux.
They're all basically the same as far as that goes.
I'm going to be using the editor PyCharm and I'm going to be using Python, the one that I got from Python.org not installed any other way.
So let's see how that goes.
First off, when you're on a Mac if you've taken no actions you don't have Python 3.
You'll know if you open up your terminal.
Come over here and type Python3 -V and you would get the same error something like Python3 not found as if there's a Python4.
Someday, maybe, not right now.
So if you type Python3 -V not lowercase v and you get not found you need to install it.
If you get something like, 3.5 or above, you're fine, you're done with Python.
All you got to do is come over here, go to downloads, download right now the latest is 3.6.4.
So download that, it gives you an installer.
Run the installer; you're good to go.
The other tool that I use a lot is something called PyCharm.
It's an editor for Python.
One of the richest and most powerful editors.
And I really think it's great both for beginners and for professional developers.
And it comes in two versions.
You can see the full fledge Professional or the Community Edition.
So you can download the Professional or the Community Edition.
The Professional one costs money.
You can pay for it monthly or you can buy a license.
Whatever, it's like about eight or nine dollars a month.
You can get the Community Edition.
It's free and open source, okay.
This also comes with a month long free trial so you can try it.
If you care about the features, say which one comes in which, you can compare them down here at the bottom under choose your edition.
So it's up to you which one you get.
So we can come down here and download this and install it.
One thing that's cool that you might consider getting is this Toolbox App.
This one will sort of keep track of updates for you.
It looks like this and it gives you access to all of the tools that JetBrains has.
So if you're going to install more than one, this might be handy but you don't have to get it.
Either way, get either PyCharm Pro or Community Edition or get this JetBrains Toolbox which I have up here.
You can see apparently there's an update for my PyCharm Professional.
If I want a data grip, I can just click that and install it.
Once you have it you can run PyCharm and you'll be able to start creating and editing Python projects.
That's it, I don't really have anything else installed for working with the code.
It's just Python, my OS, and PyCharm and we're good to go.
|
|
|
show
|
2:22 |
As Michael stated, there are 2 important rules for the 100 Days.
And it is code an hour a day, and track your progress.
Do a daily tweet of what you have accomplished that day.
In order to help you guys do that for this course, we made a feature on our code challenges platform.
So head over to codechalleng.es and sign in with GitHub and go straight to 100DaysOfCode.
So here you see a template where you can start the #100DaysOfCode, but we made it easier and made a direct link to populate the 100 Days for you.
Head over to start talkPython and here you get a grid of 100 Days with exactly the materials of each day.
So for example, Day 1 you start with day times.
Day 1 is a lectures.
Day 2 is the practice, and Day 3 is even more practice.
And you can just click on the Tweet icon and that prepares a tweet for you, so you can just tweet this out or you can modify it as you want.
And then you can start to put things into complete.
So here for example I hit Day 1, done.
And you see that this percent counter then goes up and the items that you've done are under done.
And so, 2.
And here you can document additional learning, so here I learned that time Delta, for example, and here you are at the second lesson.
So this is Day 4 and here you're going to look in the collections module, here.
Watch the videos.
And on 4% and here I did an exercise, and marked complete.
So this is the grid of the whole 100 Days.
All the materials we have prepared for this course, and once you're done, you have a nice love of all the stuff you have coded and accomplished.
For example this is our #100DaysOfCode which I imported from Twitter.
As you see we did a ton of coding and you have it all nicely in one place, and you can refer back to it which we do often.
We go back to our script a lot, pull out stuff we learned, reuse it, and that's why it's nice to have a #100DaysOfCode log.
Apart from that the tweeting is a very easy and we encourage you to do that.
It's also a way to notify us what cool stuff you are building for this course.
Completing the 100 Days is not easy.
It's a lot of work and dedication, but at the end, it's a great accomplishment.
And you will have grown as a developer.
So you should be proud when you see this honor of accomplishment when you hit the hundred percent done.
So we hope this will help you make it easy to keep track of your progress during this course, and if you want to tweet along is stated in one of the rules.
This should make it very easy.
Alright and with that good luck and prepare to learn a lot of of Python.
|
|
|
|
20:34 |
|
|
show
|
0:40 |
Good day, this is Julian Sequeira and welcome to the course.
We're going to open things up with playing with datetimes.
Probably not the most interesting thing for most of us and if you're like me, you probably hate it because they can be very finicky.
So, with datetimes I wanted to run us through some of the more basic concepts of it.
Just go with it, there will be more advanced stuff coming up but for now we're going to stick with just the basics to get you through with datetimes specifically around datetimes.date and then datetimes.timedelta.
So, we'll flick through into that, carry on, and let's get started.
|
|
|
show
|
1:33 |
Right a quick overview of what we're doing for the next couple of days.
For the first day of your datetimes lessons you're going to watch the videos, okay?
A couple of videos for you to watch to do with datetime, date, and timedelta.
Alright after you've done, after you've completed watching the videos go ahead and just play around in the shell.
So do some timestamp calculations as per the content in the videos.
So we won't dwell on that too much.
The second day I want you to head to our challenges, our challenges platform I should say and sign up with your GitHub account.
It's free and then follow this link here and this will unlock this datetimes challenge, okay?
This bite here is going to be based around parsing dates from logs.
Okay so have a play with it, code in the browser and have fun.
That's your day two.
Then day three.
That is all going to be up to you.
Create something for yourself.
I reckon you should give a Pomodoro timer a chance.
Use datetime for it.
I know you can just use a time module for these examples here but the idea is to include some timestamps.
Do some calculations and see what you can wrap around date time okay so the Pomodoro timer is quite simple.
You can do that or you can do a stop watch.
Anything like that.
So if you have any ideas yourself now is your time to test it out on day three.
|
|
|
show
|
8:12 |
Given datetime is part of the Python standard lib, we don't actually have to do any setup here.
You'll see in the coming videos that you will have to do setup steps, create virtual environments and whatnot, but given this is datetime, we don't really have to.
And, I think it'd be best for us to just work in the Python shell here.
This is IDLE, the default Python IDE that it ships with.
So, let's have a play with that.
Now, the first thing we're going to do is we're going to import datetime.
But, we're actually going to do from datetime import datetime, okay?
And, this is just going to make it a bit easier for us when we're typing in the rest of our code.
And, just to get yourself prepared, let's just from datetime import date that's for a bit later in this video.
Alright so what is datetime, alright.
For those who are unaccustomed and unaware datetime is just the Python library module that allows you to deal with dates and times.
Pretty self-explanatory, right?
So, if you want to deal with just the dates so, you know, today's date, let's call it the 23rd of February 2018, not very specific.
Or if you want to deal with the time that you've got to think about that from a programming perspective, there is a difference, okay.
So, datetime allows us to deal with the entire time set, the entire timeframe.
You're talking seconds, minutes, hours, days all the way through to years, okay?
We can visualize that with datetime.today().
If we hit enter, there we go, we can see today's date.
The 24th of February 2018 but we also get this timestamp.
It's 10:17pm and these are the extra seconds here.
So seconds, milliseconds and whatnot, okay?
Now I'm going to show you this, what kind of an object is this?
Well let's go, well first actually we have to assign that to something that way so, we'll just go with today.
Here's datetime.today() alright and then we'll type it out, so type today.
So it's a datetime object, okay?
And that's important because you can't mix these objects.
I'll point that out in just a minute.
So with this timestamp, there is more you can do with that.
And I'll show you that in the next video with timedelta.
Alright, but for now just understand that this is what your standard datetime format will look like.
This is the sort of data you're going to get back.
And this is really useful for times when you want to deal with say, subscriptions or anything like that where it has to do with exact timestamps, or logging or anything where you need to know the time that something happened.
Going by the date of say, the 24th of February is not accurate enough, okay, there is 24 hours within that day so, a lot of things could have happened.
Alright, so we'll move on to the date part here.
So we'll just go today date, we'll create that variable.
Here's date.today(), so you can see straightaway we're not using datetime, we're using the date section okay, we're using the date option here.
So date.today() and if we type that out Today date, we can see the different type of object here.
First one was a datetime and now it's a date object, okay?
And we can see what that looks like with today date.
And we have just the date string, okay?
So we don't have the extra time on the end.
And this is, again, very useful.
So you can see the distinction between the two of them.
Alright let's get ourselves a little bit of white space.
Now one really cool thing that I love about date is that we can drill into it a little more, so we can go today.month is 2.
So you can see we can actually tear it apart a bit.
So today.day is 24 and then today.year, and we get 2018.
So now you can sort of visualize how date can help you in your projects, right, if you're not already using it.
It's actually really cool.
So one really, really cool thing that has come in handy over time, is the fact that you can do a bit of math with your dates, alright.
So we'll go, let's just go something easy.
So Christmas, what's the date for Christmas?
It's the, we'll go year first, so 2018.
It's the month next, so 12.
And then it's the day, so 25th, alright.
Now one thing, if you had a look, this is ...
us specifying a date, this is us assigning a date to a variable.
So now the Christmas variable is always going to have this date assigned to it.
You can see that there, okay.
Now, this is really cool, so We can actually go Christmas, cause we know that's the end of this year, minus, today date.
Kay, and that's 304 days, it automatically called on timedelta, so that's giving away something for the next video but, carry on, 304 days.
Alright, and we can see that visualized a different way.
We can, and this is again giving more away we can go Christmas minus today in days, so .days.
304 days, alright and this is really cool for something such as this, I'm just going to copy and paste here rather than type it all out for you, alright.
So if Christmas is not today date well what can we do?
We can print a certain message.
Again, you can see this is useful for certain other projects so print, sorry there are still this many days (christmas minus today).days, until Christmas.
Okay, and then else ...
We'll copy and paste this as well.
We're going to print some sort of message, alright.
"Yay, it's Christmas." So, by hitting enter, sorry there are still 304 the same value here, until Christmas.
I've obviously left out the word 'days' so that's my mistake, but sorry there are still 304 days until Christmas.
If I happen to wait another, you know, ha ha ha ha that many days, 304 days we would then get this message here.
So this is date and this is datetime.
Very, very tedious at times, I want to say but so useful, so this is a great place to start manipulating your code, manipulate your dates and have some fun with it.
And in the next video we're going to look at datetime.
|
|
|
show
|
6:07 |
Okay, just like the previous day, we're going to look at something but we're going to use the Python shell for this one.
And specifically today we're looking at timedelta.
So what is timedelta?
Well, timedelta is pretty much a gap in time measured out.
So, for example, if you want to calculate something such as how many hours from now until a certain point in time, you can use timedelta for that to specify what it's going to be.
A real world example.
How many hours until I go to bed?
Well, let's say it's going to be four hours.
So my timedelta, you can specify for this calculation, is four hours.
And four hours from now could be two in the morning, okay?
So it's different...
That's how you calculate things like that, you use timedelta.
All right, so how do we do that?
Well, we go from datetime import datetime just like usual, from datetime import timedelta.
All right, so let's represent our timedelta as a variable t timedelta and let's work on days and hours.
So let's say we have four days and 10 hours until my next day off work, it's pretty depressing.
And how do we deal with this?
How do we work with this?
Well, let's first of all confirm we have a timedelta object there, excellent.
And what next?
What can we do with this?
Well, we can go how many days in there.
So t.days.
That gives us four days, okay?
One important thing to note here, watch this next one.
T.seconds.
36,000.
So 36,000 seconds is not four days 10 hours.
36,000 seconds is just the 10 hours.
And why is that?
Well, this timedelta is just like...
Imagine the stopwatch on your watch, it's only able to go up to a certain amount of time, right?
Maybe 23 hours and 59 minutes.
So with timedelta, the seconds, it's only able to go up to a maximum of one day, okay?
So we have four full days here, so it's not going to show us the seconds in four full days.
It's only going to show us the seconds in the hours.
So you have to take that into account and your calculation.
Okay?
We could calculate the hours but not like this.
Okay?
It doesn't allow us to do this because it has seconds, it's not going to bother with hours, all right?
So in order to get around this, well, you have to do a bit of maths, unfortunately for people like me.
So t.seconds divided by 60 and divided by 60 again.
Well, because we have 60 seconds in a minute and then 60 minutes in an hour.
And that gives us that 10 hours.
Alternatively, you could write that as t.seconds / 3,600.
Same thing, okay?
That's a really important gotcha because it definitely got me.
back at the start.
So here is an example of a sort of scenario you could use it in, but just keep in mind, timedelta is that gap, it's that sort of way of representing the time between two points in time, okay?
All right, so we have an ETA.
Well, let's just say it's the ETA until I wake up.
So hours equals six.
We're not even going to talk days here, okay?
We can go today.
We'll give ourselves a datetime today, variable, okay?
We're not dealing with just date, we're dealing with day time because we want the time, we want the minutes, the seconds, the hours, right?
So there we go, we've got two variables, ETA and today.
All right?
So today, let's just show you what that is.
It's currently 10:39 p.m., okay?
Let's get rid of that.
All right.
We can go what is ETA?
Is our timedelta, all right?
Now, what next?
We want to add these two together, okay?
So we can go today + ETA, this is the beauty, the absolute beauty of timedelta, we can just add it straight to a datetime object which is so cool and so handy and it makes it so easy.
So today plus ETA.
And look at that time.
It actually changed the date to the 25th because we'd cross over midnight and it says six hours from now is 4:39 a.m., okay?
And this is really, really cool because you don't have to worry about any conversions, you don't have to change anything.
It's so easy.
And even better than that, we can format it, so today + ETA as a string.
Look at that, it's glorious.
We have an actual nicely formatted date string and time stamp.
How awesome is that?
And that's timedelta, that's really the bread and butter of timedelta.
You're dealing with just setting yourself a static time, a static amount of time and then you can add it, subtract it, do whatever you want with it.
And this is really useful in a lot of programs, so keep this one in your belt
|
|
|
show
|
4:02 |
Okay, and that was the basic overview of datetimes.
How cool was that?
Not too bad, not too hard.
Nice way to start your #100DaysOfCode on Python, right?
Alright, so let's do a quick recap of what we covered.
There wasn't a lot so this will be pretty quick.
So we began by importing datetime and date.
And we then started to look at the differences between datetime and date.
So a datetime object, well when we ran datetime.today(), it included the date and the time, so we had a timestamp in that object.
Whereas when we ran that with just date, we only get the actual date, the calendar date.
So we the 19th of February 2018, alright.
And we found that you can't actually easily combine the two, do maths between the two.
Okay, not without a lot of conversion.
First we gave ourselves a Christmas variable, and we gave it its' actual date, which is something you can do with date.
You can assign an actual date to an object.
Once we did that, we were then actually able to calculate the amount of days between Christmas and the current date.
So that was just a bit of a little scenario for you to use datetime and date.
Okay, next we played with timedelta.
Now we began by importing timedelta and then we gave ourselves a timedelta object.
So we set the timedelta length as 4 days and 10 hours.
Then we discussed the fact that you can view your timedelta in those days and you can view it in seconds, but you can't view it in hours, okay.
And that's because it only works in days and seconds.
And the seconds only go up to a max of the 24 hours of a day.
They expect you to do the calculations yourself.
And that's what we see here.
t.seconds / 60 / 60, and then we get our ten hours, okay, matches up there.
As a little scenario to try, we wanted to look at the ETA.
We wanted to add the estimated time of arrival onto the current time.
So the current time plus six is that there, that's the object there.
That's the response there I should say, the calculation.
And we were able to add and subtract timedelta from datetimes which is really, really cool and makes it really easy.
And using string on that, converting it to a string, we got a really nicely formatted timestamp here.
Very useful for log files right.
Alright, your turn.
This is where it gets a lot of fun.
What I'd like you to do for day three is come up with something cool for you to make with datetime or timedelta.
Think about perhaps making it a stopwatch, maybe a timer application.
I actually think a really fun one to make would be a Pomodoro timer.
So if you're not familiar with Pomodoro, just go and google it.
But that would be a really cool way of setting specific timestamps that a user could choose using datetime and what have you.
So that would be really, really fun.
Now I know what you're thinking, datetime is a really deep and in-depth topic, but unfortunately we just don't have the time to run it in this course.
So I hope you really enjoyed it.
Move onto the next video, we are keeping it nice and simple for the first day.
Expect things to take it up a notch going forward.
So enjoy, get cracking, don't waste any time.
|
|
|
|
17:10 |
|
|
show
|
0:40 |
Welcome back to the 100 days of Python.
In the coming three days I will guide you through the collections module, a very convenient module to work with more advanced data structures.
First we look at namedtuples and how they can make your code more readable and elegant.
Next we look at defaultdict, which is convenient to build up a nested data structure.
Third, counter, saves a lot of code to find the most common thing in a collection, and lastly, deque, which can tremendously improve your performance based on the operations you want to do on your sequence, and for the second and third day I got a movie dataset where you can put the collections module into practice.
|
|
|
show
|
2:05 |
Get Pythonic with a collections module.
We are all familiar with dict, list, set, and tuple.
The collections module adds a few other specialized ones that are very useful.
Let's import the modules we're going to use.
A namedtuple is a convenient way to define a class without methods.
We all familiar with a normal tuple, which you can define with parenthesss, and one or more elements.
The thing with the classic tuple, though, is that the order is not really meaningful, so if you print the user name and the user role, user index zero is a user index one, and you already notice that the indexing is not really saying that much.
Is there a more readable way to define these kinds of tuples?
And yes, you can use a namedtuple, so let's define one.
User equals namedtuple, and you give it a name, and the fields or arguments it takes, so name and role.
And let's create a user, with user and I give it a name Bob and role equals coder.
The nice thing, then, is that you can access the entries like this, instead of indexing with zero, one, etc.
So this is much more meaningful And to see that in a print statement.
So, use namedtuples.
It's very easy to set up, and it definitely makes your code more readable.
|
|
|
show
|
3:01 |
A second data type I want to show you, today about, is defaultdict.
And it's very useful when you're building up a nested data structure and you have to account for keys not being there.
Now first of all, what's the problem with keys?
Let's define a very simple dictionary, just one user and role, and let's do a lookup by key.
So...
Bob is there.
Julien is...
Oops, not there and that gives you a key error.
There's a way around it by using users get.
Oop, get Bob..
and users get...
Julien...
which returns none.
But how do you deal with that when you're building up a collection?
Now let's get some data.
I'm going to define a list of tuples.
A challenge is done.
And it has...
tuples of name, and a number of the challenge that has been completed.
Let me type that out.
So the goal is to convert this into a dictionary.
Let me show you what happens if I use a normal dictionary.
For name challenge in...
challenges done.
Challenges dictionary...
name append...
challenge.
Oops, it says Mike is not in the dictionary.
In the first round, he is indeed not in the dictionary.
So here is where is you really want to use a defaultdict.
So to define one, challenges...
Equals defaultdict, and you need to define what type the values hold.
So in this case, the key is the user and the value is a list of challenge numbers.
So I put list here and the rest is kind of the same.
For name challenge in challenges done.
Challenges...
Name...
append...
challenge.
I'm almost sure this works.
So, yes, we have a defaultdict which holds lists and here you see keys are Bob, Julien, and Mike and values are list of challenge ids.
So you see here, we work around the key error.
The defaultdict has the mechanisms to use a factory to initialize the data type that the values need to hold and yes, it's safer, it's cleaner, and for this type of task, I highly recommend that you use this data type.
|
|
|
show
|
1:21 |
Let's move on with Counter.
Let's say we have a text which is split into words, and we want to count the most common words.
Before I knew about collections, I would write something like this.
There you go.
I had to loop over words, keep a dictionary, see if the key was in the dictionary, if not, initialize to zero.
If it's in there do plus one.
Then I had to loop over the items over the key value pairs, sort them and use lambda to sort by value.
In reversed order and take a slice to get it to five.
Now compare that with using Counter, and its most common method.
It's like magic, right?
One line of code, you pass the words list into the Counter, and you call most common and you give the number of top words you want to see and compare that with all the work I had to do here and how easy it gets by using the collections, Counter.
|
|
|
show
|
3:27 |
Next up are deques.
deques are stacks and queues.
They're useful if you want to insert and append on both sides of the sequence.
In this section, I will compare them to lists.
I mean, lists are your best friends.
You will use them everywhere.
They're easy to use and for 80% of your use cases, or maybe 90%, they're just adequate.
But lists come with a downside which if you have to move items around, they get less performant.
And in this exercise, I will create a list and a deque of ten million ints and a function to do random inserts and deletes and then we're going to use timeit, to see how they perform.
So let's create the two sequences.
First I want a list.
I can just use the range.
Let me the get the zeros right.
One, two, three, one, two three.
That's ten million.
And let's make a deque.
You create that big deque.
Range, one, two, three, one, two three.
Next, we create an insert and delete function that takes a sequence...
and we do, for...
Underscore...
In braces..
Index equals random...
Choice.
And a random choice takes a sequence and just randomly chooses one item.
I store that into index and I remove it.
So that index is like a random location in the sequence.
I'm going to remove the item that's at that index.
And I'm going to do an insert of index at index and I'm just going to insert the same value of index, doesn't really matter.
I'm going to use timeit to time this function for both the list and the deque.
Here we have the timeit module.
And we're going to call it with insert and delete on the list, and the list we defined here above.
You can see this took a little bit.
And now let's do the same for the deque which we defined here.
And although it seems to take a little bit as well.
Here we're talking about milliseconds and here we're talking about microseconds.
Here it also run like 10,000 loops.
This one was slower so it reduced to one loop.
So deque performs at a fraction of the list and that's because inserting and removing at both sides of the sequence are more efficient in a deque than a list.
A list has to move all the items around and that's expensive.
I encourage you to look at the docs because there are a few other data types that are interesting and you can read about ChainMap, for example.
An OrderedDict is another good data type to know about.
Although I think in Python 3.6, dicts are becoming ordered by default.
That concludes day one.
|
|
|
show
|
0:54 |
So a quick overview of we've learned so far, namedtuples, an elegant and readable way to create tuples, and instead of user index zero, and index one, you can say user.name and user.role.
A defaultdict is great way to buildup a nested data structure, you don't get key errors, because the internals make sure that the value gets initialized before appending to it.
Counter, don't reinvent the wheel, so here at the top you see all the code I needed to get the top five words in a string, and below we did the same, but only with one line of code, very powerful.
A deque, so lists are your best friend, but if you have to insert at them at the start, for example, they get very slow.
So deques are great if you need to insert and remove at both ends of the sequence.
And now it's your turn.
|
|
|
show
|
4:39 |
Welcome back to the 100 days of Python and the second day of the collections module.
Today, we're going to get practical with a code challenge.
That will be highest rated movie directors.
We will load in a data set and convert it into a default dictionary of directors as keys and movie namedtuples as values.
If you want to try it yourself on scratch, I encourage you to pause the video now and read through this link and try to code it up yourself.
What I will do in the rest of this video, is to guide you how to get the data loaded into the directors variable.
So parse the CSV, convert it into defaultdict, and also will have a Counter example, how to get the directors with the most amount of movies.
So if you need some guidance, keep watching but maybe you want to try it yourself first.
Welcome back.
I hope you had fun doing the other exercise.
In the next session, I will show you how to load in the data and parse it into a defaultdict.
So we're going to load this data in and the goal is to make a defaultdict where the keys are the directors and the values are a list of movies and every movie will be stored in a namedtuple.
So let's define the namedtuple first.
We've defined a namedtuple called movie with title, year, and score.
Those are the only fields I'm interested in for now.
We need to parse the CSV and load the data into defaultdict.
I'm not going to touch too much upon the CSV part because there's a whole lesson dedicated to that.
I will write out the function and come back and comment it line by line.
And let's see if that works.
And let's get the movies of Christopher Nolan, one of my favorite directors.
Wow.
Look at that.
I can look up a director and I get a list of movies and each movie is a name tuple with title, year, and score.
Okay, let's go back to the code I've just written.
We make a function and receives data which by default is movies CSV which we retrieved here.
I initialize a defaultdict of lists called directors.
I open the data with a with statement.
Then I use the CSV dict reader to parse every line into an OrderedDict.
Every line, I extract the director name, movie title, title year, and IMDB score and store them in variables.
The year, I convert to int.
The score, I convert to float.
With data analysis, there's always bad data and this is no exception.
A value error got raised for some rows.
So when that happens, I just ignore the row.
I'm not interested in incomplete data.
I initialize the movie namedtuple and give it movie, year, and score.
That namedtuple gets appended to the director in a directors named list.
So here you see the defaultdict in action.
I don't have to initialize an empty list for every director up front.
defaultdict handles that all behind the scene.
And then I return the directors defaultdict.
Then I call the function and store the results in the directors variable and then I can look up directors.
So there's a lot of stuff you can do with this data.
Let's do one more exercise.
I'm going to use Counter to find the directors that have most movies in this dataset.
So I use a counter and I'm going to loop over...
the directors...
we stored before.
I can loop over dictionary with items which gives me the value pairs.
Then I'm going to store the director...
in the counter object.
I'm going to sum up the length of the movies.
You can do this by hand, but the nice thing of having a counter object that now I can do counter...
Most common.
Five.
And there you go.
Spielberg, Woody Allen, this is pretty plausible.
So here you got some more practice using the collections data types.
|
|
|
show
|
1:03 |
Welcome back to the 100 days of Python, and the third day of the collections module.
Now it's time to get some more practice yourself, so I encourage you to try to use the new collection's data types in your scripts.
We did the #100DaysOfCode ourselves and we made a module index script which lists all the modules we used and the days we used them, so you can go to our log and look up those days and look at the scripts that used the collections in one way or the other.
This was the script to identify if a tip was already submitted to pytip, and here we use the name namedtuple.
And this was the script I was just showed you about the module indexer, and here we used defaultdict and Counter.
So you can look at more examples for where we used those data types, but maybe you can refer to some of your code to start using collections more.
And don't forget to mention 100 days of Python when you tweet out your progress.
That's a great way to keep on track.
Good luck, enjoy, and remember, keep calm and code in Python.
|
|
|
|
24:41 |
|
|
show
|
0:25 |
Good day everyone.
This is Julian Sequeira and welcome to Python Data Structures.
So this series of lessons in going to walk you through the basics of lists, tuples, and dictionaries.
So hopefully stuff you've seen before, but this should be a good refresher.
There'll be a couple of videos to watch, but then there'll be some exercises as well.
So, nothing left to say.
Let's get cracking.
|
|
|
show
|
2:47 |
Here is your three-day breakdown for this lesson.
It's actually pretty simple.
There's not much to it because we are dealing with data structures.
Super important though, so very important that you get this down.
For the first day, we're just going to watch the videos.
Okay, there's not too much involved with this.
Just watch the videos that we have on lists, tuples, dictionaries, and then just have a play in the Python shell.
There's really not much to do.
So digest the content in the videos and then hang around for day two.
Now the second day, it gets a bit more interesting.
What I'd like you to do is follow this link here, this bites of Py code challenges promotion link.
This will give you free access to this specific bite.
This is a little challenge for you.
We just open it in a new tab.
Okay, I will log in with GitHub.
So you have to have your GitHub account ready.
And there you go.
So I'm already a premium member obviously, but this will unlock this bite for you to work on if you are not already a premium member.
This here is regarding dictionaries.
So have a good play with this.
Enjoy the challenge.
Work on it in the command line within your browser and do that for day two.
Back for day three, this gets a little more tricky.
What I'd like you to do is a bit different as well.
I'd like you to go into this data.py file which is here in the repo.
And I'd like you to just have a quick look at the dictionary and the lists that are in there.
It is pretty much a list of just the United States states and the acronym used for them.
So what you can do then is complete each one of these little tasks, okay.
It will involve you actioning or working against the list in the dictionary, pulling out data and just playing around with them.
So you'll need to pull them into some, whatever script, import them to whatever script you'll be running this from.
And just remember that dictionaries are unsorted so that should make this a little more tricky.
Alright, so that's your day three.
Just playing around with that data.py file.
Obviously if you want to play around with it in any other way, go ahead, feel free.
But this is just a couple of quick, these are just a couple of quick tasks for you to do that should give you around 15 or 20 minutes worth of practice which is what we're aiming for.
So enjoy, these are your three days and let's get on with the video.
|
|
|
show
|
7:35 |
Lists are actually pretty simple.
They're probably one of the things you're going to deal with the most in your Python journey and the easiest way to demonstrate it is to just create one right here of numbers.
So let's create a stereotypical list, all right.
We do that by using the square brackets and we're going to create five entries in that list.
So this list contains five items.
Okay.
Now, because we're dealing with numbers specifically, we don't have to put the quotes around it, okay.
If we were dealing with strings that's what we do, but we're dealing with just numbers so let's just leave it plain like that.
So that's our numlist.
We'll just call it back so you can see what it looks like.
There you go.
So it's now a list of five numbers, okay.
1, 2, 3, 4, 5.
One of the cool things you can do with a list is you can actually reverse it.
Okay.
So, now need to write some nifty code that will go through, parse it, and put all the values in back to front.
We can just do numlist.reverse() Call numlist back and there you go, 5, 4, 3, 2, 1.
Now we can do that again.
Okay, and we're back to one, two, three, four, five.
Now, if we actually go back, one thing we can do, is we can actually sort the list.
So numlist.sort(), okay.
And there you go 1, 2, 3, 4, 5 again.
And this is very handy because you can actually sort with letters as well.
Now let's say we want to actually print out all of the values inside num list.
How do we do that?
We can use a four loop, okay?
So we can go four num in numlist, print(str(num)).
So we hit enter and there are our five numbers, 1, 2, 3, 4, 5 So it's pretty powerful.
There's with just this basic ideology you can get a lot of stuff done in Python code.
Now one of the other ways you can actually create a list is to call the list function against a certain string.
Let's say we have a string called - we have a variable called mystring.
And we assign it to string Julian.
Okay, so mystring is Julian.
Well how do we convert that into a list?
We simply call list against it.
So list(mystring) is Julian.
And there you go, you see my name has just been chopped up so that each letter, or each character I should say, is now a string value inside this list.
Right.
So, what can we do?
We can assign that so l = list(mystring).
So we're assigning this here to the variable l, alright.
And we'll just call that back.
And it's Julian.
Now what are some interesting things we can do with this?
Well, there's actually quite a lot.
We can actually reference the values by their position, by their index, inside that list.
So we can go l[0] is J.
We can go l[4] is A.
You can see we got J there, we got A there.
Very handy.
What else can we do?
Well there are a few other functions we can call here.
We can go pop, and what pop will do it's actually going to return the last letter from this list.
So, the letter N is going to be returned.
But at the same time, it's going to be removed from the list.
So my name is now Julia.
Right.
We can then insert it back in.
And we use insert for that.
Now when we insert, we actually, if you look at this tool tip here that's cheating, you can see we have to specify an index and then the object.
So what position are we inserting the letter N into this list?
Well, we're going to insert it into position 0, 1, 2, 3, 4, and 5 5 is going to be on the end, so position five.
And what are we inserting?
We're inserting the letter N.
All right, it's an actual string.
Now when we call the list, there we go, it's rebuilt with the letter N.
Another interesting this we can do is we can actually replace any of these with any other letter.
So we can go l[0], which we know will actually return J, but we can replace J.
So L[0] is going to be B.
So, l is now Bulian.
Okay?
Ya, a little play on words.
Let's go with that.
Now if we wanted to get rid of the B, we could actually delete it or we could pop it.
The difference is, as I've said before, pop will return the letter in that position, where as now with the delete option it will actually delete it.
You won't even know what you're deleting.
It doesn't return anything, it just deletes.
So if we want to delete that zero we just have to type del(l[0] and there's the B gone.
All right?
Next we can do l.insert().
We'll choose index position zero.
And this time we'll put an M in.
l is now Mulian, okay.
And now, even better, with pop, let's say we do want to return something, we can go l.pop(), but now we can actually specify a position, an index.
So we can go l.pop(0), we get the M returned, and the M has also been removed from position 0 in the list.
So those are some cool little nifty tricks you can keep up your sleeve, add them to your book, because when it comes to lists, you'll end up dealing with them quite a lot.
So knowing how to pop and how to delete and insert and append, which is another one I'll show you quickly.
l.append(), let's add S.
We can append, append will always add right at the end into the last position.
So definitely keep all of these handy.
You'll be using them quite a lot.
|
|
|
show
|
3:07 |
If you're learning Python you're going to come across two words that may or may not make sense to you, and they are mutability, and immutability.
Okay, type them out on screen, mutability, immutability.
And what do they mean?
Well, mutability means it's something that can be changed, it's an object that can be changed.
You saw in the previous video that we were manipulating the mystring variable, and we were dropping j, we were dropping n, we were doing all sorts of things to that list.
Now, immutable lists, okay, let's just go with that for one second, are lists that cannot be edited, so if you tried to edit it, if you tried to pop out that j, or pop out that n, you'd actually get an error, and they're not actually called lists, they're called tuples, okay, you've probably heard that terminology by now, but we're just covering it again, and I'll just quickly demonstrate the difference between the two.
So we're going to say l, again, for list, is a list of mystring, so we can see mystring is my name, okay, and t for tuple is a tuple of mystring.
So let's just show what the two of them look like.
And the big difference here is you've got the square bracket versus the rounded bracket, and that's the telltale sign that you're dealing with a tuple, okay?
Now watch what happens when we try to edit the two, okay, we can go, l, let's actually overwrite, just like we did in the last video, so, l[0], we're going to assign the word, or the letter, T, so my name is now Tulean, no that wasn't a name I was called in school, so don't laugh, and now if we try and do that to the tuple, we can go t[0], is, let's just go with the B from the other video, and we get this error.
Tuple object does not support item assignment, and that's because the tuple is immutable, we cannot edit it.
We can still talk to it, imagine a hard drive or something, or your SD card in your camera is read-only, that's pretty much what a tuple is, so we can go t zero, we can return that, you know, we can read it, we can talk to it, we can iterate over it we can go, four letter in t, print letter.
And there we go, we can still iterate over it, just like we do with the list, the difference is, we can't edit it, and that is what a tuple is, and that's a demonstration of immutability.
|
|
|
show
|
7:21 |
Alright.
Next up we're going to talk about dictionaries, or dicts for short, let's keep saying dictionaries, just to be safe.
And they're made up of pretty much two different things.
The easiest way to demonstrate it is to just create one in its simplest form.
So we'll create a dictionary called pybites, and let's just add a few things to it.
The first thing we need to add is a key, and the second thing we need to add is a value.
Alright.
Looking at it here, there's a separator here, your colon.
And that separates your key, the key comes first, from your value on the end.
Alright, and this here is technically a dictionary.
It may only have one item in it, but it's a dictionary all the same.
Let's make it a little more interesting.
When you're adding a second item into your dictionary, you separate it with a comma.
Alright, so we've got Julian, now let's add Bob, and let's just say he's 33, then we have Mike, let's say he's also 33.
Let's just say I'm being super generous with those ages guys, anyway, there's our dictionary.
So to view what it looks like, we just type in, pybites.
And there it is there, the three different items.
And these link to each other.
So the key is Mike, the value is 33.
The key is Bob, the value is also 33.
Now notice when we printed it out, it printed out in this order.
Well this order is not explicit.
With a dictionary, when you're passing it, when you're listing it out, when you're displaying it, there's no guarantee that the data is going to remain in the order, okay?
That's very important to remember with dictionaries, they are unordered, okay?
Now let's say we wanted to create a dictionary but we didn't know what values we were going to put into it from the start.
We'll just do a quick little side track demonstration here.
You would start off just as you would do with a list that's empty, except you're using two curly brackets instead of the square ones.
So people is now an empty dictionary.
There's absolutely nothing in it.
To add someone to it, this is the tricky part, this is where it gets a bit different.
What you need to do, you need to actually pretty much in square brackets, you need to choose the key, alright?
In this instance the key for a list of people is going to be Julian, and we're going to assign that key a value of 30.
So the dictionary people, we're creating an entry, a key, of Julian, and we're assigning it the value of 30.
We list out people, there we go, we see that exact same formatted dictionary as we did when we explicitly defined it up here, okay?
We can add to it again.
We can go, people, Bob, and we can assign Bob the age this time of 103.
And there we go.
So same thing, right?
This time we just populated an empty dictionary.
But either way it all comes out the same.
Now the way you interact with the dictionaries is a bit different to lists.
The way we view just the keys, just these keys here, forget the values for a minute, is we use keys.
So we can go pybites.keys, and there are our dictionary keys.
Julian, Bob, Mike.
The same things for the values.
pybites.values, and there we go, the three values.
30, 33, and 33.
Now what if we wanted to see all of this?
Now this is all well and good because we're in the shell.
But if this was an actual application you can't just type in the name of your dictionary and expect it to print out, right?
This is just all standard out through the shell.
So the way we would actually print out, first of all, the way we actually see each pair of dictionary items is to use items().
We can see Julian 30, Bob 33, Mike 33.
These are our three different dictionary key value combinations or items.
Now how do we pass over all of that?
Well we do it just how we would with a normal list.
We can go for keys in pybites.keys, print keys.
There we go.
We can do for values in PieBites.values, print values.
Okay?
This is all very similar, you can see the similarities between dictionaries and lists.
But last but not least, what if we want to print out all of this information, not just keys, not just values, without having to run two separate for loops, which would be quite un-Pythonic right?
Well, God love Python, we can go for keys values in pybites.items(), so for keys and values in PieBites.items Print keys, and remember we have to do the string thing here, values, and there we go.
Julian 30, Bob 33, Mike 33.
Now obviously that is not very pleasant on the eye, so we can do our standard string formatting.
So we can go, for keys, values in pybites.items(), print, string is digit years of age, keys, values, okay?
And there we go.
We can see Julian is 30 years of age, Bob is 33 years of age, Mike is 33 years of age.
And that's dictionaries.
It's actually that simple to iterate over dictionary, and that's pretty much it.
You've got your key, and your value.
And you just do it over and over again, just like a list.
So enjoy your dictionaries, and get used to them, because you'll be playing with them.
|
|
|
show
|
3:26 |
So that's Python data structures.
I hope you enjoyed that little overview of lists, tuples, and dictionaries.
For the next couple of days, you will be working through the exercises outlined in the three-day overview which was the second video for this lesson set.
But before we get to that, let's just quickly quickly recap everything we've done.
So for lists, lists can be sorted with sort, go figure.
And then worked through how to iterate over a list using a for loop.
We also discovered pop.
Okay, if we remember, pop just returns the item in the index specified.
It actually removes it from your list and then returns it.
del simply deletes it from the list, doesn't even return it.
insert does exactly as its name implies.
It will insert the second argument into the index specified in the first argument.
And then append will just tack whatever it is right on to the end of the list.
Now immutable tuple, okay, we know that this means we can't edit, it can't change, okay.
So we've got a tuple.
We've created it using tuple itself, okay.
Now we print out the contents just so you can see that we have the six items in this tuple, my name, the letters of my name.
And then when we try to manually override it with a simple list substitution there, t[0] we're going to assign the letter m and then we get the fact that it's a type error, it's a tuple.
You cannot change it, it's immutable, okay.
Now onto dictionaries.
We created it manually.
We manually created a dictionary, okay, simple.
And then this is how you return the keys using .keys.
Okay this is just the keys at the front, just the names.
Then we returned the values in the same way that we do with the keys.
We can get just those values, the 30 and the 33s.
And then we can get everything as a whole.
We can get each item, so the key and the value.
We can do that using items().
And then we showed you how to iterate over, over the item itself so we can get the keys and the values, not just one or the other.
And using a forloop, we can then substitute those keys and values into some sort of a string, into some sort of text.
And that's really useful, something you'll probably do quite a lot.
Okay, your turn.
So for this next couple of days, as we discussed in the ReadMe earlier, we are going to work through the code challenges bite that you have a free code for so go ahead and use that.
And then for day three, you're going to work through that data.py file which in the repo.
So if you have any sort of thoughts on that or any confusion on that, just head back to video two where you look at the ReadMe and there's a good explanation there as to what you're going to do for days two and three.
So that's Python data structures.
I hope you enjoyed it.
Keep calm and...
|
|
|
|
43:49 |
|
|
show
|
0:48 |
Welcome back to the Hundred Days of Python.
In the coming three days I will show you how you can test the program with pytest.
It's a popular testing framework, often preferred over the standard libraries unittest.
And you will see why.
For this lesson I prepared a guessing game, which lets you guess a number from the command line.
And although is a simple program, it has a lot to offer in showing how to use pytest, for example to validate errors, capture standard output, mocking certain functionality, and more.
By writing the test, I will also show you how you can use coverage, to see how much of your code base, or in this case, the script is covered by tests.
And by the end of this session, it should be easy for you to write tests for your code, an important skill.
|
|
|
show
|
2:07 |
Before getting into the nitty gritty, why do you want to test your code?
And here I have a useful link that introduces testing in Python, and from my own experience I think the main thing you want is to have a regression test suite.
As your software grows, it becomes more complex and you need to make sure that all the previous code keeps running.
If you have a suite of tests that are fast and you can run every time you make changes, you have a much more reliable application.
Down here, what I like about this link is that there are rules about testing, and I'll highlight a few.
So every test should test one thing and be small and independent.
One test should not influence the other test.
And set up and tear down, which we will see towards the end with fixtures, is a way to guarantee that.
Tests need to be fast.
Your test suite will be growing, and you will run them often.
You don't want slow tests to delay your development.
Testing should be automated.
Again, because you run them often, it should be as hands off as possible.
Fixing bugs.
If you find a bug in your application you usually want to write a test first to show that the bug, or even document the bug, and then fix it, and then you always have that test to verify that that bug does not occur again.
And there are couple of other items.
This is good link to go through when testing is really new to you.
There are various frameworks in Python to facilitate you writing tests.
We have unittest, doctest, pytest, hypothesis, and tools like talks that lets you test various configurations or environments, unittest2, and mock.
In this lesson we are going to focus on my favorite, which is pytest.
pytest is a framework that allows you to write test for your Python code, and it specifies a set of rules, and it has a couple of features that really helps you write better test code.
Alright, enough theory, let's move on to the next video where I pip install pytest and pytest coverage, and we look at the example for this lesson.
|
|
|
show
|
3:21 |
Let's make a virtual environment and install pytest and also pytest coverage, which I will use to show you how much of the code is covered by tests.
Let's head over to my terminal and make a virtual environment, and I'm using Anaconda, so I'm pointing virtualenv to the Python binary in my Anaconda path.
As by convention, I use venv for all my virtual environments, that I can just run this.
Then I have another alias, ae, which will source the venv activate script.
So that's basically enabling my virtual environment.
And we have nothing installed, and let's now install pytest and pytest coverage.
Let's look at that little guessing game we're going to write test for.
It lets me guess 5 times, a number between 1 and 20, and it will feedback if I'm too low or too high.
That's funny.
9 is too high.
Wow, I'm a good guesser.
Right.
You see here, there are some validations we need to do.
So a number I cannot guess again, I need to have a valid number, I need to have a valid range and I cannot just do strings.
So that is all stuff that's in that program I will show you next and we have to write test for.
And we have 5 guesses.
Right.
So here, I didn't guess it, and it bailed out after 5 times.
So that's the program.
Now look at how that looks in code.
So we have to max number of guesses, the start and end of the range, we have a function to get a random number, using the random module.
So we have to constructer that sets the guess's internal set, sets the answer, and it sets when bullion to falls.
Then we have the guess method which takes a user input and see if there was actually a number, if it was an integer, if it was in the range, and if it was already guessed.
And if nothing bails out, then we can add it to the guesses set, and return it.
Then we have an internal validate guess method, which just sees if the guess equals the answer, otherwise, it gives feedback if it's too low or too high.
If a property of number of guesses that's basically just the length of the internal guesses variable, and there's a dunder call which makes that I can instantiate the class and call that object as if it was a function.
That will initialize a while loop, checking if the number of guesses is below the limit, try to get a guess, check for a failure error, print that and continue, validate the guess.
If there was a win or done, make sure that the print guess or guesses, reset the win to true and re-break.
If the while loop exits without breaking, then we know that you have guessed the maximum number of times and you didn't find it.
Although some people are against this, I do find this construct useful in this particular case.
This gives us a nice playground to start using pytest.
|
|
|
show
|
3:17 |
Right, before diving into writing tests for that program, let's just quickly look at how to write a test with pytest in the first place, and how to run it from the command line.
And first of all I want to contrast it with unittest, which is in the standard library.
So here at left you have a super simple program, it's almost ridiculous.
But it's Hello name, takes a name and just returns the hello name string.
And look at the amount of code you have to write in unittest to get a test for that running.
Because it's class-based, so you have to subclass another class, write a function, and use a self.assert notation so let's show that next.
Alright, so import unittest, import the program, make a class, inherit from unittest test case, write a method, which needs to start with test to be recognized as a valid test, use self.assert equal notation, call the function, and check for hard coded output.
If the files run as a main script, call the main method on unittest.
Right, and it works.
And it fills if I change the return, and that's good, and notice that pytest can run unittest code, so pytest can be run from the command line, without any switches, if you'll look for files that start with test, and run the methods or functions in there that start with test.
So that means that I can even leave out this main block and it should still work.
Right, but here comes the first benefit of pytest is that you can write test code in a much shorter way.
I don't need unittest, I don't need the class, I can just define functions.
They do need to start with test, and instead of the self.assert equal, I can just use the classic assert.
And this should work.
It does not.
Self is still in the program because it was still in the function.
Same output.
Make it fail, and here is the second advantage of pytest.
The output is much nicer.
unittest was definitely not bad, but pytest, especially if you go into more complex operations and errors, it's a great debugging tool.
So look at that.
Instead of what was it?
Oh that doesn't count one two three, well it was still short because this is an easy program, but you can already see that this is way cleaner.
So that's the simplest of pytest programs and I just wanted to show you how it differs from unittest and how you can run it from the command line.
Just the basic steps to get you up and running.
|
|
|
show
|
5:29 |
Alright.
Back to our guessing game.
So, how do we want to test this program?
Ideally, you want to test one function or functionality in one pytest function.
So let's start with the Get Random Number.
I'm going to open a file test on the scoreguess.py.
Again, using pytest I have the convenience to not having to import any module to run the test.
What I do need is to import the actual program.
So from guess import get random number and the game class.
Now, one thing I want to show you in this video is how to mock an object.
Because Get Random Number, as you can see at the right, uses a random integer from start to end.
And random returns to something randomly every time.
So how do you actually test that?
And the way to do that in testing land is to mock an object.
And for this I'm just going to use the unittest patch method on the mock module because it's a perfect fit for this scenario.
So from unittest.mock, import patch.
I actually need to import to random module because that's the one we're going to mock.
And you can use it as patch object and that's to random module.
Just specify the function or method you want to patch.
And then in your test function you can pass in an argument and you can give that argument a fixed return value.
And that's key because instead of having random return something else every time you can give it a fixed value.
So it's kind of an override of what randint() normally does which is randomness.
Now we're saying every time random gets called it gives us 17, and it makes that at least we can call our function, which is get random number, and we know that it returns 17.
Yeah, and this is pretty basic, but it should show you how you can override certain things in your program you cannot really control and I have another example later about the input function where we ask for user input, which is another area that can be anything, so you want to mock that out.
So with this code written, let's go back to the command line and run this test.
And I'm using Control Z on a Mac with foreground to toggle back and forth between my file editor and the terminal.
And here I can just run pytest, and that's funny because the previous example I put in a hello subdirectory and it's actually cool that we see this because pytest is smart enough to look recursively for test files.
So in this case it found two and ran them both.
So I'm going to move this out to somewhere else, because we now want to focus on the guessing game.
And yeah it runs fine, and what I also want to see from now on is how much coverage we have of our tests.
So we installed pytest-cov and to use it was a bit of a trial-and-error for me, but I found this syntax to work well for me.
So I want a coverage report term missing coverage dot current directory.
And the term missing is cool because it starts to index all the-- okay, I actually have to give it something more specific because it starts to look in my virtual environment.
Alright, what I did was in the end moving the files into a subdirectory so we got our venv and we got our guess new subdirectory with the script and the test file in there.
And when I specify a subdirectory in the minus minus scuff argument then it just rounds on our code, and what's cool about the missing argument is that it shows the lines in the code that are not having test yet, which is of course is a lot because we just got started.
But even so, we have 24 percent coverage so we are up for a good start.
And you can then map those lines back to the actual program so this is not tested 29.
This is not tested, et cetera.
One final thing, as I use Vim I'm going to use the coverage command quite a lot so in my Vim RC, which I mapped to VRC to edit it, I have a comma T which maps to save the file or run a command with the exclamation mark and then I run this command and I'm going to-- yeah, I think that's fine because we're going to work in the guess directory from now on and the venv is not sitting there so the dot should work there.
And we can confirm that by going into guess, run a test, run a coverage report with a dot.
Yeah that's fine.
So when I'm writing my tests, I can just hit comma T, it saves the file and it runs my coverage.
So that's a bit of Vim trick or shortcut for Pycharm or another editor.
There must be a similar way to do this but this is my way of running coverage with one keystroke in Vim.
|
|
|
show
|
5:06 |
The second thing I want to test is the guess method.
It takes a user input and input is not static, you can change and it can be random.
Even worse, when you run this program it's waiting at the prompt to get input so your test would hang, quickly demo this.
Let's make a game object, and run it.
Actually it's not hanging, it's throwing an error, pretty soon, reading from standard input output is captured, so that's cool.
And look at the output, it's pretty verbose which is a nice feature of pytest.
But anyway, we definitely don't want to use input literally in tests, so I'm going to use patch again.
And I'm going to patch the built-ins input, and this is another way of marking.
Here I can give it side effects.
And a list of expected returns in a row.
Because I'm having all these exceptions here, I'm going to give it a bunch of inputs to go through all these scenarios and see if each scenario throws the value error or accepts the guess as a correct one.
And will also show you how you can check for exceptions in pytest which are important because raising exceptions is a common Python pattern.
So what we're doing here is setting up a sequence of return values as if input was called that many times.
So it will return a 11, then 12 as a string, then bob, then 12, then five minus one, 21 seven and None.
And those are the values that we're going to work with, and you have to give it an argument, it can be called anything.
And now we have some return data from input to work with.
So I'm making a game, and again, the constructor sets defaults for all the internal variables, so that should be fine, and then I can start to make assertions.
And the first two side effects or returns are good.
and again I will show you guess, so guess goes through getting an input, looking for all the bad inputs and raise a value error if so, and if it's good it ends up adding it to it's internal set which is the underscore guesses, and returning the guess.
So 11 is good, 12 is a string should be fine because that can be converted into a int.
The second one, bob, is not a number.
And the way in pytest to check if an exception is raised is to use pytest, and you need to import that, and do a with pytest.raises, the name of the exception and then the statement that would trigger that exception.
So the next return value from input in the row is bob's string, if I call guess with that it should raise a value error and we're telling pytest to check if it actually raises that exception.
And the same is true for the next one with is 12.
If I guess again, the guess is already in the guesses set and the function manually raises a value error.
I can just copy this and it will be the same.
So every new call of guess triggers this input statement or call, which triggers a new value in the return list.
So 12 is done, five should be fine.
Right let's run what we have so far because it's a lot of code and see if it works.
All right that looks good.
So now let's do the complete list again.
And after five comes minus one and 21 which should be two exceptions because they are out of range.
Another good one, and finally None should not be a good one, that falls into this one, if not guess raise a value error, please enter a number.
So we wrap up with...
So that's save, Control + Z, pytest you're still happy.
I mean if it would say...
Game guess returns None when given None it will fail.
So we have please enter a number so it actually raised a value error, and it was not catching that.
Here I do, and it works.
So that's how I use mocking to circumvent this input function waiting for input.
I'm going through all these scenarios by giving various side effects.
Next up, validate guess.
|
|
|
show
|
4:50 |
The last video I forgot to run my coverage report, so let's do that now.
So I'm in test, and we see an improvement.
We went from 24% to 56%, and it still shows the missing lines, which are going further down into the script.
So let's continue.
Next up, validate guess.
And the doc string says: verify if guess is correct?
If so print, guess is correct, otherwise it's too low.
Whoops.
Guess is too high or too low, depending what it is.
And it returns a boolean.
So let's write: def test, validate guess.
And I'm going to show you another feature of pytest, which I will explain you in a bit, which is capfd.
And that will capture the standard output of the program and execution.
Very useful because for this method, I not only want to check for the boolean return value but I also want to see if the actual output by the function to print, that the function does because we made this a game, prints to the console and I want to have accurate information for the user.
So let's make a game.
I set the answer.
So let's validate that one is not a winning number.
Validate guess.
So I call this with one.
One goes into this method.
It checks against answer.
If it's answer, true, if it's not answer, false.
And to say false in pytest, you can just say, assert not this method is truthy.
So this return false, not false is true.
So let's run this.
And that one passes as well.
Then of course it's easy to do the same for higher an assertion.
So if it's three, it's still not good, and if it's two, it's good because that's the answer defined.
And now back to capfd.
If I actually want to see what the print is printing to the console, because that's what you see before, if we run the game.
It's printing these kind of feedbacks to the user.
So I want to test if these are what I'm expecting.
And one very useful trick is to redirect the output, standard output, the error I just throw away and I use capfd, which I passed into the function, and I'm calling its readout error: method.
And let's just see what that gives me.
I'm not going to do this for now.
If you want to print inside your test, one way with pytest to show that to the console is to add the -s.
And that actually stands for: shortcut for capture equals no.
So it's not capturing the output, meaning in this scenario it prints it to the console.
So when it's been intermingled into these dots but this is the actual print statement, there's also a new line.
So one is too low.
I captured that in the output variable, which I printed to the console.
So capfd is very cool to capture output printed by your program.
And now it can make assertions on that, as on any other thing.
So I can say, out, and that's strip of the new line, right strip equals one is too low.
Save, control z, pytest, and it worked.
And if I would say too high, it would fail.
And look at that nice output.
So that works and I can do the same for the other two.
So let's just copy this.
Too high and two is the right answer.
So in that case, two is correct.
Let me just not do it 100% correct I you'll see.
Oh, one is too high.
Oh sorry, this is three.
So you'll be targeting a lot between running tests and writing test code, that's something you need to make a habit of.
Still something bad: assert not true.
Wait a second.
Ah!
Typical copy and past error.
Ah.
And here, it's nice how pytest shows that, not only the diff, but also, the actual character that's missing.
So that's now very easy to spot and fix.
There you go, we are green again, and let me run comma T.
Wow we have 68% coverage now.
|
|
|
show
|
7:22 |
Alright for the final two test methods that I actually want to run a whole game from end to end.
And I'm going to use the same technique as before because we're still stuck with this input method that requires us to input data which we don't have in an automated way of running test with pytest.
So I'm going to do a patch of the input again and I'm going to just simulate a whole game.
So I'm going to enter 4, 22, 9, 4, and 6.
They're going to play a win scenario and I'm going to give it the input which is the requirement of the patch but I'm also going to capture the standard out as I did before.
So I make a game.
And I need to give it a right answer to make sense of these numbers.
So in this scenario win but at the fifth attempt, which is 6.
So the answer is 6.
I call the game and assert that the game state is underscore win equals true.
Let's run this.
Okay.
So what it actually did, calling game, is it went through all these numbers and when it got to the final one, the fifth attempt, it asserted answers true, so the win was set to true.
And again, you can see in the call, an actual look that when validate guess returns true, which is on the previous test, there is an intermediate variable win set to true and it also sets the inner, or internal variable win, to true.
And that's what we are asserting here.
But what I'm also interested in is how the output looks of the program.
So I can just again do capfd, read out err, and you can also just call this with zero indexing then you don't need the throw-away variable at all.
And I have a bunch of expected states which I'm going to copy in.
Let's actually assimilate this program.
So I have these steps I'm just going to hard code the answer for a minute, 6.
So these are the steps.
So what the test is doing is pretty pretty cool.
So I'm simulating 4, 22, which is not in range.
9, 4, 6.
So here you see the typical program, and that's what we are asserting here with these expected values.
So 4 is too low, number not in range.
9 is too high, already guessed.
6 is correct.
Plus an additional statement of it took you three guesses.
So let's reset this.
Let's clean the output from capfd a little, with a list comprehension.
For line in out split by new line.
Only take lines with one or more characters.
So ignore blank lines basically.
And give me the strip lines.
So I'm stripping off new lines.
Alright.
And then we can just match it line by line.
I can use a zip to look over two sequences.
So you have line and expected in zip output and expected.
So this will look over expected and look over output in parallel.
So the first value of output would match the first value in expected and etc.
Alright.
Look at that.
What's my coverage?
94 percent, very nice.
So they're only a couple lines missing: 83, 87, 88 And 87 I'm okay with because this is just a calling code if this is called as a script, which we've done before, if I call it like this.
And line 83.
Let's see if we can get to this scenario as well.
So this is a lose scenario, where we tried it 5 times and still did not assert the answer.
So let's set up a filled scenario.
Test, game, lose.
That's going to follow the same signature as above.
But I need more stamps.
So let's do a none, which should not count right away.
5, 9, 14, 11, 12, doesn't really matter because what I need to do now is to give it an answer that's just totally different.
So let's make a game.
And the game answer is 13.
So it's not in all my guesses.
But this also test that none doesn't count towards my guesses.
So I can actually do 6 inputs and this would be the fifth guess.
So I'm actually getting here in the first place.
Play the game.
I won't win this game.
And it should pass, right, but the coverage should still be the same because I'm not hitting that line yet.
I do.
Yeah, I did.
So just to recap, this was line 83, which corresponds to this line.
And what happened here, I played, actually what I forgot is that this plays the whole game.
When I launch game, it goes through all these outputs.
And having guessed 5 times, and not asserting this answer, I did get to the L's block.
I can actually show that.
If I turn on non-capture mode.
See?
It just prints the whole thing.
5's too low, 9 is too low, then I guessed 5 times.
Answer is 13.
So I made it to this actual print statement.
And that was the final thing to actually increase the coverage.
If you take main out, we have a 100% coverage of our tests.
You still need to have a critical eye to your code and your tests because one thing is to test it, but, for example, I can get a 100% on this earlier validation of the guesses, sorry, this one, but here I made sure that I'm going into all the different kind of value errors.
Actually let's do an experiment.
If I'm not doing the not-a-number test, would my coverage go down?
Wow, look at that, how cool.
So I took a test out and now it's complaining that 35 and 36 are missing.
And 35 36 is they should be a number, and that's the thing we just deleted.
So I had a string here, and that not-a-number should raise an exception.
And coverage spotted that.
So that's very cool, that you can just pinpoint exactly which code is not being tested versus which code it is.
But again, you still need to have a critical eye of what you're testing.
Because one thing is to have all your lines, some were called, but the other thing is how you call them.
What are you testing?
Are you testing all the edge cases?
So testing is an art in itself.
|
|
|
show
|
5:06 |
1 final thing is when to write your test.
I think the motto "having tests is better than no tests" is the most important, but there is a whole style of test driven development, which is to write your test before your actual code, and to drive your design by those tests.
Let's write the Fizz Buzz program, which is a children's game, and it basically is a sequence where numbers divisible by 3 and 5 return Fizz and Buzz, and if they're both divisible by 3 and 5 it returns Fizz Buzz.
So let's write that program, but do it in a TDD way, by writing the tests first.
And I'm going to use the repetitiveness of these tests to also show you a nice feature of pytest, which is parameterize.
So let's do it from the ground up.
Test Fizz Buzz.
So let's give it a number, and it should return Fizz, Buzz, or Fizz Buzz, or number, right?
So if I call it with 1, it should return 1.
If I call it with 2, it should return 2.
3, Fizz.
Actually let me stop there.
The TDD way would be to fill at the earliest possible way.
And just start adding code in small increments.
Alright, so now it is recognized, but it takes zero positional arguments, but 1 was given.
So here 1 was given, but I'm not accepting 1.
So let's just hard-code that here.
And now the return's None.
So let's just return 1 for now.
And the second test fails, so let's then decide to return N.
And then if it's 3, it should return Fizz, okay, so we need some sort of if statement, right?
Alright, that works, okay, let's move on then, 4, 4.
That still works.
5, That's not working, okay.
And let's accommodate that, return Buzz.
And we're green again, cool.
And you already start to see a lot of repetition, right?
Now there's a cool feature in pytest, called parameterize.
And let me just copy over the whole test.
So I can give that a list of tuples of argument, where I call the function with, and the return value.
And then in my test, I can just do this 1 time, call Fizz Buzz with arg, and test it against return.
And look at that, how I put all the parameters in a decorator, and I avoid having to write assert, assert, Fizz Buzz, Fizz Buzz, Fizz Buzz, over and over again.
So this is pretty neat.
I think you will find a use guys for this.
I need to pass them into the function.
And I see that Fizz does not assert Fizz Buzz, and that this particular call, so if it's 15, it should do Fizz Buzz.
There are various ways to solve this.
Let's do here, then return, Fizz Buzz.
As these are returns, I don't need an elif, because these are like, or early return, or continue.
So let's see if this works.
And this works.
And notice that it's also nice that pytest gives a dot for every parameter test.
If 1 would fail, how would that look?
Ah, we already saw that, right?
We still get all the dots, and you see the actual position of the tuple that failed.
And that's also, again, nicely indicated by the output.
Alright, so, this was a little bit of TDD, and also, a nice feature of pytest, parameterize, that you probably want to become familiar with.
|
|
|
show
|
2:27 |
Let's review what we've learned so far.
In this lesson we used a guessing game to write pytest.
And the game went like this.
There were a maximum of 5 attempts to guess a number and you got feedback if the number was too low or too high.
We compared pytest to unittest and saw that it's pretty succinct.
For unittest you need a class and self-serve equal syntax.
pytest just lets you write functions.
And this is a very simple example, but you're already see that pytest requires far less code.
pytest has nicely formatted outputs.
For example, if a fail, then we pass.
We saw pytest code to show how much of our code was on our test and where tests were missing it showed the lines in our script.
We saw mocking in action, by mocking out the building input.
Because we wanted to control what the input function returned when playing a game.
We also saw an example of mocking out the randint() function.
We also saw how to test exceptions with pytest, which is pretty easy.
And we saw how to get your outputs from your program using the capfd.
And that's nice because then we can check if the output was as expected.
And here we have a complete game, wrapped into a test.
And then we did some TDD on Fizz Buzz, writing tests, writing a bit of code, writing for more tests, some more code, some more tests and some more code.
And notice here we used the parameterize feature to prevent duplicating a lot of test code.
So it takes a list of typals and in the body of the test function, I can just do one assert.
So, that's how we kept it dry.
And again, the output is very nice.
Alright, that was quite some material to take in.
I hope you are more comfortable with pytest now.
And now, it's your turn.
Keep calm and code in Python.
|
|
|
show
|
2:20 |
Welcome back to the hundred days of Python.
This is day two of the pytest lesson.
Yesterday, we went over quite some concepts, and now it's time to get practical.
So here, I pointed to a code challenge, which is, not surprisingly, writing tests with pytest, and it consists of going through your code, see where tests are missing, and add them.
Another option is to test a Flask API, or even contribute to open source.
There's a lot of great work being done, and not all might have test coverage.
It might be a useful way to get into those projects, to start adding tests.
So basically that, if you want to follow along, you can clone our challenges repo and make a branch and PR your work, because we're always curious to see what you come up with.
Another way, if you want to just look at some tests, is to head over to our bites.
Every bite is tested with a couple of pytests, so each bite under the tests tab shows you pytest in action.
And a day generator...
And here is the exceptions being tested by pytest again.
One syntax we did not see is the pytest .fail.
This basically where it raises an exception when it should not have, alright.
Then I want to point you to one more resource and that's Brian Okken's Test and Code.
He has this podcast dedicated to testing in Python and he is the author of Python Testing with Pytest which is a great book.
I only showed you a couple of things.
This book goes in detail on how to set up pytest configuration, fixtures, and a lot more.
So if you're serious about pytest, this is a great resource.
And that's it, today is all about getting practical and tomorrow I'll check back in with you how it is going.
Good luck.
|
|
|
show
|
1:36 |
Welcome back to the 100 Days of Python.
Day three of pytest.
And the final day where I want you to get some more exercise.
And in all honestly, I recorded this lesson and something was bugging me.
Fixtures.
I mean, fixtures are described as the killer feature of pytest and I did not cover them.
But no worries, you will learn them today.
I made this article explaining everything you need to know to start to use them in your test code.
And okay, it's a pretty long article, but it's not too hard to actually learn and do.
There's a practical example in this article.
If you read through this, then you will see that it's pretty easy to set up.
But it will make your test code a lot better.
So, I ask you today to come up with a use case, so it can be to set up and tear down a database, but it doesn't have to be a database.
It can also be an object of any kind, a class, or something that requires setUp and tearDown or even only setUp.
But I really want you to try to learn this skill.
As you know from unittest, setUp and tearDown are commonly used, and pytest fixtures are the way to do that.
So it's critical to understand this.
That's another day of practical exercises and I think by the end of this day, you'll have a good grasp on pytest.
Which will go a long way, because as we mentioned before, writing test is a very important skill.
Good luck and let us know what you come up with.
Use the #100DaysOfCode and feel to include Talk Python or PyBites in your tweets.
All right, have fun.
|
|
|
|
27:09 |
|
|
show
|
1:33 |
Michael Kennedy here and I'm going to be your guide for the next three days.
We're going to have a lot of fun working with classes and objects.
This is one of the fundamental ways to model things, concepts in your application.
And you'll see that classes very naturally map to sort of real world ideas and more general stuff, that gets more specialized like, say, a car versus a Ferrari.
Right, a car is this general idea.
A Ferrari also is a car but a more specialized type of car.
And we're going to actually build some really fun games.
We'll build one in the demo and then I'll hand off a separate game for you to build.
So we're going to build this little Dungeons and Dragons wizard game.
It comes in just says, "Hello, it's the wizard game." And we have this wizard, Gandalf.
And he will encounter various creatures in his little world.
And he has three options: he can attack, or run away, or look around.
And so you can see we're entering various commands.
R, A and L.
So, first we run away and then the wizard sees a bat.
It's not very strong so he thinks he can attack the bat and win.
He does.
And was very, very close actually.
They basically hide but he had the element of surprise, so he beat the bat.
And then he can look around and see what else is there.
The toad, the tiger; not so scary.
Level 1000 evil wizard then he's probably getting away from that thing.
Alright, so, this is what we're going to build and we're going to build it by modeling these ideas in this little game using classes.
|
|
|
show
|
3:00 |
Before we actually write the code and get into the syntax of working with classes, I want to just talk briefly about the idea of two things: inheritance and the difference between classes and objects.
So, in our game we have this concept of a creature, how it'd be like the tiger, that would be, say, the dragon, the bat that the wizard defeated, things like that and in fact, the wizard himself is also a creature.
This creature concept has the basic ideas of what it means to be an actor in the game.
It has, let's say, a level, a name, and it can sort of defend, at least against being attacked.
But we can, say, well, there's special things in the game that have more distinction than that.
So, there's a tiger, maybe the tiger has a special way to defend and so its mechanism for defense, it's a little bit different than, say, a toad or a standard creature.
We have a dragon, maybe the dragon takes into effect whether it can fly, whether it has scales, whether it's fire breathing, things like that.
And this aspect of the dragon means we probably need to model those features that make it different from a creature separately.
So it's like a specialization of this creature.
Now also, the wizard itself.
When you model like this, you're modeling what's called an is-a relationship.
So, the tiger is a creature.
The dragon is a creature and so on, right?
So tigers are creatures.
So we're going to model this type of thing and I'll show you how simple this is to do in Python.
The other important distinction to make over here is, let's look at this wizard concept.
You need to think of these classes that we're going to define.
I haven't shown you how to do it yet, you may know but if you don't know, you got to think of these as blue prints.
Let's think about a tiger for a second.
There's a tiger that's in the San Diego Zoo, there's a tiger that's in the wild, in the jungle.
These tigers were created from the same blue print, from the same DNA.
That's kind of like the class.
But the actual tiger in the zoo and the tiger in the forest, those have different properties and they evolve in different ways over time.
They're not exactly the same thing.
So you'll see, the same thing is happening here in codes.
So we have this line gandalf = Wizard() and this line is going to create a new wizard from the blue print of the class.
It's going to create what's called an object.
And over here we're going to have sort of in memory this thing, it knows it's a wizard and it knows its name is Gandalf, and it's Level 70 and those can change, sort of on their own.
But the evil wizard we're creating, it's going to be a separate thing out there in memory called evil wizard with the name and the level 100.
And once they're created they can be changed and evolve independently like the wizard that is Gandalf can level up to 71 and it would have no effect on the evil wizard.
The thing at the bottom of the two arrows, the wizard Gandalf and the wizard that's evil, those are objects.
The modeling blue print thing at the top, those are classes.
Hopefully that illuminates the confusion around those which is always hard when you're getting started.
|
|
|
show
|
2:43 |
Alright, let's write some code.
So, we're going to begin this first part of our demo by simply creating the general skeleton and flow of our application.
We're not going to actually do anything with classes at all, but we're going to get it ready to.
So, let's come over here and add a new Python file.
I noticed there were none at all, and I'll just have this called program.
In here we're going to define a main method, oh, I've got to configure this, hold on.
Alright, now Python is happy.
So, what we're going to do is we're going to do a little print the header and that's just going to show these methods don't exist yet, but just think about the ideas.
Then we're going to run the game loop, okay, and it's going to go around and around and run.
This concept of a game loop you'll find out in a second, but let's put this print header here first.
Now maybe we'll put something more interesting here later, but for now, we'll just do like a little line and something like, wizard game.
Or, something like that, that should look pretty decent and maybe a little divider there, as well.
Then, for our game loop we're going to come in and we're basically going to create the various concepts in the game.
We'll create a number of creatures, we'll create our hero, then we'll just say while true, we'll sort of like ask the user for action.
Then we'll say like if win or exit, and we'll just brake out of this loop and then we'll just say print, goodbye.
Alright, so we just go around and around, and keep asking the user to sort of control the hero.
Do you want to attack?
Do you want to look around?
Things like that.
Now, there's a bunch of writing here that is actually not super interesting for you to watch me type it out.
So, let me just paste a little bit of code here to a more full featured version of what I just described.
There we go.
So, now we're going to come in and we're going to create our creatures.
We don't have any creaturs yet, remember we have to model those with classes and that's one of our primary goals.
We're going to create a hero.
We're going to go around and around, we're going to grab randomly, choose one of the creatures to appear.
We're going to print out details about the creature that has appeared.
Here's the input asking the user do you attack, run away, or look around.
Like what is your hero going to do, and then we just check.
Do they type A?
Do they type R?
And so on.
So, this not super interesting yet.
I'll put a little pass here to show it's not upset with that section there.
It's not super interesting yet, because we don't really have a hero.
As you can see right here, and we have no creatures.
So, let's go and model that next.
|
|
|
show
|
9:02 |
Okay, so here's our general program.
Let's put that aside for a minute, and go work on the various creatures that we're going to model.
And I'll call this actors to kind of say, here's where I'm going to put a creature, the wizard, and so on.
So what we need to do is create what we talked about, something called a class, and this is going to be the blueprint of a creature.
So, the way you create a class in Python is really straightforward.
You say class, and then you say the name of it.
Okay, we're going to model everything at the lowest level as a creature, and use a colon to define the block that is the class, like you do all the various blocks in Python.
Now, there's a couple of things which we can do to get started, but, commonly, you want to store pieces of data and behaviors with the creature.
So, for the data part we're going to use what's called an initializer.
So we'll say def init, and there's this dunder init, in fact if I say double underscore, these methods are called dunder because it's double underscores on both ends.
These are all part of what makes up classes, and they all have special meaning.
The one that we care about is this init.
This is very common.
So down here, we might want to have a name for it.
Equals, let's call it, toad, and it might have a level.
And the level of the toad is 1, or something like that.
Now, this is not really helpful because every creature is going to be a toad of level one.
So what we can do is, we can when we create them say, this particular creature is a tiger, this creature is a bat, and so on, and so we could pass in the name here, and we could pass in the level.
So we're going to go like this.
So, here we've defined this blueprint.
What is a creature?
A creature is anything that can be created and given explicitly a name and a level.
We could go farther and give those types, as you can in Python 3, but we're not going to do that right now.
The other thing, this is the data part we have so far, the other thing is going to be some kind of behaviors around it.
So, a creature, can, let's suppose that one creature can be defensive against some kind of attack.
So we could say it like this.
So the creature's going to roll a defensive roll.
And now, you might want this to be somewhat based on the creature's level.
So let's create some sort of randomness.
Let's say roll equals, well I'll go over here and we'll say random.
Now this comes from the standard library so we have to import it here, put like that at the top.
Then we can say randint(), and you give a lower bound, of let's say 1 to 12, and if you want to know whether this goes from 1 to 12, 1 to 11, and things like that, we can say view quick documentation.
And what does it say?
It returns a number such that A, the number that comes back is less than or equal to the upper and lower bound.
Perfect.
So this is our, let's say, 12-sided die.
And then we'll return roll times self.level.
Anytime you want to refer to your own items, your own values, you have to say self dot.
So to get back to this, we say self.level.
Alright, so this is going to be some kind of defense here.
Now let's go and create our various creatures in the game.
There's this little to do here.
We had a couple of things, we had a bat, we had a toad, we had a tiger, we had a wizard, an evil one, and so on.
So we'll type creature and of course we have to import that at the top here, just like any type.
We go like this and if I ask Python to show me the parameters, you'll see it takes a name.
So let's call this a bat, and this is a level 5 bat.
I think we had a toad which is a level 1.
And we had a tiger which was level 12, let's say.
And we had a dragon, which is a level 50.
And for now, I'm going to put it this way, evil wizard was a 1000.
I think that's what it said.
Okay, so if we just run this and we could print out our creatures, we need to make sure that we're running the main.
Remember, up here, at the very top, we wrote this, but at the bottom we have to do our little main.
Like this, to say are we running this script as a program?
Or are we just importing it?
If this is true, we're running it as a program, then we want to invoke our main method.
So let's go over here and say run, and there's some stuff that went a little bit crazy somewhere along the way because we didn't finish it.
But here, you'll see that we've created a creature object here, and a creature object there, and so on.
Our little creature part worked, but then the code that we sort of commented out below, isn't quite done.
So this is close, but remember I said you might want to have special features.
So let's just focus on the dragon for a minute.
You might want to have special features that take into account the scaliness, the fire-breathingness, have a different mechanism for defense, and so on.
So let's say we're going to have a class called dragon.
And the dragon also is going to have a defensive roll, like this, and maybe the dragon also wants to have this information.
Woops, copy that.
So the dragon is going to go like this, and then it's going to copy it, and this seems really, really tedious.
It is and I'll fix it in just a second.
You'll see that we can model this differently.
But when we create a dragon, it will have this.
And let's also say that it has a scaliness factor and breathes fire.
Alright, so we want to store these here, so I'll say, "self dot", that equals that.
In fact, in PyCharm you can hit alt enter and it will even write that whole bit for you because it knows that this is what you should do.
But you probably see a lot of duplication here, and here.
And if I want to change something about this, like add a feature to all creatures, well I'll have to go in and add it everywhere, like this.
So, we'll be able to something a little bit better here in just a second.
But let's go ahead and write this.
Let's take that and let's say we're going to multiply that times the self.scaliness, let's go that equals that.
We'll say if self.breathes_fire, then value equals value times 2.
So it's even worse, stronger if it breathes fire.
Okay, great, so there's that.
Now, this is not really super helpful.
Any change we make over here, we would kind of like to copy them over there, and really, we would like to treat the dragon as just a specialization of a creature.
Remember, this is a relationship.
So we can model that by saying this dragon is a creature, like this, alright?
And when we say that, what it lets us do is actually take on all the attributes here.
Notice this is giving us a little warning, it says, "you need to say super dot", and in pass the name and the level.
And this basically says we're going to run this bit of code, and we don't actually need this stuff here, we're just going to store let it pass on through, then we're just going to store the things that are special about the dragon.
Similarly, this right here, we could say the role is actually whatever the regular creature does.
And then we could say, okay we're going to do that same thing, and we're going to factor in the scaliness and the firebreathing, here.
You can see right here that PyCharm is saying that you're actually getting this detail here from your creature class that you're driving from.
Okay, so this is all well and good.
Let's do one more thing.
Let's have a wizard.
Now the wizard is also going to be a creature, and the wizard actually has no special items or a passing to it, so we can just leave this init thing off.
We're just going to add one behavior to the wizard, which is going to be attack.
So he's going to have a creature he's going to attack, and it's going to return True or False.
So it'll go something like this.
Now notice, both the wizard can get this defensive role, or offensively, but it's fine, and the creature also knows how to get a defensive role.
And we'll just compare those, we'll say return, my role is greater than or equal to their role.
Alright, so what we're going to do is have the wizard attack another creature, and then if we roll something higher than we win, otherwise we lose.
And we're indicating that by returning True or False.
Alright, so we were able to take on a lot of the features and the blueprint of the creature to get this defensive role, and all we're doing is adding an attack mechanism.
Whereas the dragon, we said we're going to change the way defense works for dragons as well as, like, storing additional stuff.
So we're able to model these various actors in our game, all the while keeping a sort of common functionality so they can interact with each other.
|
|
|
show
|
5:17 |
Now that we've created our actors in the game, our creature, our dragon, and our wizard, let's go and actually use them to put the behaviors or the implementation of the game together.
So over here, let's also import wizard and dragon.
Now down here, these bats, and toads, and tigers, they're fine, but this one, we're going to create a dragon, and this will be called the black dragon or something like that.
And notice PyCharm says the black dragon actually takes, breathes fire and a scaliness.
Alright, so let's do that.
Let's say this one, its scaliness is 2.
We can make that super explicit and I'll say breathe fire, false.
Okay, so we have a chance to defeat it, but it's still, it's going to be tough.
And here we'll make this a wizard.
This is an evil wizard.
So we can have our standard concept of a creature, or we can have these specialized ones, but we're going to end up treating them all as creatures.
We don't need this.
We'll come over here, and now we're going to create our hero like this.
And his name is going to be Gandalf, and his level is going to be 75.
So, it's going to be a little tough for him to beat that, he should be able to beat this wizard, he's got no chance.
Well, he has a chance, but it's highly unlikely, okay?
Alright, so now we need to randomly choose a creature.
Now let's go up here and say, import random.
There's a really great way in Python to randomly choose a creature.
You could say, create the integer, figure out how many there were, use the index, end to this list of creatures.
Or you could just say choice, and say, give it the creatures, and given a collection here, and we'll just grab one.
Okay, so now we need to print out some information about the creature.
So we can say activecreature., now we're not getting very much help here from our IntelliSense, but that's okay.
So then we say name, activecreature.value, and that's going to print out a nice little thing.
And we should be able to actually run it now.
Let's go ahead and run it and see what happens.
If it's nice and big, not so happy.
Where did we make this mistake?
I typed value, this would be level.
Okay, a tiger of level 12 has appeared.
Okay, so run away.
The wizard runs away.
A black dragon of level 50, has appeared.
Run away.
The evil wizard, definitely ran away.
Okay?
Then we just hit Enter to exit.
So it looks like our actors are working.
All we have to do is have them battle, so if they say attack, we'll just have this.
If a hero.attack(activecreature), if that's true then they win.
So what we actually want to do is make them leave the game.
So we'll say creatures.remove(activecreature) and then we'll say print, something like, the wizard defeated them.
So we'll say just something like that, the wizard defeated such and such.
And we're all good there.
Wizards run away, there's nothing to that.
If the wizard looks around, we just want to show all the creatures.
So that's easy.
We'll just say, for seeing creatures.
Now we'll do a little format string.
Like this, and so we'll say, see.name, see.level.
And notice, all we're using are the features of the base creature.
Not the scaliness, not whether it's breathing fire, we're just talking about the standard creature, which means we can treat these all uniformly.
Alright.
That looks like we've written the game.
I think we're done.
I think the last, final thing to do is to play it, and it seems more fun to play if we play it full screen.
So, let's say this, Python 3 a lot.
Excellent, an evil wizard has appeared.
Shall we try to attack it?
I'm sure we'll lose.
Oh, we're not printing anything if we lose.
Alright, let's do that one more time.
So we'll say, if else print the wizard has been dealt a defeat.
Alright, so the wizard has been dealt a defeat.
Now the wizard doesn't actually lose.
The game's not over.
Maybe it could be, but right now it's not.
So we could attack, first let's look around.
Alright.
So we see the bat, the toad, all the things.
Now if we attack the toad, we should defeat it.
We do, luckily.
If we look around, you'll see now the bat, no, the toad is gone.
This level 12 tiger, we can attack it, and this wizard here, let's run away.
We can look around again.
Now we just have the bat, the dragon, and the wizard.
The wizard we're going to run away from.
The bat we can attack.
Now what's left?
Just the dragon and the wizard.
Alright, we're going to run away from that.
Maybe we can beat the dragon?
The wizard has been, guess I got a spelling there, the wizard has been defeat by the powerful black dragon, has been defeated.
And we probably, it would be nice to see the two roles that came back, but that's okay.
Alright, so if we look around, there's still that.
Run away, run away, run away.
Okay, maybe we beat the dragon?
Yes!
Now if we look around, all there is this, the chances that we beat this evil wizard, not so high, so we're just going to leave.
But we've defeated all the other creatures.
There you have it.
We've built a game and we've modeled it with classes and objects.
|
|
|
show
|
0:55 |
Let's quickly review the concepts around classes and remember that classes are the blueprints from which we create objects and those objects are the things that act and take on the data of our application.
So we start by using them in the class keyword and then we just make up a name, this is going to be the name of the blueprint, or the type that we create, here we called it a creature.
And then we add a dunder init, in one of these magic methods here and every method that is on a class has this self message what's called a static method or a class method and they always have self but, but we don't have to explicitly pass those, Python takes care of that for us.
If we want additional premiers, they go after self, so name and the level and we're going to assign new fields to this by saying self.name equals name and the new ones for self.level equals the level.
We also can add behaviors by adding additional functions, so get_defensive_role() for example.
|
|
|
show
|
1:37 |
I hope it was fun to watch me write this D&D game, but it's going to be way more fun for you to write one yourself.
And no, we're not going to write the same game, we're going to do something totally different and fun.
So, over here on the GitHub repo, here's the D&D game in case you want to go in and actually look the code we just wrote.
So you can use that to help you come along here as an example.
Now, let's go down a little bit here.
We're going to work on a different kind of game.
Rock, Paper, Scissors.
So, here's our wikiHow on how to play Rock, Paper, Scissors, if you've never done it.
It's a straightforward, fun little game, slightly more complicated than just guessing a number and those sorts of things.
So, it's a pretty interesting game in that sort of three option way.
And so what we're going to do, definitely in the first two days, maybe even into the third day, is we're going to build the standard Rock, Paper, Scissor.
However, if you feel like you get done early and you want something special, like a big challenge, I've also put a link here to this thing called 15 Way Rock, Paper, Scissors.
And, by the way, they even go beyond that so you can have more than just 15.
I think there's like 25 is probably the highest I've seen, but there's all sort of fun creatures and interesting things going on here.
So, let's get to the first day.
So, what you're going to do is mostly just watch the videos, learn what you're going to learn by watching them, and let's just create a project that's going to be the foundation of Rock, Paper, Scissors.
You don't really need to create a virtual environment or anything like that because there's no dependencies, there's really nothing to pip install, which is the main reason to have a virtual environment.
First day, mostly just watch the videos and create that starter project.
|
|
|
show
|
1:55 |
Second day, is we're going to write standard Rock, Paper, Scissors.
And you're going to model this with classes.
There's going to be a roll and the roll has a name.
It knows what rolls defeat it.
And, alright, so you store the name that other rolls, that the names of the rolls that you can defeat as a roll and the rolls that defeat you.
Also, we have player concept.
And the player is really just going to have a name.
So it says, player Sarah rolls this.
Player Computer rolls that, and so on.
Alright, so nothing major there.
You could also keep a history of the rolls.
You could show like, sort of replay the game if you wanted, and each player could remember what they played at each stage, that'd be fun.
And then the basic program flow looks like this.
This is not perfectly exactly what you necessarily need.
It's not totally implemented but, we're going to print out the header, we're going to initialize the game here by getting the various rolls, in this case there's only the three: Rock, Paper, Scissors.
And then we're going to get the name of the player, Add the computer and then we'll have an automatic player here, and then we're going to run this little game loop, by passing them off.
And the game loopers need to go round-and-round, until somebody has won.
We'll go around three times, and basically just have the computer randomly roll.
And then have the real player ask them what they want to roll, Rock, Paper, Scissors, and then have them do that roll correctly.
And then finally, you can just sort of do this comparison.
Does the one roll defeat the other?
I don't know, right?
And then just do a little output here, and increment the count so that you'll know, like you just played best of three.
So you'll know who won, figure out who won and then print out so-and-so won 2 to 1 or 3 to 0 or something like that.
If you get a tie somewhere in the middle, this doesn't work so, you know, maybe once you get it working, not considering ties, then come back and address the possibility there might be ties.
|
|
|
show
|
1:07 |
Alright third day, if you're not done with the first two days, just finish that up.
Just get your standard 3-way Rock, Paper, Scissors working.
However, if you feel like you want to like, take this to the next level and you got done really quickly, if you've got some extra time left over, try this 15-way Rock, Paper, Scissors.
This diagram is actually really hard to understand, so I put together a battle CSV here that tells you if the attacker is a gun and the attacker attacks a dragon, will a gun defeat a dragon?
Or does the dragon, over here dragon defeat a gun, note the dragon loses to the gun, but the gun defeats the dragon.
So you can think of this like, sort of halfway redundant.
You really only need half this table, but having that table is super helpful.
And here's a little bit of code, we haven't gotten to CSVs yet, but here's a little bit of code that will read that in and you can use it to sort of parse that and probably build from.
Okay, so if you're feeling super adventurous and you've got extra time, work on this Rock, Paper, Scissors 15-way, otherwise just build standard 3-way rock-paper-scissor and hope you have a lot of fun modeling these little games with classes.
|
|
|
|
22:10 |
|
|
show
|
1:19 |
Welcome back to the 100 days of Python.
In the coming three days I will guide you through list comprehensions and generators two of my favorite features of the language.
We're going to look at how you can make a for loop with an embedded if statement more Pythonic by using list comprehensions, then we will load in Harry Potter and use list comprehensions to filter out non valid and stop words.
Next up, generators.
We start very simple with the concept of the yield statement writing a simple generator, we look at the stop iteration exception, and how the for loop catches that for you.
We move on to more interesting examples and finally compare performance of lists and generators, because if your data set grows you definitely want to know about generators.
The second day I have practical exercises to train your new gained list comprehension and generator skills.
The third day I will show you solutions to those exercises and I challenge you to take a more advanced generator exercise replicating Unix pipelines and it will be a lot of fun.
So, lets dive straight into those two Python power tools.
|
|
|
show
|
3:25 |
List comprehensions and generators.
Let's import the modules we are going to use.
Let's start making a list of names.
We've got a bunch of names and let's loop over the names.
for name in names and we're going to title case each name.
There you go.
Then let's do something more interesting involving an if statement.
So, let's keep the names that start with the first half of the alphabet.
An easy way to do that is to use the strings module, which has helpers like ascii.lowercase.
So here, I used the strings ascii.lowercase, I converted it into a list, and took a slice of the first 13 elements.
Great, and the purpose, by the way, of this exercise is to first do a classic for loop and if statement to later refactor that into a list comprehension.
Right, so, Mike, Bob, Julian, Guitto, but this seems a bit for both, right?
We looked through the names, we do an if statement, and it takes like 5 lines of code.
Before we move on, I have to warn you though, if you see the elegance of list comprehensions, there is no way back and you want to use them everywhere, and that's awesome because it reads like English and I don't know any reason why not to use them.
Let's write a simple list comprehension to do the same as I did here.
The very basic level of this comprehension uses for inside the square brackets, so for name in names.
And before the for, just returns the name.
So, this would just bounce the same list we had before and the nice thing then, is that you can add an if statement after the list.
So here, first character is in first half of the alphabet, that's got to stay and a result, I want title cased, so I can do that here, and now we get the same result.
So, if I call this new names2, I can say new_names asserted, new_names equals new_names2, and they're exactly the same thing.
So look at that, five lines of code, one line of code, and they read pretty well.
You just have to read from the inside out.
Have a loop over the names.
For every loop, I check this if statement and I return the name title case, if that if statement is true.
That's all there is to the basics of list comprehensions.
You can nest them, but they might become unreadable, so I would definitely stay at this level.
The other way to write this is to use map and filter, like the functional programming construction Python, and those work equally as well.
Although, I find this more readable, this more like English.
So, let's move on to another example.
|
|
|
show
|
3:33 |
Let's do a more interesting example.
I'm going to load in the text of Harry Potter, split it into words, and use list comprehensions to filter out stop words, or other words that are not meaningful.
So let's load in Harry Potter, and parse the response, which is response.text, I lowercase it, and I split it into a list of words.
And you can see that by just getting a slice.
Cool.
And let's see the most common words so far.
Right, well here are stop words we're not really interested in, and the dataset also has a couple of other characters, that should not really be taken into account, for example, do we have a dash in words?
Right, so we need to filter that out as well.
So let's clean out any non-alphabetic characters first.
So this looks over the words, and any word that contains one or more non-alphabetic, or alphanumeric even, characters gets stripped out, and I do realize that that might lead to empty words in the result list, but next we will have another list comprehension that takes care of that.
So is the dash gone?
And yes its gone, but we still have stop words, for example "the", which we're not really interested in.
So let's do another list comprehension to filter those out, but for that I need a list of stop words.
I already prepared it, and the code is the same as loading in Harry, I'm just going to copy/paste that.
And here you have a list of all the stop words.
Let's wipe those stop words out of the words list so far.
So words equals word for word in words.
If word strip, and that's what I said before.
There might be some empty strings in there, and by checking if word strip is true, you're basically saying, discard any empty strings.
So if you have a non empty string, and the word is not in stop words, then it's a go.
So we need non empty words, and a word that's not a stop word.
If so, store that into the new list.
And then we can do a simple check.
If "the" is still in words, and now it's gone.
Now let's do the counter again, and see if we have a more relevant result.
And there you go, there's the Dumbledore.
I have to confess I didn't read Harry Potter, but this sounds more like Harry Potter.
So, I think this was a great example to show you how you can use list comprehension to clean up data for analysis using few lines of code.
|
|
|
show
|
1:56 |
Next up are generators, sometimes building up a big list hits your performance right?
It doesn't fit into memory and you can write a generator that yields values one by one.
Its like a function that pauses itself.
You call it you get one value, it pauses, you call it again, it gets you another value and it keeps your memory footprint small.
Its best to write the simplest of generators next, lets do a number generator, so def num_10 for e in range 5, and then we use the yield keyword and that's it, that's like the smallest easiest generator is, that's stored in a variable, and that's it.
Now you can get the next value from the generator using the next keyword and that's zero and you can loop through them, like this and notice that the for loop took of at one because zero was already used or returned, and another important thing to know about generators is that they consume their sequence once and once you get to the end and try to go beyond that limit you get a StopIteration.
If I now do next gen, boom it doesn't work, it says StopIteration because we've exhausted the sequence right?
And again, for handles this for us, so if I initiate this again, and do again the for loop, we don't get this exception because for is smart enough to catch this for us.
So, that's the simplest generator example I could come up with.
|
|
|
show
|
1:29 |
A common use case I find for generators is to build up my sequence.
So, let's define a list of options.
Red, yellow, blue, white, black, green, purple.
And in my older code, I will do something like, And that's fine, we just keep an internal list, and append to it and return it.
Just to show you how you can do this in a more concise way with a generator.
I'm just calling it the same name, but appending _gen.
It's the same for loop, but instead of building up a new list, I'm going to use the yield keyword to yield the values one by one.
Alright, let's see what that gives us, a generator.
And a way to materialize the generator at one go is to convert it into a list, and there you go.
So this is a shorter, more concise way to build up a list or sequence, and it's also faster if your data set grows, because it's evaluated lazily.
And actually to show that in practice, in the next section, I will compare a list and a generator in performance.
|
|
|
show
|
1:37 |
I've said it a couple of times now that generators can gain you performance when your data set grows.
So why not see that in action, and define a million years, and loop over them and see which years are leap years.
So let me write it out and I will explain it next.
Okay so, first I have a leap years list that builds up the list of a million years, checking the isleap(), and I'm using calendar.isleap(), which is a nice built in way to do that.
And the second function uses a generator, so it's the same loop, but it yields the year.
So it's not building up the whole list in one go.
So let's use the timeit module tool, time both functions.
And it's taking a bit.
Let's do the same for the generator.
Wow, look at that, that's milliseconds versus nanoseconds.
So the generator is way faster.
And again, that's because it's not taking up so much memory.
It's yielding the years one by one, doing that lazily and saving you memory.
So that's why generator's faster.
And when you're working with large data sets, you should definitely know about them.
And that's a wrap of day one of the list comprehension generators lesson.
|
|
|
show
|
1:31 |
Let's look at what we've learned so far.
List comprehensions.
For both ways of doing a loop and conditional, we loop over list and store all the modifications in a new list.
Five lines of code.
The more Pythonic ways to use a list comprehension.
One line of code.
And it reads like English.
We went through another sample cleaning up a word list, and you can do multiple checks.
in the conditional part over list comprehension.
Secondly, generators.
The simplest generator would be something like this.
For in range, yield the value.
Generators, pause.
So, after every call it stops at the yield, and comes back.
Use a generator to build up a sequence.
Here I made a bunch of options for a fictional website.
And instead of building up a list in the function, we use the yield statement to just generate a sequence of items.
And lastly, we look at list and generators, and we saw that when your data set grows your really want to know about generators because the items are lazily loaded, not taking up the whole memory footprint.
And that's it for the basics.
And now it's your turn for day two and three to get more practical exercise.
|
|
|
show
|
0:58 |
Welcome back to 100 Days of Python.
The second day of list comprehensions and generators.
Now that we've got some theory down, it's all about getting practice.
I've got some small exercises to get practice.
So, here you're provided with a names list of names and surnames.
And can you write a simple list comprehension to convert those names to title case, and reverse the first and the last name?
Then we use that data to make a simple generator that generates output like this.
So, we initialize the generator.
We look through a range of 10, and call next on the generator.
And every time we call next it returns name one teams up with name two.
And those names are randomly chosen That should not be too hard after yesterday's lesson.
So have fun, and tomorrow we'll show you the solution to these two exercises.
|
|
|
show
|
5:05 |
Welcome back.
I hope yesterday's exercise was reasonable for you but starting today I will show you a possible solution.
If it was very easy for you, feel free to skip to the next video where I have some other exercises lined up for you.
Okay, so the first thing we needed to do was to title case the names using a list comprehension.
That should be pretty easy now.
So, name title for name in names.
Oops and names is not defined because I did not run the cell and let's run it again.
Okay, cool.
So, every name is title cased.
And then we have to write a list comprehension, reverse the first and the last name using a helper function.
So, let's define reverse the first, last names and it takes a name, split the name in first and last so this is a nice example of unpacking.
So the name splitted by defaults space, get you two elements and you can assign them directly to first and last.
Then, we return them and I was using a join but in 3.6 you can use f-strings where you can embed the variables, which is very nice.
And let's do the list comprehension to use that function.
Reverse first, last names, name for name in names.
Right.
And yeah, I dropped the title case requirement here but that worked.
Then we move on to generators and the exercise was to generate random pairs of names.
So, name one teams up with name two, etc.
First, define a function.
And, let's get the first names and we can again use a list comprehension for that.
So, we split them again and we take the first element with indexing.
We title case that.
That's nice with Python, that you can chain all these operations for name in names.
So, let's do an infinite loop.
Which I usually do with while true.
I initialize first and second.
And this little while, I'll explain in a bit was that I had to add later.
And I used a random sample to take the first names list and pick two items.
Why you needed the while?
Well, it turned out that I could have two teams of a Julian so the same name came out of random sample.
So, while that's the case, keep picking two names basically.
So that was a little tweak I had to do to make sure that both names were always different.
And then again, I used a f-string to return first, teams up with second.
And let's see if that works.
So, I assign the generator two pairs.
So for underscore in range and the underscore is just a way in Python to say throw away variable I don't care really what that loop variable is.
Print next pairs.
I can adjust to four variable in 10 pairs because that will go on infinitely.
So I'm making sure I'm making next to retrieve one value at a time.
Okay, I did not import random.
And there you go.
Jewel teams up with Julian.
Ali teams up with Bob, etc.
One final thing I wanted to show you is itertools, islice because I said before you can not just loop over an infinite generator, it will probably hang your system because it never ends but islice, you can slice a generator just as you would slice a normal list but that overcomes that problem, so I can just do, itertools.islice give it the generator and the number I want, that gives an islice object and I can materialize those in a list by doing this.
There you go.
Okay, those were two possible solutions of the small exercises I gave you yesterday and in the next video, I will show you some more exercises you can do today.
|
|
|
show
|
1:17 |
Alright, you're almost there.
To get some more practice, I put together two smaller exercises, or bites, and one bigger co-challenge.
This one, you will recognize the name's list but it's a little different because you have to take duplicate names out and sort the names and find the shortest first name and, of course, you will be using this comprehensions.
Secondly, what we did not touch upon, is dictionary comprehensions, so, you might look that up and go through bite 26, where you have to do some operations on this dictionary and this set using a dictionary comprehension.
And the co-challenge is Generators for Fun and Profit, a challenge we run some time ago.
And this will be a fun one because you have to turn this Unix pipline into multiple generators.
So, I think that's a great way to get some more practice using generators.
Three exercises, see how far you can get during this third day of this lesson and, of course, share your work.
Put a tweet out with #100DaysOfCode.
It's a great way to get visibility of your work and, of course, we'll be happy to see how you progressed this section.
Good luck.
Have fun.
Keep calm and code in Python.
|
|
|
|
35:42 |
|
|
show
|
0:30 |
Good day guys, this is Julian Sequeira, and welcome to iteration with itertools.
This is going to be a three day series just touching on the more common, arguably more common, usages of itertools.
We'll start off with a bit of a coverage of what iteration is, very basic stuff, and then we'll get straight on into itertools.
So carry on, move on to the three day overview for some more detail, and then we'll get straight into the code.
|
|
|
show
|
2:51 |
The next three days are going to be pretty jam-packed with content for you guys to consume.
So, for itertools day one, what I'd like you to do is actually just watch the videos.
There are four videos to do, and they involve cycle product combinations and permutations, okay?
I'd like you to pay specific attention to cycle, I'll explain why in a second.
But, pretty much, that's all you have to do for day one.
Nice and easy.
Just grasp the concept and play in the shell.
I cannot stress that enough.
Actually do some live coding in your Python shell, okay?
Do that to really grasp the concepts of cycle product combinations and permutations.
For day two, you're going to create a traffic light script.
Okay, now what this script is going to do, it's actually going to pretty much just emulate or simulate traffic lights.
Red, amber, and green.
Okay, nice and simple, it uses cycle.
Which is why I want you to learn itertools cycle and pay attention to that one specifically.
And you're going to create it before you watch the traffic lights video, okay.
The video is there, it'll be right after combinations and permutations, but please try not to do that until you actually give this an attempt.
Okay, give this a go yourself, and then check the video to see how you went, okay?
Now for your last day, after you've finished your traffic lights, I would like you to have a play with bite 64, bite 17, or bite 65 on the code challenges platform, okay?
These are three bites that are free for you because you're in this course.
And they will actually make you use itertools in some way, shape, or form, okay.
Some of them are easy, this one's intermediate here, and this one's also intermediate, okay.
So have a good play with these three bites.
There's nothing much to it; you'll code within the browser and you'll hit test to run some tests against your code.
A really great way to spend your third day.
Nice and easy, it's all laid out in front of you, you just have to focus on the code.
So if you want to go to bite 64, 17, and 65 using these three links, you'll get them for free, and then you can spend your last day just plain coding.
And that is pretty much your three-day wrap-up.
Go through it, if you have any questions, always reach out.
But, other than that, move on to the
|
|
|
show
|
4:53 |
All right, so let's discuss what iteration is in Python.
When we say something is iterable, we're saying that you're able to iterate over it, you're able to move through it one item by item, okay?
So the easiest way to demonstrate this is just to get a simple list.
So we'll create a quick list here of numbers.
Let's go with the numbers 1 through 10.
Okay, oops, what am I doing?
1 through 10.
And we know that, and we know that number is 10 digits, right?
Nice and easy.
Now if we're iterating over that, we're going to run a full loop, so for i in numbers, in number, I should say, print i.
This is something we've all done before, we all know what this is, but what's happening behind the scenes?
Okay, yes we're running a full loop, but really what is that full loop doing to iterate over the number list and give you the numbers?
Well, it's actually calling the iter dunder method, or iter protocol, okay?
So we can see this if we actually drill in to the number list.
We can see that it is actually calling iter or it's capable of being iterated over.
Okay, so we've got iter and dur number and we get true, so it's in there.
This is an iterable item, we can iterate over it, okay?
Now another way to demonstrate an iterable item is to use next.
We've all seen next before, or hopefully you've seen next.
And what happens is when you run next on an iterator, when it finishes iterating over the sequence, over the list or the string or whatever it happens to be, when it finishes this, it then gives you an error, okay, it gives you a StopIteration error because it's only going to iterate through it up until the end and then it will stop.
So now that we know that iter is actually what's being called in the background, we can use that, okay, we can use that with next.
Now if you haven't heard of next, next is a little function you can run against an iterator.
And what it will do is it will pass over, it will iterate over that iterator, that list or that string or whatever it is, and it will continue through it until it hits the end.
When it hits the last item, when it hits the last character, it will actually give you a StopIteration error, okay?
So we'll demonstrate that with a string called, let's call it string, okay?
So it equals iter, we're actually calling iter now over the word string.
Okay, so we know that when you iterate over this word here, over this string, you're going to get the letters one by one, right?
So if we call next on that, we'll get the letter S, okay?
Now let's copy and paste this a few times, just so we can demonstrate.
We get the T, we get the R, I, N, G.
But then, when we run it one more time, we get the stop iteration, okay?
And that is because we're calling next directly.
That's because it's hit the end and it's taken care of.
It gets to the end but then it's not going to go any further because it knows it's already finished.
Now, when you run a full loop, so for character in string, print character, we get the letters, but we don't get this error, we don't get the StopIteration error, and that's because it's actually built in to the full loop so that it's not going to give you that error.
It's expected, okay, so it knows that it's hit the end and it's not going to actually sit there and give you the error.
And that's it, that's a basic coverage of iteration.
You see it's just going through each object, each item, one by one, to get to the end.
Now, there is iter tools, a nice series of functions that are just so cool and make iteration a lot more interesting and a lot easier, so that's what we're going to look at.
|
|
|
show
|
5:34 |
So we're going to kick off our foray into EdiTools by using EdiTools.cycle.
This is one of the infinite usages of EdiTools.
Okay, in the since that when you use it, it's just going to keep iterating over the item or series of items over and over again.
It doesn't stop until something tells it to stop, okay?
So, let's have a go.
First thing we're going to do is import EdiTools.
Now we're going to import, I'll explain all of this in a second, we're going to import sis and we're going to import time.
What we're going to make, and this is a really cool one, I absolutely love this one, we're going to make one of those little, cool spinny line things, you know?
Like a little loading line that you see on the command line.
You might actually like this or you might hate it depending how many times you've seen it.
So, to make that, we're going to go symbols, let's create a little item here called symbols.
And it's going to be EdiTools.cycle.
Now what we have to specify between the brackets is, tool tip gave it away, is the iterable, the item that we're going to iterate over with cycle, okay?
Now that could be a variable, could be anything really, it could be any object, but, we're going to use just a specific set in a specific order.
So if you think about this, take a look at how these are lining up.
This looks like a spinner right now.
So it's going to start with a horizontal dash, then it's going to go into the slash, then the pipe, and then the other, then the forward slash, and so on and so forth, okay?
And it's going to iterate through that.
It's going to keep cycling through this and you'll see that it actually starts to spin.
Alright, it gives you that sort of feeling of a spin.
Now, to do this, we need to put it in a loop.
So we're going to give it a while loop.
So while true, and again, dangerous, this is just going to keep going until you control c out of it all.
Snap out of it in some way, shape, or form.
To get this to work the way we want it to work, we need to use the sis module, okay?
So, I won't go into sis now because this is pretty straightforward and you may already know it and it's out of the scope, so we're going to essentially send this data to standard out, okay, on the system, wherever you're running this from.
And the little trick we want to do here is, I'll just show you, we're going, let me type it in first.
We're going to go next, symbols...
Alright so what this line is going to do for every single loop it's going to do the next.
Remember we covered next.
It's going to go through the next iteration of EdiTools.cycle, okay?
And this here, the slash r, is going to negate putting this on a new line, okay so, it's not going to return, it's not going to put it down on a new line, mkay?
Now, sis, this one here we sort of have to put in just for safekeeping.
Just in case, okay?
Oops, not flash.
Flash, so sis standard out flash, this guarantees, this will force whatever you're putting to standard out to appear on the screen because from time to time you might actually get what you're writing to standard out going into a buffer and we don't want that.
We want it to be flushed out of the buffer and onto the screen.
And then we're going to put a time delay.
That's why the imported time up above.
Let's just make it one second, okay?
So, our while loop, it's going to start iterating using next through EdiTools.cycle, okay, it's going to cycle through this infinitely.
It's going to flash it and make sure it appears on the screen and then it's going to take a second, okay it's going to sleep for one second and it's going to do that for, well, for eternity, until we exit out, okay?
So look at that, we're starting to go through here.
Just ignore the two here.
This is a by product of actually running through this in the Python shell.
So what we're actually going to do is we're going to put this into a, an actual Python file and we're going to run it from our Windows command line and you'll see how it actually works.
Okay, with some magic here we now have all of that in a little script and now all we have to do is run Python and what did we call it?
We called it cycle_demo, and look at that.
Look at this funky little spinner over there.
So, that looks kind of boring now...
Mkay, so let's go into this and change this in seconds to be zero point, five seconds.
Let's try it again.
And look it's speeding up, okay it's gettin' quicker.
It's gettin' quicker.
And just, just for the fun of it, let's make it super fast.
And look at that, now it looks like a proper spinner.
So this is a perfect, perfectly awesome and usable example of EdiTools.cycle
|
|
|
show
|
4:45 |
Let's take a quick look at itertools product.
Now product actually is short for Cartesian product or it's a Cartesian product, I suppose.
Now, what does that mean?
Well, it's not another language.
It actually means it is every possible combination of values.
Alright, so think of it this way.
Let's say you had a string.
Let's say you had my name and you wanted to see how many different possible combinations you could get of the letters.
Now you can change that slightly.
So, the first thing that comes to mind is that you might think how many combinations of six letters.
So my name, J-U-L-I-A-N.
How many combinations of those six letters can you get?
Now with itertools product, that is exactly what it calculates for you.
That's what it prints out on the screen for you.
So, let me demonstrate that for you.
Okay, so we've done from itertools import product.
For letter, and we'll use my name just because we've discussed that.
For letter in product, now in product, look at that tool tip, we choose the iterable, the item that we're iterating over and the repeat.
Now the repeat, it's actually quite easy.
It's much easier to show it to you.
But the repeat is essentially how many of those letters or those items in that iterable you want to show up as a product.
Okay, so let me show you.
So, we're going to use my name.
Julian.
And then, for the repeat, we're going to say 1, just like the tall tip.
And when we hit enter, or when we, sorry I should say when we print out the letter.
You'll see we, because we repeat it only 1, we're only saying, well we only want one group, 1 grouping, we're only going to use how many iterations of this, how many combinations of this are we getting to a maximum of 1 character or 1 object?
Okay, so you can see here Julian, the J can only show up once.
Okay, because it's only repeated once.
So, if we change this, let's just copy this back out.
And we change this to 2, we can go print, letter.
Now, watch what happens.
We get a lot more as a result.
Okay, so the first thing it does is it takes the letter J.
Well, we're repeating 2.
We're going to use a combination of 2 letters.
We want to maximum of 2, it can repeat twice, okay.
So, we're going to have J with J.
We're going to have J with U.
We're going to have J with L.
We're going to have J with I.
And so on through the list.
And once it exhausts, J being in the first position and this other combination being in the second position it then moves down to the U.
And then it repeats it all over again.
And then, L and so on.
And it keeps going.
Now one thing you'll notice, is that we're talking about the positioning here.
Okay, so U and I appear together here.
But they also appear together here.
I and U.
The difference being obviously that because they're in a different order, it counts as a different combination.
Remember, this is every possible combination.
While yes, they're still returned as U and I you're still getting a U and an I returned, because they're in a different order, because they're in a different technical combination, I suppose.
They are capable of showing up twice.
Okay, what you will also notice, is that J, J, does not show up twice.
Okay, it shows up once, because it doesn't matter.
These aren't treated as different J's.
It is a J, plain and simple.
Okay, so it shows up J, J, just once.
And that is editor's product.
It's so simple, but just imagine trying to code this yourself with a for loop and looking at if statements and everything like that.
It's disgusting, right.
So, this is the power of itertools with just two lines of code you can get every possible combination, the Cartesian product of an iterable.
|
|
|
show
|
3:54 |
Next up we're going to look at itertools combinations and permutations.
Now let's look at combinations first.
Now combinations allows you to get the possible combinations of an iterable of the certain, you know, of a certain string or a certain list, okay?
So let's just get our setup here.
From itertools import permutations, combinations, okay?
Let's say we have Mike, Bob and myself.
All right and we'll make a friends list, 'cause we're friends right?
Please say we're friends.
Mike, Bob, and Julian, and we'll split that, not splut, we'll split, okay so we have friends.
We have this list, Mike, Bob, and Julian.
Now with combinations, we can see how many combinations you'll get of the three of us, okay.
Now this will actually give us a generator, so we're going to use list, we're going to force it to be a list okay, so just bear with me here.
So print(list(combinations())), okay so this is now we're talking edit tool stuff and in the brackets we have the iterable, okay?
And the Iris pretty much what we want the combinations to include how many combinations we want.
So for example if we specified Iris two, okay it would say, okay combinations of two.
So Mike and Bob, Bob and Julian, Julian and Mike and so on, okay?
So we're going to actually choose our friends list, all right?
And then we're going to have a length of 2 okay?
Let's close all this off.
And you'll see that we get, well first of all we'll get return, it returns tuples, or tuples.
And look at the combination set that we get there.
We get Mike and Bob, get Mike and Julian, and then we get Bob and Julian.
And what is it that you've probably noticed?
There's no order, okay.
There's no, what if the order mattered?
If you were trying to return this list but you don't like Mike being first every time, what happens if you want it to return a tuple as Bob, then Mike, Julian, then Mike, Julian then Bob.
Well that's where permutations comes in.
So combination gives you just a valid combination, it doesn't care about the order, right?
Permutation will give you not only the valid combinations but also in whatever possible order they can be in, okay and that's where permutations is super powerful, okay?
So we'll do it the same thing, we'll do the exact same things, let's just, may as well copy and paste.
We'll do print(list(permutations()) works in the same way, see we got the iterable and we got the r.
We can go whoops, can't type.
We can go friends and we'll do two as well, just so we're keeping this standard.
And look at that, we now have Mike and Bob, Mike and Julian, but then we also see, Bob and Mike, so over here we same Mike and Bob, and over here now we see Bob and Mike.
Then there's Bob and Julian, then there's the opposite, Julian and Mike, as opposed to Mike and Julian, and Julian and Bob instead of Bob and Julian.
And that's why permutations is awesome.
I mean they're both awesome but this is such a great way of doing it, it's one line of code, it's just amazing, if again, itertools is awesome.
That is permutations and combinations
|
|
|
show
|
8:28 |
Alrighty, in this video we are going to create some traffic lights.
As discussed in the ReadMe from the three-day overview, I strongly urge you to try this yourself.
It's not too difficult, it's a nice little challenge for your second day.
This video is going to walk you through how I've created it.
If you haven't done it, if you haven't attempted it yourself, just pause it here, or hit stop and minimize.
Avert your eyes, children, and just give it a try yourself.
This is the best way to learn.
You're going to need itertools cycle, I'll give you that tip, and that's it.
Out of all the stuff we've covered so far, itertools cycle is all you're going to need for this.
Then, just think about how traffic lights work and go from there.
Now, into the code.
We're going to just import some modules here.
For me, I'll discuss this in a minute, we're going to import from time import sleep because we do want our traffic lights to sleep when you're going between the colors.
Now let's import itertools and let's import random because I have an idea.
First thing we're going to need is we're going to need our colors, aren't we?
What are the three colors on a traffic light?
We've got red, green, amber, or yellow, whatever you want to call it.
You know what I mean, I can't type this bit, can I?
And that gets our colors list.
Now, the rotation between those colors.
Again, if you haven't done this yet, hit pause now.
The rotation of going through those lights, we're going to use cycle, remember the spinny thing from the other video.
We're going to use itertools.cycle, but this time we're going to call colors, just like we have here.
We're calling this and we know it's now going to cycle through red, green, and amber because by using split we created a list of these three strings.
So that's what rotation is.
Alrighty, so let's create our function.
You know what, before we start any of that, let's throw this in so we know where we're starting.
What do we want our function to be called?
Let's call it light rotation.
We're going to pass in rotation.
Not that, well, I suppose, we have to, but we'll just do that anyway.
We'll go def light(rotation) We're reading in the rotation.
So, what's this app going to do?
What's this little traffic light going to do?
It's pretty much going to have three if statements.
It's going to be, what do we see when it's amber?
What do we see when it's red?
And what do we see when it's green?
So, we'll create a for loop for color in rotation.
Now, remember, that's pretty much, we're not saying this here, we're saying just for the item in rotation, and rotation is returning each one of these, for the item in rotation, for the color in the rotation.
Let's just make it really simple.
If color equals amber, this is a direct match now, we're asking for a direct match.
At this point, we have to know it's going to say exactly that.
Let's go print.
Caution.
The light is...
Where's percent?
Okay.
And then we just close it off with color.
This is now going to print, if the color is amber, caution, the light is amber.
Then, at this point, we want it to sleep because, if you think about it, when a traffic light goes yellow, or amber, it doesn't just go to red straight away, does it?
It takes a few seconds, so let's just put in a sleep of 3 seconds.
That's it for that.
Just because we're only dealing with 3 colors here, let's just go with an elif statement.
If the color is, now, red, or, elif color is red.
We're going to go print, stop, the light is...
Oops.
S and then we go color.
Now we can do a sleep of, let's go 2 seconds.
And then we can go else because in any other case it's going to be green, isn't it?
Print, go.
The light is...
Oops.
Color.
And we'll do another sleep of 3 seconds.
Believe it or not, that's our app.
This function here is going to go through editor's dot cycle of colors, red, green, and amber, and it's going to say, well, if amber, do that.
If red, do that.
And then, if all else fails, it's going to be green, it's going to be the other option, and we're going to get green.
Let's run that.
Save it, F5 it.
Stop, the light is red.
Go, the light is green.
Caution, the light is amber.
Now, the catch here is that it's going to actually be the same few seconds every single time, so we can anticipate that.
That's not how traffic lights work.
So to make it a little more interesting, a little more complicated, let's get rid of these static sleep seconds.
We know with yellow lights, those are always going to be 3 seconds, or 5 seconds, because it's the standard every time.
This is why I imported random at the start.
Let's make it a little randomly generated timer.
We're going to go return, random.randint.
And what are we going to put the...
See, here we go, return a random integer in the range.
So what do we want the range to be?
Let's go 3 to 7 seconds.
So it's going to return those integers, anywhere between three and seven, so we should just call this in sleep right there and right there.
What that will do is it's going to generate a random number between 7 and 7 every time, and this should change.
You can't predict what that's going to be.
Let's run it.
The light is red, okay.
We have no idea how long it's going to take.
There we go, so it actually took longer than before, same with the light being green.
That was very quick, that was only about 3 seconds.
Amber, default, 3 seconds.
Then we're back on red, and it's sitting there for quite a while, so there you go.
Now this is more of an accurate street traffic light, where it's a bit more randomly generated.
But all of this, due to the awesomeness of itertools.cycle.
There's your traffic light.
Hopefully, your code looked something like that.
Hopefully it was a little cleaner.
But other than that I think we've just made an awesome little nifty app and a little tool, something that you'll probably never use, but that's itertools.cycle.
|
|
|
show
|
4:47 |
Well, I hope you really enjoyed itertools, because it's really one of our favorite modules.
It's just so much fun to use, and saves you so much time.
So, without further ado, what did we cover?
The first thing we covered was itertools.cycle.
Okay, so itertools.cycle, we just imported cycle from itertools.
Go figure.
Then, we specified the iterable.
Okay, the iterable that we wanted cycle to go over, okay?
and for our little exercise there, it was those weird dashes, so that we can make a little scroller.
If you were to use a string, such as the word string or my name, Julian, it would then cycle through those letters in the same way that it's cycling through those.
Okay?
And that's why cycle is so easy to use.
It does exactly what its name implies.
It's awesome.
Then, what we did was we threw it in a while loop, while True, so that it was infinite, it would just keep running while this app was live.
And then we pumped that..
Next, we pumped that cycle out to standard out.
That way it would work well on the command line.
Okay?
Using Next, we were able to actually go through one iterable at a time.
One iteration at a time.
Okay, so we know each iteration, each cycle is going to be one of these characters here.
So, Next got us to pull just that one in the first loop.
Then, in the Next loop, it then took the backslash, and then the pipe, and then the forward slash.
Okay?
That's how this works here.
And then we just threw in a little time.sleep, just to slow things down a bit.
Next we have itertools.product.
So again, we imported product, okay?
And then what we did was we used repeat, okay?
We used the repeat inside product to say how many combinations we wanted.
How many times we wanted a single iterable to be repeated or any iteration to be repeated.
Okay?
So by specifying two, when we iterate over my name, we were able to start getting a giant list just like this.
Okay?
So J matched with J, J and then U, and so on and so forth.
Okay?
And that's what product is, it's a Cartesian product, it gives you every possible combination.
Okay?
It doesn't matter in this instance with the doubles, where you've got J and J.
There's no sort of behind the scenes differing index there to say, "Hey this is one J, and this is another one.
"So there needs to be double." No.
It's just a J, okay?
Then we moved on to combinations and permutations, one of my favorites.
Imported, nice and easy.
And then we created a quick list of super friends, Mike, Bob, and Julian.
And this was for us to then use as an example.
So we got the combinations, okay?
In sets of two...
Of Mike, Bob, and Julian.
And you can see we have Mike Bob, Mike Julian, and Bob and Julian.
And then that's when we pointed out that, well, there's no order here.
It takes it into account that, okay Mike and Bob both exist in this one tuple and therefore that's criteria met, that's a combination.
But, if we wanted the order to change, if we wanted to take that into account, that's where permutations comes into it.
We have Mike and Bob here, but then we also have Bob and Mike over here.
So the order actually makes a difference.
And that's why permutations is just as awesome as combinations.
And that was it.
So your turn.
If you haven't yet, I would strongly recommend, go and do the traffic lights, okay?
Try not to watch the video until you've actually done it.
But at this point, you've probably already completed that.
So that was for day two.
So we're looking at the third day of this lesson set.
For this, go back to the three day overview, if you've forgotten what it is that we were talking about, but essentially there are a few bites to go to the Code Challenges Platform, and you have free access to those and all three of them have to do with itertools, and they're actually quite fun.
So if you haven't done that, go and give that a crack for day three.
Enjoy.
Keep calm and code.
|
|
|
|
17:02 |
|
|
show
|
0:40 |
Welcome back to the 100 days of Python.
Today we look at an important concept which are decorators.
It might be daunting at first, but they're not that hard to grasp, and they take your Python knowledge to the next level.
First we write a simple decorator and see how we can decorate a function to add additional behavior.
Then we make a quick detour to explain the different ways functions and Python can receive different kind of arguments.
Then we write a second decorator and see how they can be stacked up.
Then we look at some further references, and for the second and third day, I got a couple of practical exercises to hone your newly gained decorator skills.
All right, let's do this.
|
|
|
show
|
2:37 |
All right, a quick primer on decorators.
What is a decorator?
I think the best way to explain it is that a decorator can add behavior to a function, so you pass the function into a decorator, it can do something before and or after and returns the newly decorated object.
And it's just one of those common design patterns as described in design patterns the elements of reusable object oriented software.
So let's import the modules we're going to use.
And let's define our first decorator.
Just a very basic one to show the syntax.
Alright, now you can use the mydecorator to decoratate a function, and this is the syntax for that.
I will go into some of the details in a bit before, example, why should you use wraps which is not required.
And the whole aspect of args and keyword args.
For now, at the very basic level, just remember, a decorator takes you function, needs an inner function to pass in the arguments and keyword arguments and calls the function and see this sandwich effect here, so you can do something before calling the function and after it, so for example, when you write a decorator to time your function, here you would start the timing, here you would call the function, and here you would stop the timing.
You can look at it as adding behavior before and after the function.
The function gets called, but additional logic is added around it and that's what a decorator is for.
And then here is the syntax how to use it.
So right before the function you use the at sign, @decorator.
If you have been using any web framework like Flask for Django, you're familiar with this syntax.
As we will see towards the end, there is a login required decorator for example in Django that uses this concept of adding a behavior which is that case is to see if the user is logged in and it adds that behavior to a function which is that case is usually the logic of a web page.
A route to a certain web page.
And keep in mind that this is just syntax, the same thing could be written as...
So here you see actually that myfunction gets passed into the decorator, but this is the common way how you would use a decorator.
|
|
|
show
|
3:54 |
Alright, one thing we saw in the decorator was the args and keyword args being passed in and if you're new to Python you might not be 100% aware of all the different options you have to call a function.
So there's this great guide, The Hitchhiker's Guide to Python and it explains very well that you have positional, keyword, and two arbitrary kind of arguments, one is a list called *args and the other is a keyword argument dictionary, which is **kwargs and I just wanted to show a quick example how this all works, so let's define a get profile function and the only thing it's going to do is to bounce the different kind of arguments first let me just call it without anything and it should error because name is a positional argument which is required.
You see that doesn't work and the error is pretty self explanatory so let me then call it with a positional argument and that worked, so the second type is keyword argument which is not required and at set here to the default value you can also set it to False, of course saying active equals False, and that works and then lets look at those two arbitrary kind of arguments which is list and dictionary, so first lets first do the arbitrary argument list so that allows me to, for example, here we do sports define one or more sports.
And I really like basketball.
Oops, yeah this is kind of strange that, well it says positional argument follows keyword argument so if you want to do it this way you have make sure this not to be a keyword argument so now it works.
The reason is that the fourth type of arguments is an arbitrary keyword dictionary which goes towards the end.
So let's pass in some words, and they go last, right?
So we here have the dictionary of Pythonista and Topcoder, and that was the reason we got the error before because the keyword arguments always should go last, and to show arguments in action I define this show args decorator that prints the args before calling the function and prints the keyword arguments after calling the function, so just to put it into the context of the decorators we are dealing with here.
So we have show args and I'm going to redefine the function, and this time not to confuse it with the behavior of the decorator I'm just going to print something else.
Hi from the get profile function okay now lets see what happens if I call and get profile again, now that it is decorated of course I need to run the cell.
And here you see, so in the decorator it first brings the args, then it does the actual function work which is printing 'hi' from the get profile function and then we're at the after stage of the decorator printing the keyword arguments.
So here we see that the *args contains the position arguments, keyword arguments, and the arbitrary argument list, and the **kwargs contains then the arbitrary keyword argument dictionary, so here you see all those arguments actually being passed into the decorator and hopefully now you have a better understanding what *args and **kwargs means and the different kind of ways we can call function in Python
|
|
|
show
|
2:08 |
Let's do a more realistic and interesting example, let's write a timeit decorator.
And as we said before, we call the decorated function, and we add some behavior before and after calling it.
Alright, we got that defined, so we have a decorator called timeit.
It receives a function, it wraps the function, and we will see in a bit why that is.
We pass it the args and the keyword args.
We start a timer, we call the function, we end the timer, and then we print how much time that function took.
We return the wrapper, and that's it.
Let's then define a function that we can use this decorator on.
So that in itself is not decorated yet, so let's define it again using the decorator.
And look at that, how cool is that?
So the decorator started the timer, it ran the function, it measured the time, and after the function was complete, it reported back how long it took.
So it took two seconds which of course is not a surprise.
A final note about wraps, so what if I wouldn't have done wraps function?
So let's take that temporarily out.
And let's inspect that function.
Hey, where is my doc string?
It disappeared.
Not good, let's put it back.
Let's define the function again using the decorator.
And there you go, so that's why you should always use wraps from the functools module, to preserve your doc strings.
|
|
|
show
|
1:55 |
Next up, let's talk about how you can stack decorators.
And I've found an image of Russian dolls, which might clarify how this "nesting" works.
So let's define another decorator that shows the args and keyword args being passed in, and we're going to stack that together with the timeit decorator.
Alright, let's modify generate report from the last video to take some arguments.
And now, let me show you how you can stack the two decorators we've defined so far, and note that the order matters.
So I put timeit as the outer decorator, because I want to time the whole operation, including the use of the print args decorator.
Let's now call it, but first let's give it some parameters, so let me quickly find a dictionary of some keyword arguments.
And now, all should come together, because when I call generate report with some args and some keyword args, look at that.
We see two decorators in action.
First a timer, starting the timer, doing stuff, ending the timer, and printing how long it took, and then we see the inner decorator, print args, printing the args and the keyword args.
And here you see that decorators can become pretty powerful, because each decorator is doing a specific task, which can be applied to multiple functions, yet it's all abstracted in their definition.
And, yes, this is how you can stack decorators.
|
|
|
show
|
1:29 |
Okay, that concludes the basic coverage of decorators in Python.
In this section I provide you some more pointers to study some more decorators today.
I did an article on Twilio, and in this app I used a login required decorator to check if the user is logged in.
And you can see that in the code.
This is what you already saw in this lesson.
The wraps, and the wrapper.
It takes the arguments and just checks if login is in the session.
If so, return to function.
If not, do a flash message and redirect to the login page.
That's similar to what Django is doing, which, I pointed to the source.
You can check that out as well.
There's some more stuff going on so I challenge you to take a look at this code if you have time left today.
And on PyBites we did an article, "Learning Python Decorators By Example," which partly overlaps with what you have seen in the lesson so far, but there are also some more examples for caching, some more decorators in the wild.
And I point you to another article.
Sometimes you need a decorator that takes arguments like speed decorator that takes seconds and it's not always straightforward how optional arguments work so I wrote an article about that.
So if you still have time left today and you want to know decorators a bit more in detail you can read this article as well.
And that concludes the lesson of Day 1.
|
|
|
show
|
2:00 |
Alright now it's time to review what we've learned, how to write a decorator.
A decorator takes a function to be decorated.
It adds behavior before, and or, after.
Then it returns the function.
Don't forget to use wraps to the preserve the doc string.
Args and keyword args.
There are various ways you can call a function in Python.
The simplest way is to use a required, positional argument.
If I leave off this argument, I get an error.
The second type, is the keyword argument which can be set to a default.
And then we have two arbitrary sequences which are the list, in this case sports, and keyword arguments which always go last.
Here is an example how you would call this with all the types of arguments.
Let's write a timeit decorator.
It takes a function, starts the timer before calling the functions, calls the function, and ends the timer, printing how long the function took to execute.
We define the decorator.
Here's how to apply it to a function.
You can stack decorators.
Note that the order matters.
As timeit is the outer decorator, that's the one that wraps at the outer level.
Some examples of common decorators.
Here are two from the Flask documentation.
One checks if a user's logged in and the other is performing caching.
Those are ideal examples of decorators because they abstract away common behavior which you want to apply to multiple functions.
Here's another example of a well known decorator called LRU Cache.
You can find those in the Flask and the Python documentation respectively.
And now it's your turn.
|
|
|
show
|
0:45 |
Welcome back to the second day of decorators.
Today, you get your hands dirty writing a decorator, and I got an exercise here that you can do on the PyBites Code Challenge Platform.
The goal is to make this work, basically.
So we have a gettext function that takes a text, and you're going to decorate it with a make_HTML that basically adds a tag.
So you can stack it to add various tags, so when I call it like this, it should output p strong, the text of the function, and closing strong, and closing p.
And that's all there is for today.
If that's easy for you, you can already try to look at Day 3.
Good luck.
|
|
|
show
|
1:34 |
Welcome back.
For this final day of the decorators lesson, I got another code challenge for you.
It's more an open challenge, which you also can do on the Code Challenge platform, and basically it's to write a decorator of your own choice.
You can just look at your code maybe, refactor things that are repetitive, but I leave you totally free to build something that's useful for your needs.
For example, when we did the #100DaysOfCode, at Day 95, we used a decorator of our own.
By the way, here you see how cool it is to keep a log of your progress, 'cause you can always go back to all the scripts you have written.
So here, Day 95, we used a decorator to cache movie results.
And here we wrote a decorator to store or cache movie results.
It's doing that in the store helper, which you can see here.
So that's an example of how we used the decorator for our own needs.
And that's what I challenge you to do by taking this challenge.
And, of course, we invite you to PR, or pull request, your work.
And there are instructions here to get set up with git and pull request your work, which you can also do here on the platform.
By the way, don't forget to share your awesome scripts on Twitter using #100DaysOfCode and feel free to include us.
Tag Python and PyBites.
We are really happy to see what you all come up with.
So enjoy, and learn a lot about decorators.
|
|
|
|
15:01 |
|
|
show
|
1:00 |
Probably time that we talked about error handling.
I'm sure that you've encountered some issues with your Python code and you may wonder what is the right way to catch these errors in Python.
Well, that's what this next three day section is all about.
Have you encountered Python's errors?
Have you seen what's called a traceback here?
This is the report from trying to run the Python program when something actually went wrong on line 21 of api.py.
Let me get a little info here, there's a type error : and this gives us a description of what that is.
The type thing on the left here, the type error is an exception type and it tells us the category of error.
On the right is the actual message of what went wrong within that category.
So None type, object is not iterable.
Turns out that in this case, the data return from the server was empty and we tried to loop over it.
That doesn't work so well.
So we're going to see how to deal with a variety of errors the proper way in Python.
|
|
|
show
|
2:36 |
Let's jump right into our demo here.
Over in the GitHub repository, we're going to start with a movie search app.
And this is called "movie search error edition." Later, we're going to actually build this app from scratch.
We're going to talk about the underlying API and all that kind of stuff.
Right now, we're just going to run it and try to solve the errors that it might encounter.
Now, there's two parts here: there's the starter, exactly where I'm starting from, and I'll leave this here, in case you want to play with it.
This one, we're going to involve into the final one.
Now, before we open this up, let's create a virtual environment, there we go, and I'm going to throw it into PyCharm, and use whatever editor you want.
This is one we're using.
This one actually depends upon a package called "requests" So, if we come over here with our virtual environment active, we can say pip install requests or you can just click this little hyperlink thing right there.
Either way, we're going to have to do that before this will run because that's how we're getting to the internet.
So, here's how this program works.
Like I said, we're going to, in a different set of three days, we're going to build this thing from scratch and really focus on the API.
We don't actually care how the API works.
All that matters is, we pass a keyword here, and it's going to go over to a service over at movie_service.talkpython.fm.
Do a search, get back some JSON data, and then return those here as results and we're going to loop over them.
Now, I've introduced some extra errors here, alright, sort of a chance of something going really, really wrong, just to give us some variety.
The most likely error you're going to run into is a network error.
Let's just see if this runs correctly.
How about "Capital?" Cool.
There.
We've gotten three movies back and see their IMBD score right there.
It looks like it's working, except for sometimes it's not.
It actually has these errors baked into it.
But the one that we're definitely going to hit as we come over here, we turn off the wifi, this won't be so good.
So, now if I try to run this, let's see what we get.
Test, maybe?
Uh-huh.
request.exceptions.connectionerror.
And what went wrong, the connection pool had some kind of problem.
Max retries exceeded with URL, caused by ...
We couldn't get to the server, right?
So we turned off the internet, it crashed.
Instead, what we'd like to have happen is our program go, hey, couldn't get to the server.
Is your wifi off?
Check your internet connection.
Are you at a coffee shop?
Then you have to maybe authenticate to the local network, where you say you agree to their terms or whatever, right?
So we want to catch these errors instead of having this nasty crash and give a helpful message to the users.
|
|
|
show
|
2:30 |
We've seen that, calling this API, may raise errors.
And notice the WiFi being off, pretty much anything we search for is going to result in an error.
So, we're going to turn the WiFi back on.
But before we do, let's convert this full on crash to something we can catch, maybe log, send a message to the user.
Or we could try again, who knows?
Here's how error handling in Python works.
What we're going to do is, there's a couple options.
We could treat this as a separate section.
Let's say, this part that actually interacts with the data does the request.
We're going to treat this as a block that should either work, or not work here.
So, we can come up here and type the word try: And indent that into the block.
Then if something might go wrong, we'll say, except: And I'll say, print Oh, that didn't work.
And we'll just print that out.
Yeah?
Now Python says this is a little aggressive, it's too broad, but, that's okay.
This is going to work for now, and then we'll refine this a little bit.
So now if I run it, oh that didn't work.
It's a big bad crash, we just say, "You know, that didn't work." We could've logged it.
We could actually loop around and try again.
All sorts of things.
But at least we're giving proper feedback to system here.
Let's turn this back on.
WiFi's back.
Let's try again.
Let's search for capital again.
Boom, it's working.
Here's how the flow goes.
We're going to run every function here.
And if it succeeds, it's just going to run from here to there and then skip over this except block.
But if at any step something goes wrong, like, suppose, say right here, this title doesn't exist, and it's going to be an error the first time through or something.
It's going to immediately stop what it's doing and jump down here.
If this throws an error, we're not even going to run this prank code.
We're just going to jump straight from here to there to deal with it.
So, we can try some stuff, didn't find anything.
Eventually, we'll run into these random errors.
That one didn't work.
So, this is great, but what didn't work?
Wouldn't it be nice to know what is going on?
It turns out there's three or four categories of errors.
One of which is the network is down.
But there's actually others.
So, we're going to adjust this to handle these particular errors.
So, here's how we can stop the errors from crashing our program.
But let's see how we can actually deal with the errors in a more fine grained way.
One message for say, network errors.
Another message for say, if you didn't input any keyword to search for.
|
|
|
show
|
4:04 |
So we've stopped the errors from crashing our program but we can't do anything meaningful, we can only say, you know, that didn't work, sorry.
Let's be a little more prescriptive here.
So up the top, we need to work with the various exception types, so we have to import some stuff.
So we'll say request.exceptions down here.
Now in this area, we want to catch the different types of problems that can occur, and the way we do that is we say except: and then we say 'different types', remember when we looked at that trace back, the first thing is the category, or the type of error, and the second part after the colon was the description, just more details.
So what we need to do is, we could have potentially multiple ones of these, we'll say this, we'll say, request.exceptions.connectionerror, okay?
We be able to just go like this, and just do a little print here and say, so maybe we'll say something like, 'couldn't find the server, check your network connection', make this really obvious like that, and print that out here.
Now, it could be if this was like a web browser they could've typed it in wrong, but we've hard-coded the URL, we know that that's correct, so if they can't connect it's not the server doesn't exist, it's really that there's some problem getting to this one known server.
So let's try this again with my internet off.
We'll come down here and search for test.
'Could not find server, check your internet connection.' Oh, how cool, that's way more helpful, we know exactly what went wrong when we want to handle that problem here.
Now the network is back and we have another problem.
If we enter no search term it's going to freak out and throw what's called a ValueError, and say, 'hey that didn't work.' But all we get is, oh, that didn't work.
So we could do a little bit better here, we could say, put this core exception here, and we could put some details like so.
This is kind of going to be our fallback, we don't really know what's going on, so we're going to try this.
Let's try again.
Oh, that didn't work, 'you must specify a search term', and if you're just debugging it to try to figure out what's going on here you'd say, what is the actual thing that I'm getting here?
What is this actual error?
It's a ValueError.
Okay.
So now let's go add an except clause for that.
Now notice this is gray because we're not using it, and when we're not, we can just leave it off like, as we did with the request here.
So we don't need any details, so now, try to run this with nothing, 'error, you must specify a search term.' Now we can really tell the user what's going on.
We have a few more errors that we could potentially deal with, I wouldn't leave this here like that, and these other errors are just kind of random stuff that I threw in there to make the program crash.
One is a StopIteration, and the other is the one that you saw at the opening, which is a TypeError I believe.
So we'll just let those fall through here because there's not anything we can particularly do, they're just sort of random noise in the system to make sure you get some interesting crashes.
These have real fixes, so we have a special message for them.
The final important thing to see here in this whole try except block, is the order in which we specify the errors.
If we change this around and we put this up here at the front, PyCharm's probably going to freak out and say, "no no no, you'll never be getting to these." If we have something general, and this is a derivative of exception, this is not going to work.
It's actually just going to stop.
The way it works is, it runs, if there's an error it just looks, goes, 'is the error this type, is the error this type, is the error that type?' And, if it comes along here, this is going to catch almost everything, and so, even though we have this, you'll see if I run it and I hit enter, that didn't work.
I mean, we still did sort of print this out, but it's not letting us get to the part where we expect it.
So it's super important that this goes from most specific to most general.
So, here we have it; we've figured out what types of errors our program might throw, and then we can handle them independently based on the type.
|
|
|
show
|
1:42 |
Let's quickly review the concepts of try and except blocks in Python.
Python's primary error handling style is what's called it's easier to ask for forgiveness than permission.
As opposed to, say, C style of look before you leap.
In C you check, check, check, check, check, and then you just try to do the thing and hope it works.
Typically what happens when it doesn't work is either you get a false sort of return value there or just the program just goes away, it's really bad.
Python is a little bit safer in that it's more carefully captures up the errors and converts them to exceptions.
So if it's going to do that anyway, let's just try and make it work.
And if it doesn't work, well, we'll catch it and deal with it in that case.
So it's kind of an optimistic way of handling errors.
so what we're going to do is we're going to say try and do all the stuff, and we're going to hope that it all just works and kind of assume that it will just go through that block.
But if it doesn't, we're going to drop into one of the specific error handling sections.
Here we have two possible errors, really one that we're dealing with, and the rest is kind of a catch all.
So we're saying except connection error as CE, and then we're going to deal with that.
And in this case we might need to look inside the error to see, well, was there a DNS problem, is there a network problem, did it not respond, things like that, did we get a 500 back from the server, all kinds of things.
So this connection error, we're going to catch and deal with that and then we do this more general except block where here's something we maybe didn't think of, we're going to catch that and at least try to somewhat not crash.
As we talked about before, the order matters.
Most specific goes first, most general last.
If you get that order wrong, you'll never get to your specific errors.
So most specific, most general.
This is error handling in Python.
|
|
|
show
|
1:18 |
Now you've seen how error handling works in Python, it's time to put it into action for your code.
Before we get started, I just want to make the point that one of the key differentiators of professional programs and applications as opposed to simple scripts that people just throw together, or code that beginners write, really often has to do with the error handling and ability to continue working when something goes wrong.
This error handling and exception processing in Python that we just covered that is really central to it.
Professional apps still crash of course, we still run into problems, but they do so much less often and when they do we typically have logging and real-time error monitoring with things like Rollbar to let us know and so when they happen we get lots of details and we go back and fix them.
That sort of hardens our app over time.
Right, so your goal is to add this error handling to one of the applications.
So you've already watched the video so that's great.
The thing you're going to do for Day 1 is you're going to go and look through the applications you've already created as part of this #100DaysOfCode challenge.
Or if you want to pick something else that you've maybe written outside of this course you're also welcome to pick that, and we're going to take that application and improve it.
So that's today, you've already done most of the learning and then just pick the app you're going to work on for the next two days.
|
|
|
show
|
1:00 |
Day 2, your goal is to discover all the error conditions that you might need to catch, and actually determine the exception type that that results in, in Python.
Are you working with something that talks to a database?
What kind of errors could you get from the database?
Are you talking to something that goes across the network?
What type of errors come across, from say, the network being down or DNS not working, or the network being on, but not being able to reach the host, all those sorts of things.
So come up with that list, and figure out what type, what actual exception type in Python does it surface as.
All right, if it's a connection error it could be something built into the standard library, or it could be something in say, requests, as we saw in our example.
So, you're going to have know exactly what those types are so that you can actually write the probably error handling code.
That's it for today, it might be a little bit tricky to get your app into all the different situations that it's going to encounter, all right?
Some of these errors are hard to trigger, but do your best to figure out all the various error cases you're going to run into.
|
|
|
show
|
0:51 |
Day 3, it's time to take those errors that you've discovered and put in specific error handling for each one of them.
So here I've written out a little try-except block that shows the standard error handling in Python, you can use this as a template, take the various types of errors you found on Day 2, figure out how you might either deal with them or at least let the user know, keep your application running.
Add the error handling to your code, make sure that it actually does handle the errors, you know, get the thing to fail in whatever ways you were doing before to find the errors, but now you should have some kind of nice response that's not a full-on crash, maybe it even keeps running and just asks the question again, something like that.
Now that you know how to do error handling, you have some practice with it, when you're writing your applications, be sure to think of the errors that can happen, put the error handling in place, and fail gracefully.
|
|
|
|
24:11 |
|
|
show
|
0:35 |
Welcome back to 100 Days of Python.
In the coming three days I will be your guide explaining regular expressions in Python.
First we will look at when not to use them when we can use simple string methods.
Then we will dive into search and match, capturing strings.
Final, compiling your regexes, and advanced string replacements.
Day 2 I will give you some more material to read and practice online, and the third day I have some really good exercises to get your hands dirty with regular expressions.
|
|
|
show
|
1:55 |
Let's dive straight into a notebook I've prepared for this class.
It's sometimes said that I have a problem, I use a regular expression knife too, and in a sense that's true, that they're intimidating when you start.
But there are only a few rules so get some practice and you will see that they're not that difficult.
Let's import the re module.
First of all, there are cases that you don't want to use a regex.
The standard string methods are pretty powerful and cover some of your needs already.
For example, I have a text.
'Awesome, I'm doing the #100DaysOfCode challenge' And we want to see if that string starts with 'Awesome' so no regular expression needed for that you can just do text starts with Awesome and True.
Or does it end with 'challenge'?
It does.
Or does the case insensitive version of text has '100DaysOfCode' in it?
Now for that you'd first want to lowercase the string and then you want to see if 100DaysOfCode is in that string.
And it is.
And what about replacing?
So I am bold and I'm taking 200 days of code.
I don't recommend that by the way.
Well you can just do a text, replace 100 text strings by 200 and awesome, I'm doing the 200 days of code.
So for these kind of string operations, you don't really need a regex.
So look at the string operations that are available in Python and use those instead.
|
|
|
show
|
1:49 |
Now those string operations were pretty basic, but usually we need something more advanced.
Meet, regex.
The re module has two main methods.
search and match.
match, matches from start to end.
Search can match a substring.
It's best to use an example.
I'm using raw strings by the way, because then I can just use special characters with a single backslash and not having to escape them which makes my regexes more readable.
So again, we have the same awesome I'm doing a 100 days of code challenge and let's...
do a re.search first.
So I'm going to...
match a...
part of that string and you can do this as well with just I am in but the point is to just show how you would make a regular expression and what a match object would look like.
To contrast that with match, this won't work.
Oops.
Match takes two arguments.
So this is None because match ends end to end so I am is not the full string.
So to do a proper match we would be doing, start with awesome, end with challenge.
On text and that works.
And here you see the first part of a pattern which is '.' which matches any character, zero or more of them up until challenge.
|
|
|
show
|
2:16 |
A common task is to capture strings using a regex.
Here we have two strings, 100 and 200.
What if we want to extract number days of code out of these strings.
Here's how you would do it.
First, I do a research.
And I use the capturing parentheses.
What this will do, any regex inside these parentheses that matches the string will be stored in a match object, which we can access with groups.
Hashtag, one or more digits, days of code.
As it is searched, re is happy to just match the substrings.
So I don't need make sure that the whole string matches.
If this would be match.
Let's do it actually.
I would have to account for anything that comes before, and anything that comes after.
Of course I need to give it a string.
And let's see what happens.
So first of all we have a match object, and to get the actual matching string I can do groups.
And it gives me a tuple of the matches.
So to get the actual string, I can just use indexing.
And I got 100 days of code.
Now this will work the same for 200.
Let me show search, that was my initial intent.
Search, then I don't have to account for end time, so I those wild cards out.
I'm going to use 200 to show the match object first.
And again, 200 days of code.
So you see the power of regular expressions, this is still very simple.
I can just say one or more digits, followed by a string, and it will match both 100 and 200 days of code.
So that's how you capture strings with the re module.
|
|
|
show
|
3:20 |
And now my favorite method of the re module: findall.
findall is useful to match a pattern in a string, and to get all the occurrences of that pattern.
In 100 Days of Code, we wrote a script module in that, which returned three columns: a module, if it was standard lib, and the days that we used it.
As you see in the re module, we used quite a lot.
And it will give a link to the actual scripts at the end of this lesson.
Let's write a regular expression to extract all the days, and findall really shines in this kind of task.
So we do re.findall ...
raw string.
One or more digits, and we have to specify the string as the second argument.
And look at that.
One simple statement and we got all the days.
That's awesome.
Let's do a second example.
Here is some text, and let's extract the words with a regular expression first.
re.findall, if I could type.
raw string.
One or more characters.
Text, and I first need to load that in.
Bang.
Now you can do this, also with text split.
I'm going to make it just the first five one.
So you don't really need a regular expression to split a text string into a list.
Let's say we want to find out the most common words, but only the ones that start with an uppercase character.
So, then you can use a regular expression like, and I'm using character classes which are in square brackets, so let's define an uppercase and then we have one or more lowercase characters or digits, and the plus is one or more, if you want zero more you do an asterisk.
And we want to do that on the text.
And here we have all the words starting with an uppercase.
Now just for the fun of it, let's wrap that in a counter to get the most common words.
So we are going to use from collections import counter, and don't worry I will cover counter more in detail in the collections lesson.
Counter receives a list, so re.findall returns a list as we saw earlier.
So we can just make a counter object, passing that into the counter, and as you see we get some counts here.
And to find out the most common words, we can then do the most common method on that counter object.
And lorem and ipsum are the winners.
So very powerful tool.
I really like findall.
This typical Python example, that in one line of code you can do a lot of good stuff.
|
|
|
show
|
5:23 |
Compiling regexes.
If you want to run a regex multiple times, it can be more efficient and convenient to define it in a re.compile statement.
Let's work with some data.
Here I define a list of movies and two extra things in Python.
You can define a multi-line string with triple quotes, and you can build up a list by splitting a multi-line string, or whatever string, on a space or in this case, a new line.
So this gives me a nice list of the first element, one Citizen Kane, second element, Godfather, etc.
And the task here is to identify movie titles with exactly two words.
Before moving along, maybe you want to give this a try yourself.
I hope you had fun working on this little regex problem.
And an extra concept I'm going to show you is the use of re.verbose, which allows you to wrap your regular expressions over multiple lines and add commands, which is great to teach them and makes them more readable.
So let's load in the data and let's start writing a multi-line, medium advanced, regular expression.
And as we're talking about compiling one, the syntax for that is re.compile.
I'm using a raw string, and as explained before, you can make a multi-line string with triple quotes.
And I'm going to write this out because it's quite a large regular expression.
And then we come back and I explain line by line what it does.
So here you go.
To define the start of a string, we use the caret then we need to match one or more digits.
Let me scroll a little bit up to see the data, so the numbering of the movies.
Then we match a literal dot, and note that I escape the dot otherwise it would match any character.
Then we have one or more spaces.
And then I use a non capturing parentheses.
So we've seen capturing parentheses before, but if you add inside parentheses, question mark, colon, it kind of undos the capturing.
Then you can group the various things together without capturing.
And we use a character class then to include uppercase, lowercase, and single quote.
And we want one or more of them, followed by a space.
And I commanded that all at the right.
Then we do the closure of that parentheses.
Then we want exactly two of those.
So just go back to the data, and that's basically a word.
Why don't I do just backslash w?
Turns out that was my first approach, but, and that's the funny thing with parsing data or strings, is that they're always these exceptions.
And singing has this apostrophe or single quote and I had to account for that, so instead of just word, I had to go with a more specific portion of the regular expression.
So two of those because we want to match the ones that have exactly two words.
Then, we do a literal open parentheses, and as with the dot, right, all these characters have a special meaning.
Dot matches all, parentheses are for capturing, so if you want a literal one, you have to escape them.
So here I'm doing the same thing as with the dot, and that's escaping the parentheses.
I want literal parentheses, because the years are in parentheses.
Then the years are four digits, and then I do a dollar which is the end of the string.
Phew, that was quite a regular expression, but the nice thing about verbose is that I could add all these commands, which made it super easy to explain it to you.
So run that cell, and it's now stored in pat.
And pat is just variable name, and now I can use that pattern to loop over the movies and match them all.
So let's do that next.
Four movie in movies.
Print movie.
Just the text.
And then I can use match on the pattern.
So before we did re.match, but now we can do pattern.match.
And I'm interested in match because I want to match the string from beginning to end.
Put in a movie and there you go.
So let's check if this regular expression is actually correct.
Citizen Kane, two words.
Match.
The Godfather.
Match.
Casablanca, one word.
Not a match.
And Schindler's List, this was another tricky one.
In the first iteration, I did not match this because again, I had to account for that single quote which I told you before.
So this one is actually a match because I consider Schindler's as one word.
Vertigo's not and The Wizard of Oz, four words, is not.
So how cool is that?
Let's move on to advanced string replacing.
|
|
|
show
|
2:54 |
Welcome back to the last section on the regex lesson.
This video will show you advanced string replacing using re.sub.
For example, we have a string here on doing the 100 days of code, 200 days of Django, and, of course, 365 days of PyBites.
So you're doing a simple string replacement.
It's a bit ugly, right.
So this will work but.
When you start to do things multiple times, you have to think about a better way to do it.
So let's use re.sub to make a more flexible replacement regex.
So re.sub...
raw string and I want one or more digits and I just want to replace those by 100.
And I do that on the text and this works as well and it's more flexible because if there are will be like five or six of these hashtags with different integers, they all would work.
Now let's look at a more advanced example where we also want to capture the thing we replaced.
Say, for the same string, I want to replace the thing after the days off.
So all should be Python, but we want to respect the integer so I want to have 100 days of Python, 200 days of Python, and 365 days of Python.
Doesn't really make sense in a sentence but it does for our exercise.
And the way to do that is to write a re.sub...
raw string.
And let's define the regular expression as a literal hash.
One or more digits.
Hard-code days of one or more alphanumeric characters.
Here, you see these capturing parenthesis again.
I'm going to use that in a replacement part which is the second argument and I can reference that with backslash one.
So what this does is it takes the...
match of hashtag...
digits days off and I'm going to put that in the replacement string.
And then I want to hard-code Python and I want to do this on text.
And there you go.
Awesome, I'm doing 100 days of Python, 200 days of Python, and, of course, 365 days of Python.
That's a wrap.
I hope you enjoyed this and got a better feeling of how to write your regexes in Python.
Of course it's not a complete list of all the features and that's why in day two I will provide you some more resources and things you can check out.
|
|
|
show
|
1:58 |
So, let's do a quick wrap of what we've learned so far.
When to not use regexes.
Well if simple string operations do, use those.
Re.search versus re.match, re.match matches the whole string, re.search matches part of the string.
Those are probably the main methods you will be using on the re module.
Capturing parentheses, to access part of the match use parentheses and you can use groups on the matching object to get to the string.
Your new best friend findall, one of my favorites.
To get all the occurrences of a pattern in a string, you can us findall and I showed you two examples.
One is to get all the days or numbers out of the string and it returns a list, and findall combined with counter one line of code a lot of stuff gets done.
Compile for regexes, so you can use re.compile to compile a regex to use over and over again.
And you can add a verbose switch to make regular expressions none space sensitive so you can line 'em out over multiple lines, making 'em more readable.
String replacements, resub.
Again if you can use string replace do that but sometimes the pattern you want to match is more sophisticated and you need a regular expression.
The way to use read outsub methods is to define your pattern.
Again I prefer you using a raw string to not to escape the back slashes.
And the second argument is to put in your replacement.
And here's a little bit more advanced example.
Where you use capturing parentheses to port part of the matching string to the replacement arguments.
And now it's your turn.
|
|
|
show
|
2:08 |
Welcome back to 100 days of Python.
This is the second day of the 3 day regEx blog.
And today I want to give you some pointers to get more familiar with regxxes and start to write your own.
So we did an article, 10 Tips to Get More Out of Your RegExes.
I recommend you read through it.
One thing I didn't touch on is greediness, which is important and can prevent nasty bugs.
And if you're still more a beginner in regex land, there's a nice talk at the end by Al Sweigart.
Who by the way wrote an awesome Python beginner book, called How to Automate the Boring Stuff, and it's called Yes, It's Time to Learn Regular Expressions.
And that gives you a very nice overview of regular expressions.
Secondly, there's a nice how-to on the Python documentation page.
Very refreshing how-to.
I read this when I wrote the 10 Tips post, it's pretty dense, but it is a very good primer into regular expression, and what all the specific syntaxes mean, etc.
If that's too much reading, which I can totally get, there's a nice online RegEx tester.
And you just select Python, and you can write here your regular expression, and test it in real time.
For example, I have some HTML with two paragraphs.
And let's experiment a little bit with that greediness I mentioned.
So let's match all of it.
So that's greediness because it takes everything from the starting paragraph tag to the ending one.
If I do a question mark, the match becomes shorter.
It only takes the first paragraph.
And you see all this nice feedback and explanations here.
So that's a really great tool to experiment writing regular expressions in Python, because you get instant feedback.
So that will be the third resource I have for you today.
Just spend 20 or 30 minutes experimenting with regexes, and you'll see that they become a lot easier.
Good luck.
|
|
|
show
|
1:53 |
Welcome back to 100 Days of Python.
Wow, you're almost done.
It's the third day of the regex 3 days block.
I hope you're enjoying this and getting a good grasp of writing regular expressions in Python.
So in this third day, let's get you some more practice, and I have some exercises lined up for you.
First of all, we have, on our Code Challenges platform, Bite 2, Regex Fun, where you can solve this problem of extracting course times out of a string, getting hashtags and links, and match the first paragraph.
Then we have mastering regular expressions also as a blog challenge.
And if you like to work more in your own environment, I encourage you to do this one because you get a branch on the code challenges repo and you can just work on your system.
And finally, I mean, those exercise, we think are good practice, but of course feel free to get your own data, and parse it, use regular expressions to clean the data, etc.
It's actually how we got started with code challenges.
We came up with this exercise where we saw this JavaScript course and we saw all these timings, but there was not a total so the first pilot code challenge was, go filter out these timestamps and calculate what the total course time is.
It's not necessarily curriculum stuff, but it gets you to practice.
And with practice comes mastery.
So use any data you want.
The goal is to use more regular expressions.
And don't forget to share your work on Twitter.
You can mention the handle @100DaysOfPython.
Good luck, have fun, and remember: Keep calm and code in Python.
|
|
|
|
26:06 |
|
|
show
|
3:24 |
Hey, this is Michael, and I'll be your guide for the next 3 days.
And over those 3 days, we're going to talk about recording the actions of your application, giving you insight into how your app is running, how users are using or misusing you code, and even capturing crashes that might happen.
So, if you run a website, and the user says, "Hey, your site crashed." Here's a 500 server error page from Get Up, for example.
If it crashes, what do you do?
They say, "Well, I clicked this button, "and it just crashed." Great, if you click the button and the button works, well, you're in a really tough place trying to reproduce that, unless you recorded exactly what they did and exactly what went wrong.
So we'll see with logging that that's super easy to do.
So next time they call you up and say, "Hey, something crashed," you can actually go look and see what happened, and that will give you a much better chance of, one, reproducing what they did, and two, solving the problem.
Let's take a look inside the log file for Talk Python training.
So this is somewhat condensed.
This is one log file from one day, but it's compacted so you can see the different scenarios within it.
And it's also edited to be anonymous.
We're actually keeping more information in our log files, but I don't want to share people's private information, so this is what we're going to get.
Now, if you look through here you'll see a couple of things.
There's notices, there's errors.
For example, here's a user action.
This particular user from that IP address has successfully logged in.
You can see information about their browser, and their IP address, and the time, and all that kind of stuff.
We have some more user access.
Here somebody's subscribed to get notified.
They basically gave us their email address and said, "Hey, mail me when there are new classes." Down here, our user happened to have logged out.
They were logged in, and they did some stuff, and now it looks like they're gone.
They were running Windows 10, for example, with Firefox.
That's cool, so these are the types of things you might record, but we also have other interesting stuff.
For example, why is a search engine trying to search a authenticated only lecture page?
So, for some reason, it's trying to go to this page.
Either it doesn't exist, or it's not allowed to get to it.
But, for some reason, people's trying to get here.
So maybe we should go and figure out what's going on, either make that page accessible to Google, or maybe we're linking to it in a way we probably shouldn't.
Look at this appear, though, this is a little nefarious.
We see somebody coming in and trying to go to wplogin.php.
That's WordPress log in.
This page, this site, is not written in php, it's definitely not WordPress, but here somebody's trying to get into it.
And they're telling us that the user agent is Firefox 4.0.
That's unlikely, 'cause that's so old.
Here we can see somebody's actually trying to break in.
If we look carefully, they're doing it again, and actually again.
This happens all the time.
People are just probing for known ways to get into your site, get into your database, and so on.
So knowing what is happening with your application, it's really important.
It might be obvious what the users are doing, maybe.
It's really unlikely that it was obvious that people are trying hack it, that search engines are trying to search hidden parts of it, things like that.
So having this log information is really, really important, and you'll see it's quite easy to add to our apps.
|
|
|
show
|
1:18 |
Python has built in log in and you can do log in without any external dependencies.
But I would like to introduce you to this concept to this package logbook.
Now this as you can see here replaces Python's standard library for logging and it does so in a way that makes it really easy to work with logs in our application but also super flexible.
So for example, we can come over here and import the logger and we can just say "I would just like to push all the log messages to standard out", could be a file also for example, now we'll create a logbook and then we just log.info, log.trace, log.error, we sort of categorize the response, the message we'll send that way and you get something like, well see below but also what you see in stock Python.
Why not just use the built in one?
Well, this is nice and clean and it creates a nice hierarchy, really really cool for when you use it your application.
But also it's way more flexible, look at this, how about getting a notification to your phone or pushing notifications or something like that under certain log message situations.
Really cool.
So we'll see the logbook is really powerful and it's actually created by Armin Ronacher who is the creator of Flask, one of the most popular and well liked Python web frameworks out there.
|
|
|
show
|
2:13 |
For our application, we're going to return to something you've seen on day 10 and on day 25.
Let's go over here to the GitHub repository.
We're going to go back to our Movie Search application that's going to call a web service and talk to the server; talk to the Movie Search service that we've already talked about in terms of using JSON APIs, and in terms of air handling.
There's no record of what happened with this app, so we're going to extend it further by adding logging to this simple application.
Over here on the logging section, you can see we have a starter movie search in case you want to recreate this for some reason, and then here we have what's going to be the final version.
Before I open this in PyCharm, let's create the virtual environment.
Here we are in the directory we're going to work in.
Create our little virtual environment here, and we'll be done with that.
We're just going to open this in PyCharm.
Here we are in this application.
We should have our virtual environment active; we do.
We don't have anything installed; we have a requirements file that says we have to have requests, so let's go ahead and install that.
In fact, we're going to use Logbook, so I'll go ahead and add Logbook here as well, and then we can say "pip install -r requirements".
Or, I could just click this.
Great, now we have Logbook and we have requests and their various dependencies.
Let's just go ahead and run this real quick here, so: Run the Program.
It's going to go off to the server; let's search for Capital: we found three movies there.
We could search for Action, and we're getting stuff back.
However, if we turn off our internet, we try this again with anything, Boom: "Error.
Could not find server.
Check your network connection".
Recall, over here, we added our try-except block and we have these various pieces there.
What we're going to do is take this application and record a couple of things: what people are searching for, maybe how many results were found, the time of day when that was done, and of course if there's any errors, we're going to record those errors as well.
|
|
|
show
|
4:31 |
Okay are we ready to start adding logging to our application?
There's two steps.
One, we have to globally configure how we want to log things.
Do we want our log messages to go to just standard out, so the terminal or console?
Do we want them to go to a file, if it's a file do you want that file based on a date and roll as the days change, or do you want that to just be one big file?
Or do you want to send that somewhere crazy, like, email or desktop notifications, as you saw is possible.
So we're going to configure logging and then we're just going to add the log actions as a separate way.
That actually turned out to be super easy; the only thing that's a little bit complicated is setting this up.
So let's write a function over here that will let us do that.
So we're going to pass in a filename, and it can be, let's give it a default value of None.
It can mean nothing, or we could pass in a filename.
So what we're going to do, is we're going to go over here and we're going to actually set the level first.
So here's how this works; we're going to say our current application is operating at level of notice and above.
So there's like a hierarchy of levels in the logging, there's like, trace, which is just super-verbose stuff, there's error, which you almost never want to skip, but maybe under normal operations you don't want to show the trace.
Only the notices and the warnings and the errors.
So we're going to set this here.
So we're going to use logbook, which needs to be imported at the top, which we've just had PyCharm do, and then we can come over here and let's say, let's set it to 'trace' for just a minute.
So we have it absolutely verbose, then we'll dial it back when we're done.
Alright, so we're going to choose a level, and then based on whether we have a filename or not, we're going to assume the fact that there's no filename, or one was not specified, that that just means 'send it to the console'.
But if there is a filename, we want to do that.
So we'll say this; if filename, we want to put it in the file.
So we'll say; logbook, now there's all these little handlers in here.
There's a file handler, a 'fingers crossed' handler, a Gmail handler, hashing, mixing, mail, etc.
etc.
The one that we want, is we want a filename that is based on the days.
So it has the date involved in the filename.
When the date changes, it automatically creates a new file, and goes from there.
So that's going to be real nice.
So to accomplish that, what we need to use is a time-rotating file handler.
And this takes a couple of things.
We have to obviously give it the filename, we're going to set the level, be the level, and then we want to set the date format so it knows how to roll that out, and it has a default there, and actually that default is totally fine, so we're going to leave this off but if you want to change that it's year, month, day, is how it's going to print that out.
Okay, so we'll go like this, and that's going to create the handler and then we would just say, 'push to application'.
That means every action we do with logging is going to use this underlying system here, so if that's not the case, we're going to say, 'logbook not stream handler', we'll give it a stream, which we need to import this at the top, 'standard out'.
That's just like what happens when you say 'print'.
And the level is equal to level again, and in this case we're going to push that to the application.
That's it.
Long as we call this function, things will be initialized.
But before we get on, let's make our first log message to be something that says, here's how we've configured logging.
So here's a little message that we might have, we'll say, great, the logging is initialized and the level is trace, or something like that, and the mode is either standard out mode or file mode, and we can create one of these logs and we'll have this little startup logger, and then we can just say 'logger.' let's say it's going to be a notice.
Okay, so this should be our very first message, and let's just come down here and say we're going, before we even call main we're going to say, 'init logging but no filename'.
Let's run this and see that we've got everything working.
Woo-hoo, look at that!
We have our time, we have the level, 'notice', this comes from the log category, it's the start-up log, this is the message that we actually wrote.
Logging initialized, level is nine, which is a stand-in for 'trace', and the mode is standard out, that's why you see it here and not in a file, and of course our app still works.
|
|
|
show
|
4:44 |
Now that we have logging configured and we are calling that to set everything up let's go and actually create a app level and an API level logger, so let's call this the app_log and this, we already saw me say Logbook.logger and we give it the category so I'll call this App right and then we can use that throughout this part of our program and we'll know not just what the message was but generally where it came from and let's do something similar over in the API section.
So we'll call it api_log to import log book again and this will be API Okay, so when we're doing an accents with the API, maybe the timing and so on we could track that over here.
Let's start with the app log.
Now, I always find there's a super tricky balance between too much logging code getting into your application and making it hard to read being too verbose and not capturing what you need so this is a pretty simple example so it's a little bit hard to find that balance but,you can see that it's pretty easy to read.
Let's deal with the error cases first.
Let's come down here and say app_log It's going to be an error.
So this could either be error or it could be a warning right like our program isn't broken it's just in an environment that it can't operate in.
So I'm going to call this actually a warning.
I'll do a bore in here and it'll say same message.
So we can come out here and refactor that to a variable and just call that message more in the same little message like that.
Actually, we already have a classifier there so we'll say like this...
Same thing here...
You see it's getting harder to read but we will have a record of this so that's pretty cool.
Now this one, like these two we anticipate right.
This is if the internet is off.
This is if they don't type anything and they just hit enter.
This is kind of standard stuff so that's why it's a warning but down here this is like we didn't expect this.
We have no idea what went wrong.
Something went wrong.
We could say this error and give it the message with the formatted exception details added in there right?
Or there's actually a way to say there's some kind of unknown exception.
Just record that as an error so we can actually say exception and just give it the exception like this.
Okay, so let's go and try to run our program now and see what we can get to happen on it.
File just search for T, looks like it works so I'll just run a few searches see if I can get that exception error to hit.
Okay here, there's a very rare chance that some random error's going to be thrown.
Recall that from day 25 and I got it finally after a bunch of attempts to throw a StopIteration exception.
So here you can see it recorded as an error.
It said this isn't a category app and then it just put the trace back right there.
That is...
this section right here.
Let's try some other errors.
We know that it's an error to hit enter and that's going to be a ValueError because we're searching for nothing.
Here you can see error, you must search for a term.
This is just the print statement right there.
And then here, this is the log statement that we put as a warning.
Right, warning,the app says you must search for a search term and that's because we put it in the log as warning 'cause we know it's not technically broken.
The user's just using it wrong.
So the final thing to test is to turn off the internet.
Alright look, we got our standard print and then we got our log message which is warning app at the app level we could not find a server, check your network connection.
Alright, let's just add one final sort of success message here.
Let's go down here and say like app_log this info trace I don't know.
Let's put it at trace so this is super verbose but we can say something to the effect of..
Clean that up a little now let's see how this works.
Run it successfully, search for action.
Perfect, it worked and we logged the fact that trace app search is successful.
The keyword is action.
There were eight results.
Let's search for runner.
Here we go, search, we got six results.
Keyword runner.
Alright, so I feel like we're getting some decent logging at this level.
The other thing I'd like to do before we call this done is to look in here and maybe see if there's something we want to put in here in terms of logging at a lower level just to show how we can work with different parts of our application.
|
|
|
show
|
2:26 |
Now we've logged at the general top level of our app, let's log down into our API interaction here.
So let's do a couple things, let's do some time tracking here so we'll import this.
We'll do this time thing so we know how long this takes.
So that'll give us a start and end time we come down here and we say something like this api_log.trace we'll do some verbose things like "starting search for keyword" and then let's put this bookend here, "finished search for keyword".
Some results in some number seconds.
Put colon g grouping, okay.
So what're we going to have?
How many results?
That's going to be len of movies and the duration is going to be t1 minus t0.
So this is great.
We can also come down here and say api_log.warn("no keyword supplied") We could come down here and maybe store the status.
That's probably a traced type of thing.
Request finished.
There's our status code before we potentially throw in exception so we know instead of 500 is it 404, things like that.
Okay, I feel like this is pretty good, let's run it one more time and see if our app is ready.
So we started our logging, that's good.
We're going to search for "test", see what do we get down here.
API started the search for test.
The request finished, status code 200.
That's good.
And then it finished in this amount of time, that's seems like a huge weird number so we'll do some clean up on that number and then it finished and it came over here.
So, that's all pretty cool.
Let's switch this to milliseconds and do an integer times 1,000.
One more to see how that works, quick test.
There we go, that looks a little more clean to me.
193 milliseconds for our request, everything was good.
Let's try some sort of error.
Starting search for nothing, warning no thing.
Now noticed over here we have our API levels and we have our app level and we have our start up code.
So it really tells you like what part of your application is talking to you on this particular message.
Alright, so I feel like we've pretty much added really nice logging to our application.
But we're not quiet done yet.
|
|
|
show
|
2:31 |
So far, we've got this almost unreadable log goo mixed in with our standard user input/output.
So it's really, it's nice that we can see what's going on, but it's really not helpful for us here.
So let's change this.
Let's just go down here and, to our program, and when we init the logging, instead of passing in nothing, we're going to pass in a file name, and that's going to go to the timed rotating file handler, the same level rather than the standard out.
Okay, so let's go down here, and let's, we'll just call this movie app.log, something like this, and run it again.
Alright, now it's back to the way it was before in terms of interactions.
There's none of that mess around.
Let's search for action again.
And it runs, and we get our nice output, and, ta-da!
Let's run it one more time.
Let's search for hero.
Ah, we got a bunch of good stuff with heroes and so on.
And let's run it with an error.
Nope, must search for something.
Alright, how about jazz.
Anything there?
Hmm, looks like there is.
Pretty cool, so that's great.
Our app is working again, but notice, notice over here, we now have a movie-app.
Instead of .log, it has 2018-02-23, because that's today, that's when I'm recording this right now, so let's look and see what's in there.
So you can see it's exactly the same messages.
Here's the app is starting up.
Here's the app starting up again.
Things like that, here's another startup.
And these are all the messages.
We started a search for action, we got a 200.
We got eight results, that long.
Alright, and you can see the time of day to the super accurate right there.
Again, we're starting up, and this time we searched for hero and got 10 results.
This time we searched for nothing, and we got a warning, and so on.
Okay, so we have this log file here, and it's not super important, it's less important, let's say, when you're writing a regular app, 'cause you could just put the data and time in the log file.
But if you're writing a super long running service, like a web application that starts and runs basically indefinitely, or some kind of queuing application that's just listening for messages and is going to run, basically anything on the server that starts and just runs, the ability to have it automatically rotate - when it becomes the 24th, the next log message will just start a new file, for example.
So really really nice to have this timed, rotating file handler here.
|
|
|
show
|
2:30 |
Now that you've seen logging and logbook in action, let's quickly review some of the concepts.
So, we're going to start by importing the logbook, And if we're going to not use a file, we're going to need to also import sys, so we can get to standard out.
Then we're going to maybe get a file name, that can come from, like a configuration file, the environment, you could hard-code it, whatever you want.
We're going to set a logging level here.
Now I didn't actually demonstrate it, but if we went and switched that to say warnings, you would no longer see any of the messages that were trace, right?
Only the stuff warning and above would appear in the log file, or in the console, and nothing else.
So you can dial this up and down, depending on whether you're running a debug build, or production build, or release build, things like that.
So, set this, and that may also be based on configuration, or version, type of app, right?
Like it's production or development and so on.
Then we have to install a handler, so we're either going to use a stream handler, set that to standard out, set the level of push it to the application.
Or, if you want to go to a file, I recommend the timed rotating file handler, and do the same thing.
Once this is set up, then it's basically ready to go.
So remember this level acts as a filter here, so you can always go logger.trace, logger.info, but only if the level is low enough, will it actually show on these handlers.
Now, you do that, what we just saw, once, at the beginning of your app, and then, anytime you want to log something, you're going to create one of these loggers, like, heres a start up logger.
And we have this little info message, like, hey, we're getting started like this.
Now this just a string, nothing logging about it.
But then we can go to our startup log and say notice, this message, right?
And that's a pretty high level of log message there, this notice level.
And this is going to go, probably near the front, so it'll tell you what level you're logging at, which will help you understand what the rest of the log means.
We have different options, we have notice, info, trace, warn, error, and critical.
So critical is even more of an error than error, right?
We also have exception, if you just want to show a straight up exception.
And then the output looks like this, it has the time, it has the level, here, notice, it has the log category, log name, in this case, app, and then it finally has the actual message.
Really nice, really easy to set up, and it's super, super flexible.
|
|
|
show
|
0:37 |
All right, it's your turn to do some logging.
Let's look at all the steps that I'm recommending for you.
So there's a little summary of why you care about logging, but we're going to focus on the three things, the three days, and what you're going to do on them.
Today, you're basically done.
It's watch the videos as usual.
What you're going to do is you're going to pick an application that either you've built in this course or previously built that you think could use some logging.
It would be nicer if it had some logging much like we just added to the movie search app.
So your goal for today is just to pick an app that you're going to study and add logging to over today and the next two days that follow.
|
|
|
show
|
0:31 |
Day 2 you're goal will be to take the application you chose yesterday and look at the flow, and think about what type of things do you want to keep track of.
Do you want to track errors?
Would you want to track timing?
Do you want to track inputs, outputs?
All that kind of stuff.
So think about what you're going to try to log and how you're going to do it.
Do you want this to go to a file system, do you want it to go to the console, all those considerations.
So just kind of plan out what you're going to do the next day.
|
|
|
show
|
1:21 |
Alright, final day, Day 3, of this block.
You're going to use logbook, and you're going to add logging to your application.
Now this is an external requirement, so I recommend you have a virtual environment dedicated to this application.
Once you have it and you've activated it, you'll pip install logbook to get started right here.
And then, you're going to need to do a one time register of the logging, and then you'll be able to use it over and over.
So here's the basic steps of how we did it in ours.
You could choose other handlers and do other interesting things.
The StreamHandler and timed, rotating FileHandler, those are the two that I like, but pick whatever you want.
And then once you're ready to log something, you can create this sort of once.
You can create as many times as you want, but also can be just queried the NAT level in the application.
And then you're going to use it and, say, "log.notice.
log.warn, log.critical" and so on.
So, take that little bit of information there, and what you planned on logging and tracking the day before, combine them, and make your app production ready with logging.
I hope you enjoyed learning about Logbook and logging.
Be sure to share what you did with us on Twitter, and hashtag it appropriately.
And that's it, you now have this new skill.
You can do really cool logging in your application.
And it's one of those things that pays off in the end.
|
|
|
|
36:16 |
|
|
show
|
1:21 |
Welcome back to the 100 Days of Python.
In the coming 3 days I will guide you through refractoring and writing Phythonic code.
One thing is to write Python, the other thing is to really leverage all the great stuff Python has.
The Zen of Python states there should be one and preferably one way to do something, and that's great because in Python there usually is one best way to something, and the more you know these constructs and idioms, the more readable and elegant your code will become.
For this lesson I've prepared a Jupyter notebook with 10 practical examples how you can improve your code.
For example use a with statement instead of a try, accept, finally block.
Or use enumerate to not keep a manual counter or what about refractoring a long if, elif else statement using a dictionary.
We will touch upon list comprehensions, generators, using explicit is better than implicit in your exceptions, string formatting, tuple unpacking, PEP 8, the Zen of Python, and even some common best practices writing maintainable code.
And for day two and three I have you refractor your code or the code of somebody else to really put into practice what you've learned.
So there's a lot to cover, I'm really excited.
Let's dive straight in.
|
|
|
show
|
3:00 |
Alright, let's do this.
Let's look at 10 ways to make your code more Pythonic.
Let's start with these typical big if, elif, elif, elif, elif constructs.
You must've seen code like this, right?
You have the typical workout scheme.
We check it Monday, elif Tuesday, Wednesday etc.
And if it's not a day we raise the ValueError.
Now this is pretty ugly but it's also not extensible in the sense that if want another maybe combination of Thursday and Friday to do something we have to add another elif.
What if we change this in using a dictionary.
So that we can just look up the key and return a value?
I got this picture from the Code Complete Book which is an awesome read about code quality.
So to refactor that, let's start with defining a workouts dictionary.
And I'm just going to copy these in because it's quite some typing.
Alright.
And that gives us a workout scheme.
And note that the dates are in random order because it's a dictionary.
By the way there's another way to make this dictionary.
And that is to use zip two sequences.
So if I define a list of days and a list of routines, we can do something like workouts equals dict of a zip and a zip takes one or more sequences.
So days, routines and here you can see we have an equal dict.
Alright, now to go back to this refactoring example.
Now with the dictionary in place you can see how much shorter and nicer this function looks.
So note I can now just do a get on the dictionary.
Looking up the day, and it gives me the routine or None, if today was not found.
So we can explicitly check routine is None.
And raise that ValueError, as we've seen before.
And otherwise, just return the routine.
Let's try it.
Chest and biceps.
What about Saturday rest and call it on nonsense.
Yes I get a ValueError because nonsense is not a day.
Alright, that's our first refactoring.
And let's look at counting inside a loop next.
|
|
|
show
|
1:30 |
Next up, counting inside a loop.
So sometimes you want to keep track of an index when you loop over a sequence, and when you come from C or another language you would typically do something like this.
Let's define a list of days and let's loop through them showing the day prepended by the number.
Alright, so that's straightforward.
Now, and this is correct, right?
I mean you can do it like this, it's all 100% correct.
But the more idiomatic or Pythonic way is to use enumerate.
And a way to do it is to wrap your sequence in enumerate, which returns the index and the item in the sequence on every loop.
So I can just, now, print those, and it should give me, oops, obviously, I should not hard code days.
So I'm using f-strings by the way because I'm on Python 3.6.
And yes, this gives me the same result, and there's even a nice little trick with enumerate, which is, you can give it a starting point.
So I can just copy this, and again give enumerate a second argument of 1.
So I want to start the counter at 1, and then I don't have to do this menu plus 1 inside the loop.
And that gives me the same result.
|
|
|
show
|
2:24 |
Right, next up is the with statement.
You all have worked with files by now, I suppose.
The way to open and close files is like this.
That's fine, that's not optimal but if an exception occurs between the open and close statements.
Let's demo that here.
So we write hello and for some reason an exception happens.
The problem here is that the file handle called f stayed open.
So if I check now for is f closed?
False, it's still open.
So it's leaking resources into your program which is a problem, right?
One way to avoid this is to use try and use except finally block.
Try an operation, you catch the exception, if there's one and the finally block always execute, so you could put f.close in there to make sure it always closes, right?
You would write something like this.
Let's just trigger an exception.
I divide by zero which is going to give me a ZeroDivision error.
Let's catch that here.
Finally, I will always close my file handle and I do that here.
Open the file, write something, trigger ZeroDivision error, catch it and either working or failing, I always get f.close.
Let's see if the file handle now is closed.
And indeed it is closed.
That's cool, right?
This is much better code, but there's even a better, more pathonic way to do the above and it's to use a context manager or the with statement.
I can rewrite the previous code as with open This is the same code and the nice thing about with is once you go out of the block it auto-closes your resource.
In this case the file handle f.
This raises the exception as we told it to do.
Let's see if f is closed.
And True.
Look at that.
I mean although I like try except finally, it's definitely a good feature.
This is just shorter, more pathonic way to do it.
Use with statements or context manager if you have to deal with resources that have some sort of closure at the end.
|
|
|
show
|
3:14 |
Right.
Next up, use built in, learn the standard library.
There's some very powerful built in functions you can use that save you a lot of code.
For example, you run the range of numbers.
Well instead of for e in, or do this classical for loop.
I'm not even sure how to do it anymore.
Now, in Python you can just numbers equals range 1 11 and the first.
The start is inclusive, and the end is exclusive.
So just issue a numbers range of 1 through 11 which doesn't say much but if I convert that into a list there you go, 1 to 10.
And I didn't have to go through a for loop specifying end boundary, etc.
So very nice.
What about sum?
Let's sum up those numbers.
But in Python, you can just use sum, and look at that.
It's easier, and less code, and saves you time.
Let's look at max and min.
So let's create some data.
Again to stay at the gym, I have routines and I have timings.
Let's make a dictionary.
Workout times.
Now see before I can use the zip with routines and timings and put that into the dict constructor to make a dictionary.
So here are the workouts, and the times and minutes they should take.
What I want to do next is to get the workout that takes most time and less time.
Let's do it in the proposed way, if you wouldn't know about max.
Yeah, legs was 55 minutes which was easily visible here.
Now let's see the max building in action, and you will see that we can do this in one line of code.
Workout times.
items.
Again items gets me a tuple, a list of tuples of key value, in this case routine and timing.
Then I can use the key optional arguments to give it a or callable or lambda.
In the lambda, I'm just saying what I want to sort 'em which is the value, the timing, the minutes.
So this is basically telling max, that I want to get the maximum value based on the value which in this case is minutes.
There you go.
Boom.
That returns a tuple of key value.
Look at that.
Compare one, two, three, four, five, six, seven, eight lines of code with one line of code accomplishing exactly the same thing.
You can use min in the same way.
It should get me the core workout of 30 minutes.
I mean it takes the same inner logic, but as it is min it takes the min value.
Look at that.
Less code.
Leveraging the built in functions from the standard library.
|
|
|
show
|
3:34 |
Next up, refactoring 5.
Tuple unpacking and intervals.
So, what if you need to do a swap of variables?
We got a and b are 1 and 2.
In other language you have to keep a temporary variable so you store a into tmp then you can override, a with b.
Then you can put the temporary variable back into b and now they're swapped.
Right, so a now became 2 and b became 1.
Well in Python, it just takes one line of code.
Let's restore them.
Let's just do just swap them like this.
And there you go.
No temporary variable needed.
So that's step one, unpacking in action.
Another example of that is the earlier max function returning two values.
Here we had legs 55 minutes, so you can assign them or tuple unpack them by assigning them to two variables.
So in this case, routine and minutes.
There you go.
A function that returns two values can just be unpacked by specifying an equal number of variables before the equal sign.
In this case, routine and minutes.
N tuples, I will just do a quick demo because I already discussed them in more detail in a previous lesson.
That's not really saying that much because if I have to refer to them I would have to access them on day, what is that?
The second?
Okay, so it's zero base so I do 1.
I train, what do I train?
Workout.
Where's my training?
Okay, it's the first element at 0.
Okay, at least I got that right.
Okay, so if you do it that with n tuple.
Let's create one with workout equals workout with uppercase, which is the n tuple.
I always uppercase, unless because I see them kind of as classes without behaviors and classes you uppercase in Python.
You can either give them an args list.
You can also do that more verbose with a keyword argument list.
Now the print statement becomes a lot cleaner because I don't have to think about indexes.
I can just do workout.day, workout.routine, workout.duration, and it's much easier to type.
It's much clearer to the reader of your code what you're actually referring to and hence you'll probably make less mistakes.
N tuples, they're very easy to define and use.
It makes your code much more readable.
I would encourage you to use them whenever you can.
|
|
|
show
|
2:54 |
Alright.
List comprehension generators.
I did a whole class on this topic.
So, I just want to quickly recap what we learned here.
Because it should really be mentioned in refactoring.
Because it's one of those candidates to make your code more readable, and Pythonic.
Let's get the days starting with a T and let's do the old style keeping a list.
There you go, Tuesday and Thursday.
And again, this is fine, right?
However, you can write this in a more concise way.
Let's use a list comprehension.
So look at that, one, two, three, four, five lines of code reduced to one.
Awesome.
Next, let's do a quick generator example.
So, just to recap, let's make a random day generator.
So, we need some random function, and we're going to use choice.
So while True initiates an infinite look, I'm just going to yield the count, and a random choice of days.
Let's initiate that generator.
I call it daysgen.
And you can see that that's the generator object.
And a generator I can call next on.
And it gives me a random day.
Lets call it again, and I get Monday again, Tuesday, Saturday.
So it's random.
Okay?
I can use it in a loop.
So let's get five more days.
There you go.
Remember that the index was at four, so now it's five, six, seven, eight, nine random days.
And then the last nice thing to know about generators is you can use itertools islice.
And that lets you get a slice of the generator.
Because if I now put this generator in a list, my system would hang because this never ends.
It keeps on adding values, consuming memory, and there's no way to stop.
There's not a StopIteration, or a stop clause in here.
islice is nice.
It can just get a slice of the generator.
Just like you do a normal slice on your list, like first 20 items.
This is similar but works for a generator.
So, let's take an islice of daysgen, and I want to start it at position 100 and stop it at 105.
And then it's safe to put this in a list, because this is a finite sequence.
And there you go.
And that wraps up list comprehensions and generators.
|
|
|
show
|
3:11 |
Right, next stop: string formatting and concatenation.
And pretty important because you will be doing this a lot in your code.
It's funny the other day I bought some clay with my daughter and we were making Python figures and obviously we were very bad at it and then we got better.
And I found it a nice analogy with string formatting.
As the Zen says there's preferably one best way to do it and there are various ways to do string formatting but in the end there is a best way which is now the f-string in 3.6 but if you're not on 3.6 then at least you can use format that's basically the gist for me of doing formatting the right way.
But let's also demo that with some code And I hope you agree that those last two figures were definitely better than the first.
Alright, total hours is six print.
the course takes plus total hours to complete.
Okay a type error, not good so I cannot add an 'int' to a 'string' and vice versa.
So I need to make this a string and then it works.
But yeah, it's not the best way to do it.
And the best way is using f-strings in Python 3.6 and look at that I can just embed the variable.
This can even take operations, its pretty awesome but yeah, this is faster and it's much easier to read and I don't have to concatenate or even doing any type conversion.
So go with f-strings, but maybe you're not on 3.6 for some reason and then you can use format.
So you would write this as in the same curly braces and then you use format on that string and give it a variable.
And you don't have to worry about type conversion because format is, sorry, not using f-strings anymore format is smart enough to convert this 'int' into a 'string' or whatever is needed to make this work.
And then last note about concatenation so as said before, building up a string like this is not the way, and its slower if you're working with a lot of data and how true is that, right?
Every day you get to write Python is a happy day but, it's not happy for your performance and readability I would say, it's not really looking nice in this case you really want to use join so you want to really have your strings in a sequence or a list, and then just join them together and you can specify what to join on and there you go, here's my same string as above but using the Pythonic way of joining and, you know, you can do what you want you can also join it on dash, even better I can leave off the spaces here and give join a space.
So I'm going from multiple spaces or worry about spacing in the first place by doing that in one place at the join level so much better.
|
|
|
show
|
0:47 |
Number 8.
PEP 8 and the Zen of Python.
Any Python developer should become familiar with PEP 8 and use it in their code.
So here's the Style Guide for Python and you really should read this end-to-end and make a habit of formatting your code in the proper way, using variable names with underscore, so all these conventions.
There's even a recent initiative, pep8.org, which should make this even easier to digest.
And it's really nicely formatted and gives you some more context.
And, of course, if you do import this from your Python REPL, you get the Zen of Python.
And the more you write Python, the more you see how this applies to the language and it's design.
It's really where you start to better understand and appreciate the language.
|
|
|
show
|
2:54 |
One thing that the Zen is saying is explicit is better than implicit and I want to show you that concept with a couple of examples here.
For example, if you do a from module import *, it imports everything in your namespace if this would import full or bar and you define such a variable or function that will override it and that leads to very obscure box.
So don't do import *.
Make it explicit what you're importing.
So from module import full, bar.
Another coding horror is something like try and except pass.
Now this is like the black hole or monster that absorbs all possible errors, muting them away and you won't see anything in return.
So whatever happens, even if I were to interrupt the program with a control C which would raise the keyboard interrupt exception, that will be silenced as well so I cannot even kill my program basically.
So don't do this.
No bare exceptions, make it explicit.
So a little bit better will be for example, at least I get some information, or let's divide it by 0, I'm still shouting and I get another error.
And you see these operations lead to different exceptions so the best way to do it is to explicitly name the exceptions.
Again, try to divide number one by number two and let's go through the different exceptions we might get.
Here for example, if I get a ZeroDivision error, I just return 0.
That's my handling of the exception.
If I get a type error, and here I just print a message but I don't really have a way to allow this and so I just reraise the exception.
And if something else goes wrong you still can instead of doing accept pass or accept print something you can at least say accept exception as variable and browse that variable.
And you can send this to a log file for example.
To have at least a little bit more information when you're debugging the problem.
So now it's from the cell and call it with a string.
And here you see that it entered the type error and I get the message related to type error and it reraised the exception and if I divide by 0, here we don't have to crash anymore because I explicitly handled ZeroDivision error.
Printed the message and return 0.
Great, and that concludes number 9.
Explicit is better than implicit.
|
|
|
show
|
2:34 |
Alright number 10, bonus, the last refactoring item.
I'm just going to talk over some general coding best practices because of course Pythonic code is important and pleasant to read but it's often also a matter of sticking to the best of role coding practices.
For example, make sure your units of code are short.
Typically, a function or method should be around like 10, 15 lines max.
It can be very Pythonic but if you start to write functions of hundreds of lines of code, it's not good.
It's not easy to maintain.
So this is your 10 guidelines to make your code more maintainable.
Some other ones I want to highlight here, write code once duplication is a monster.
You really want to prevent having the same code defined in multiple places.
Keep unit interfaces small, so that means when you have functions the number of arguments to get if you keep that to a reasonable level, it's easier to maintain.
For example, if you have a function that takes 10 arguments, not easy to maintain.
You could consider passing around a class or refactoring to a class modules.
Again, that's the part of name spaces of the Zen.
It's good to have similar behaviors or similar objects grouped together in files.
To not have one file holding 10 classes, split those out in files, right?
Which makes it easier to reuse them in other programs.
Testing of course, you want to automate your testing that when you make changes you have this regression suite that you can just run in seconds and highlight if you introduced a new failure.
Which, if your system becomes more complex, might happen.
This is an automatic way to catch that and keep the quality of your software high.
In day 10 you learned about pytest and how to write tests so that's really important here.
There's also a lot of habit around this so if you get into the habit of writing clean code, keeping to high standards, it means that when you go into your code base, you leave the campground cleaner than you found it, right?
I love the anology in the pragmatic programmer book about having a small crack in a window if I remember correctly?
Leaving that unattended leads to broken windows and the same is true for your code base.
If you let small bad habits creep in it might actually lead to a lot of damage in the long term.
It's really about having good habits around writing clean code, run the PEP 8 checker on your codes, see if it's formatted properly, the right conventions are used, etc.
|
|
|
show
|
2:11 |
In this video I'll provide you some extra resources to read up about refactoring and how to make your code more Pythonic.
Read about the topic of refactoring, we have a whole dedicated post on the importance of refactoring code.
Errors should not pass silently, as we've seen.
So a lot of this we've discussed in this notebook, but it shows you some more examples.
This is an important one, there's some Python mistakes the beginner is likely to make.
And we listed them here so you can know about them in advance.
There's string formatting we discussed and Julian had a very nice article here.
From going from the terribly un-Pythonic method to the nicer way.
And I think he come to the same conculsion that you really want to use f-strings if you can, if you're on 3.6.
There's an awesome talk about beautiful idiomatic Python, by Raymond Hettinger.
I learned a lot from this talk, there's a lot of good tips and tricks in it.
And we've made a summary in this blog post.
And when we talk about modules, and splitting your code, it becomes important to know about packaging your code.
So here we have a post about how to do that on a practical project, like her Karma Bot.
And it's not that hard, I mean basically you have to make an init.py file and know how to import your stuff.
That's important.
The imports mights be confusing, but with this article it should become clearer.
So when we're talking about splitting code and making it maintainable, know how to work with modules and packaging is important.
And generic code quality resources, I have two.
First of all Martin Fowler's Refactoring Book, and yes, the examples are in Java, not Python.
But it's about the general principles.
And this book really teaches you how to write better code.
It shows you very practical examples how you can refactor bad code into much more maintainable code.
It's a great read.
And of course, Uncle Bob's Clean Code, a classic.
And also shows you a lot of ways to write professional quality code.
|
|
|
show
|
5:11 |
Lets go over what we've learned so far, 10 refactorings.
One.
Having a big if elif else block is not really maintainable and looks pretty ugly.
Rather, use a dict and just look up the items.
Much better.
Next, keeping an index when looping over a sequence.
In Python, you can just use enumerate.
And look at that, you can even give it a start value of one and you get the same result but it looks way more concise.
Next, context managers.
Don't use files like this.
If an exception gets raised, the file handle won't be closed.
This is a bit better because the finally block will make sure that your file handle will get closed.
Yet, much better, is to use a with statement which automatically closes the file handle after it's done.
Four, use builtins and learn about the standard library.
For example, here we saw a pretty verbose example how to get the maximum duration of a couple of workouts.
Not the best way.
You can just use max and min which are built into Python.
Here are two examples how you can do it in one line of code.
Tuple unpacking and named tuples.
You need to swap variables and using a temp variable?
Or what about indexing a tuple?
By indices?
Not optimal.
Use tuple unpacking.
For example, you can just swap the variables around.
No need for a temporary variable.
Or, to access to access elements in a tuple, make an attribute thanks to a named tuple.
Now you can just print, work out that day, work out that routine, and work out that duration.
And it's way more readable.
List comprehensions and generators.
Once you need to build up a sequence, you don't really need to build up that list.
You can use a list comprehension.
That's way shorter.
Or use a generator which when your dataset grows, will be more efficient.
Here's another generator to get a random day.
String formatting and concatenation.
Don't concatenate strings like this.
It's ugly and less performant.
Rather, use f-strings if you're on three dot six or later.
Otherwise, use format as a more elegant way to format your strings.
Another thing we saw was string concatenation when you build up your long string, don't do this.
It's not efficient.
Python will make a new string object with every operation.
You rather want to put all the string objects in a list and just join them together.
And here you see an example of that.
PEP 8 and the Zen of Python, your new best friends.
You will refer back to them, a lot.
First of all, to understand Python a bit better, why things are designed the way they are, read through Zen of Python and, I guess, print it out and put it next to your screen because it's a very concise list and it really explains a lot about Python.
And equally important, look at the PEP 8 style guide and try to abide those principles because they make for more readable code and more consistency across code bases.
There's an awesome resource under PEP 8.org that makes it easier to understand.
And I forgot to mention in the lesson, you probably have a shortcut under PyCharm or Vim that you can just run PEP 8 checks or Flake 8 upon save and catch those errors early on.
Definitely something where you want to go from average to awesome.
Explicit is better than implicit.
That's literally quoted from the Zen.
Don't do try-except paths, like never do that.
Don't mute all the exceptions, being kind of a black hole, beam into an obscure box, it's just bad.
Rather, be explicit in catching your exceptions.
So in this case, dividing num one by num two.
You can have a ZeroDivision error or a type error or any other exception and all have their specific message and handling.
Code quality overall.
Which the Software Improvement Group has nicely wrapped into ten principles.
In short, keep your methods small, don't pass along too many function arguments, keep your code organized in modules or files, and automate your testing.
Of course, there's more to it.
It's a whole study in itself.
So you can read their building maintainable software book but I also recommend Clean Code by Uncle Bob and Refactoring by Martin Fowler.
That's really where you want to go from coding horror to writing awesome code.
Your code can be very Pythonic, but if you're writing methods of like 50 lines or more, you still want to go back to general code quality principles.
Alright, now it's your turn.
Keep calm and code in Python.
|
|
|
show
|
1:31 |
Welcome back.
In this second and third day, I encourage you to take our Code Challenge 30.
It's The Art of Refactoring: Improve Your Code.
And, the task of today and tomorrow is to get some of your code, run tests and do some refactorings, making it more Pythonic.
Also, I would recommend to start looking at Flake8, or Pylint.
I personally use Flake8.
And integrate that into your editor.
And have a check upon each save.
Or, what I did, for example, in the vimrc, I have a shortcut:, f.
And when I press that, it runs Flake8 and it opens a new editor window where it highlights my PEP 8 violations.
So that way I keep my files clean during development.
Optionally, you can look at Code Challenge 35 and use Better Code Hub to look at your code quality overall.
Using how we use the tool to improve a couple of our projects.
And don't forget to tweet out your progress.
You can mention Talk Python and PyBites in your tweets, and we would love to see what refactorings you come up with, or what your favorite Pythonic concept is you learned from this lesson.
Alright, good luck and have fun.
|
|
|
|
32:08 |
|
|
show
|
0:35 |
Hello, it's Michael Kennedy, and I'm going to be your guide for day 37, 38, and 39.
And this time we're going to work with structured data called CSV files.
So anything that can be stored in something like Excel or Tabular, data like that that you might work with in some kind of Excel spreadsheet.
Much of the data you'll find out on the internet lives in this form, and we're going to find some really, really interesting data sets, and we're going to build some programs to ask and answer some pretty powerful questions.
Let's get started.
|
|
|
show
|
2:18 |
Let's talk about our data sets real quickly.
You're probably familiar with CSV data, but just in case you're not, it looks like this.
It's a plain text file and there's a set of headers across the top that tell you what each column is.
So here we can see we've got data, an actual mean temperature, an actual minimum temperature, and an actual maximum temperature.
And then we have a bunch of columns that correspond to that data.
Now I told you we're going to work with some interesting data sets and it's true, I found a good collection here for us to play with.
Now you may be familiar with a place called FiveThirtyEight.
It's like a data-driven journalistic news site where they gather up a bunch of data and they use it to write articles and do investigative journalism type things.
And it turns out every article they have, the data that they use to derive those conclusions is available online on GitHub, so that's pretty awesome.
So over at github.com/fivethirtyeight/data, that is where we're going to be working for the next three days.
All right, so let's jump over to my web browser here and we'll just have a quick look through all the data.
I told you there's a lot, look at the size of that scroll bar.
There's a ton of options here.
So let's skip down past all the folders and just go to this section.
So here you can see all of the articles written by FiveThirtyEight and then the corresponding data that goes with it.
So let's just grab one here, American Chess is Great Again, and if we come back, click on it and you can see here's the actual article that they wrote about, and you can see here's the graphs that they drew based on the data and so on.
But here is the actual data, so you can come over here and it actually describes what it is and so on.
If you click on it, you can see here's all the data that they were using to make these conclusions.
So what we're going to do in this section of the course is we're going to take one set of CSV files and use that for our demos and ask and answer interesting questions.
And then for the next three days afterwards, you'll be turned loose to build your own investigative journalism app.
You'll choose one of these CSV files and come up with a set of questions, and it's going to be a ton of fun so I hope you're ready to get started on that.
|
|
|
show
|
1:03 |
For the learning section of today, what we're going to do is we're going to write an app that takes a CSV file, and answers a set of questions around it.
The data that we're going to use is from the 538 data set, data/us-weather-history.
It's not very clear what this means, but this is the weather history from different cities.
You can even actually see here's the the data that they, the code that they used to visualize it.
Here's the web scraping, they go to Wunderground which is the weather site to get the data, pretty awesome.
So we're going to use this data set, this is the Seattle weather data for 2014 and 2015, I believe.
Yeah, there's the dates right there.
This should look familiar, right?
Date, actual mean, actual man, actual temp and so on.
So we're going to take this data and we're going to work with it.
Now, let's make sure we start with the raw, we do not want GitHub HTML, you want the raw.
So we're going to save this.
And I'll just save this as seattle.csv.
Now let's go write some code to work with this data file.
|
|
|
show
|
3:38 |
Alright let's create our little application for our demo that will let us work with the CSV data.
I'm over here in the actual GitHub repository and we're going to create our application here.
Now I want to create a virtual environment in here before we get started and maybe I'll even name it venv So, I'm going to go to that same folder in my terminal here and I'm going to run the command to create the virtual environment before I open this in PyCharm.
Alright.
If you were going to continue working in the terminal here and you wanted to say, run Python commands you would do this on Mac and that would activate it, and if you were on Windows you would just say venv\scripts\activate.bat like that.
Either way, I guess you would use backslashes wouldn't you?
But, until you get started here I'm not going to worry about this because I'm going to work in PyCharm and so if I throw this over here or on Windows or Linux say file, open directory it'll open this up and I'll go ahead and let it add the GitHub root doesn't matter so much for you guys but I'm going to of course check all the stuff in.
Now, we can just go to our virtual environment and say let's just ignore this, it doesn't really matter and we're just going to get started like we have been by creating a program.py this is going to be our little way to explore, and this is going to be the top level thing that we want to work with.
So, I'm just going to print out kind of the basic structure of what we're going to do in terms of working with this data and then we'll actually go write the code to implement that.
So, I'm going to define a main method here and just for a minute I'm going to do the pass.
We'll do this little structure that is very common in Python that says only directly execute this code if it's being invoked directly, if it's being used as a library.
Don't run main just leave the other functions here.
So this is the common pattern and we're going to print out a few things.
We'll print out a little header value.
Alright, so weather research for Seattle 2014 to 2015 and we'll just put a blank line like that.
And then we're going to need to initialize the data.
Spelling is hard that's why PyCharm can fix it for us.
Okay, so that's going to be great and once we get down here, we want to answer the questions.
What, say, the hottest five days?
And then we'll say to do show the days.
And we're going to do this for a couple of different ways.
I'm going to come in here and I want to answer the coldest five days and the wettest five days.
So, this is our goal is to run basically answer these questions and we're going to do that by reading that CSV file.
Before we do, let's just really quickly run and make sure this works.
Hey, it tells us basically here are the days, but doesn't yet show them to us.
So we're going to need to get the data.
Let me actually make a little folder to organize that here.
I'll call this data.
And into that data file, I'm going to drop this thing we downloaded in the previous video.
Drop that there.
PyCharm will put it over in the right place and we can look.
Does it look correct?
Yes.
Apparently PyCharm can help out with CSV files.
I don't really care.
But I do care about what the header values are going to be.
We're going to work with that later.
So maybe go ahead and copy that preemptively.
Now, I think we're pretty much ready to write the code that is going to read that file and then provide the data so we can answer these questions here.
|
|
|
show
|
4:19 |
Our goal is to read that CSV file.
We technically could do that right here, but I would like one part of my application to just be dedicated to reading, and parsing, and working with the data.
And another to do with this, kind of, UI business.
So let's make another Python file called research, and we'll put that at the top of level of our program here.
Now we're going to want to work with the CSV file.
So let's come over here and define a function called init.
And this is going to basically load up the data, the data file and then get it into memory and we can answer questions about it later.
We're going to have this global shared piece of data like this, and we're just going to make that a list.
So we're going to initialize this, and now what we need to do is we need to determine this file.
It would be very tempting to say file name is just ./data/seattle.csv, or back slashes if you're on windows.
Now, be careful, backslashes and strings don't mean quite what you think they mean.
This, if you said something like \t, notice how it changed colors, or \n.
Backslash and strings is used as a, what's called an escape character, and it means \n actually stands for a return, and \t for a tab and so on.
You can use double backslashes to say, no no, I just mean the backslash.
All right, so be a little careful there.
But, even so, that withstanding, this, and the spelling as well, this is not going to be working out really well.
It'll work if we'd run it actually, but only if the working directory is this folder.
If you run it from the command prompt, or terminal, and you're somewhere else, this isn't going to work.
So we're going to take a slightly more complicated step to determine this location.
So we're going to come up here and import the os module, which let's us ask cool questions.
And we'll say folder, let's call it basefolder, = os.path.dirname of where.
Well, one of the things we have to work with that's in variant is where this file is located.
And what we want to do is go to where this file is located, go into the data folder, and go here.
And there's a way to always get to that in any Python file just say dunder file like this.
So, this is a file, dir name, we'll drop the file part, and just keep the directory, and then we need to say filename, here is actually going to be os.path.join, and we want to put together the basefolder and data, no slashes, and seattle.csv, okay?
So this will do that in a platform independent, location independent way.
And it's really, you know, not that much work above what we were maybe going to type in the first place.
So let's just open this, we'll use a with block, we'll say open file name, and we can give it a read, and one can even say encoding=UTF-8, that's the safest guess, and we'll say as fin, that'll name our variable.
Let's just do a quick print, forget CSV for a minute, we just want to see what's in here.
So we can say, read lines, or just read, look at all the text.
So now, let's call this function, it's not done, it's not even close, it doesn't do anything with the data, it just pulls it in as text, but it's going to verify this one aspect of what we've done, reading the file.
So let's go over here, and let's, before we do any of this, let's go do our initialization.
So we want to go to the very top, say import research, all right, and then down here we can say research.
forget data, we're not going to work with that directly, but we'll say init.
Now, let's run this and see what we get.
Boom, we saw a whole bunch of CSV data scream by, just like that.
How cool is this?
So this is totally working well.
We've got our research, it can find the file, and I can tell you it will find it from anywhere on the computer.
It doesn't matter, it's going to just use the location relative from here to there, based on this thing that we did.
All right, so that's how we load the file up and get a file stream, that's one half of the problem.
The other half is to take that giant string and convert it into data we can work with.
That's the next step.
|
|
|
show
|
2:28 |
We were able to read our file as text, and that gets us really close, but it doesn't really let us work with it.
And now, technically, we could do, like a crazy bunch of string operations and parse this.
But, it turns out it is entirely unnecessary.
So we can import the csv module.
This is a built in in Python.
I'll call this reader, and I'll say csv.DictReader.
There's a couple of kind if readers.
DictReader is the best one.
And you pass it this file stream.
And what this thing is, is it is something that you can loop over, and every time you loop over it, you get the values out, okay.
So, let's do just something really, really quick, and, just for row in reader, and just so you can see it working I'll print out, let's say.
So if we run this, looks like it's working, and what we get is something called an Ordered Dictionary.
Doesn't matter that it's ordered, all that matters to us I can ask it for the date, or the actual mean temperatures.
Like, if just want to print out this part, I can go, because this is a dictionary, let's comment that out, I can just print here, row.get the actual mean temperature.
Great, it looks like we already got a lot of data, and we could work with it.
There's one super, super challenging problem, though.
If I really want to work with this data, you very likely want to ask, is this thing less than that other thing, right.
Is this temperature less than that?
So we can answer our questions.
What's the hottest day, what's the coldest day?
Things like this.
So, let's print out the type, right.
This is going to tell us the actual underlying data type here.
Strings, everything that comes back from CSV files are strings.
Even if they look like dates, or they look like, you know, numbers or something.
And so in order to actually work with these, we're going to have to do something a little bit different.
So, we're going to actually write a function that takes this sort of raw row that we have here, and instead of just saying we're going to store the text, we're actually going to convert the numbers to numbers, the dates to dates, things like that.
So we can actually answer questions like, is this number less than that number?
Alright, the string less than or greater than is not the same thing as numerical less than or greater than, right?
Like, 100 is less than 7, for example, if those were strings, but obviously not as number.
|
|
|
show
|
6:59 |
Now, we've actually parsed the CSV file and we're ready to go.
But we saw that everything that comes back is actually just a bunch of strings.
And we can't really do data analysis.
When you want to do numerical operations or date time operations.
But the data type is a string.
So what we have to do is that we need to write a function that will take one of these rows.
And kind of upgrade it to its types that we know exists in there.
So let's go down here, we're going to write a function called parse_row And we'll give it a row and it's going to return some kind of item.
So, first of all, let's write one that just actually upgrades the values.
And we'll do one more step beyond that.
So, we know, if we look over here.
That we have a date, we have an actual mean and all of these things.
So, let's start by coming over here and we're going to upgrade the rows date.
Let's upgrade the temperature, it's a little simpler, first.
So we'll come over here and we'll say actual mean temp, that's from the header.
Now, see, this value is actually the result of converting it to an integer.
And we also have the actual min temp.
Now, you want to be careful here, of course that you don't cross those over but also, that you're using integers with the integers and the floats where there are floats and so on.
Now, this is not fun to watch me type this out for each one, and there's a lot of it, it's quite tedious so let me write this out.
And then we'll come back to it.
Alright, here we are.
So now we've taken everything that we found in the header and we've done a conversion from strings to numbers.
Sometimes those are integers, sometimes those are floats we paid careful attention to when that was the case.
If you're unsure just use floats and then we're going to return this row but by getting the value out and then replacing the value with the integers we should be able to come over here and print this.
So if I do this and, kind of what we did before we do a little type of that.
We print those.
Now, if I write on it, Actually...
Excuse me if I do this parse_row.
And we kind of upgrade this row here And notice these are now integers if I change the column to the actual precipitation you'll see these are floats.
Here they are.
Those look like floats, don't they?
Great, so we've upgraded this and, it's already in a really good shape.
There's one other thing I want to do to make it nicer.
And that is to use a data type that's built into Python that helps you work directly with sort of these values in a really simple way, and it's called a namedtuple.
So let's go to the top here and we'll say import, collections and inside Collections there's this thing called the namedtuple.
So we can actually define another type something better than this basic dictionary which is cumbersome to work with.
You got to do the .get, the value might not be there, things like that, so let's define a record, like a weather record, and we're going to do that by saying, collections.namedtuple.
Now, you give it two pieces of information.
One, you...
You basically replicate this, so you tell it, I'm calling you this, but, your name is what I'm calling you it's sort of so it knows what its name is.
And then the next thing you give it is simply this giant thing up here, okay, like so.
Now, PyCharm says, whoa whoa whoa, what're you doing, that's like line, or column 200, this is insane.
So why don't you do some line wrappings, just so people can read what's going on, right.
And this Python will turn that back into one long string because there's no comma separating it.
These might look like they're separating it, but they're on the inside, not the outside.
Okay, so this is going to let us define a type, so come down here, and I could actually upgrade this, so I could say, r equals record, and if you look and see what it takes, it takes a date, a temperature, all the temperatures and so on.
And I could say date equals this, mean temperature equals this, min temperature equals that.
So I could say date equals row.getdate comma.
Did I say data?
Oh, no, date, yeah, date.
So date equals that and actual mean temperature equals row.get, this is starting to feel tedious isn't it?
And we got to do this for every one of those.
It turns out these rows are dictionaries, there's a shorthand to say this statement, for every element in the dictionary.
So if I want to say, if date is in there, go get the value assigned as date.
If mean, actual mean temp is in there, go get that value and assign it to this, and the way you do that is you say **row.
Star star row just says, well, do what I erased, right.
Set this value to the value from the dictionary, set this argument value to the value of the dictionary, and because what's in the dictionary is literally what we put right here, this is going to match exactly and this will work.
Alright, so now let's return this little record thing instead and we can rename it better to record.
There we go.
And so we'll call it record here.
Now we go over here record and say ., and notice it gives us a nice, beautiful list of all the stuff that's in there, we don't have to do this style over here, I'll just say, I don't have to know it's a string and is the actual precipitation, I just say record.actual_precipitation.
Then into print out the value, then we'll do it again.
So now it should work just the same, boom, it does.
Okay, whew, so we've now converted our data, the last thing to do is to store it.
So instead of printing out, which is kind of fun, but generally not helpful, we're going to go to our data and say, data, append record.
Alright and just in case somebody goes and calls this a second time, right, we don't want to over do this, whoops not record, we'll say data.clear.
So we'll reset the data and then we'll load the new data from this file just in case you run it twice, probably not going to happen.
Alright, so now we're basically ready, let's just check and see that this worked.
Let's go over here and just print research.data, just to see that we got something that looks meaningful.
And look at that, we did.
Record, the dataset, the mean is, we actually didn't parse the date, but just keeping it simple.
Actual mean temperature and so on, you can see this goes on to the right for very long.
But it did exactly what we wanted.
So it looks like we're off to the races.
Now the final bit, actually this is the easy part, let's answer the questions now that data is super structured to work with.
|
|
|
show
|
6:35 |
Alright we're ready to answer the questions, let's go through this again.
I'm going to move this down just so it fits right here, so we initialize the data.
Boom, we're doing that.
The next thing we need to do is say research dot let's say hot days.
Now what we're going to do is we're going to write a function here that is going to give us all the days, hottest to coldest.
And we come over here and say days equals this, then we could loop over and say for d in days, and that would show all of them.
But we want just the top five, and so the way you do that in Python is using something called slicing.
So you can come over here, and say I would like to go from index 0 to index 5.
Alright so this gives us a little subset of our thing, and when it starts at zero or ends at the length you can just omit it.
So we can write it like this, and that will process the first five of em'.
And then let's just say, print d for a second.
So we're going print out what that looks like.
So let's go write this hot days function.
Alright so we want to go through our data, and figure out the hot days.
And it turns out, the easiest way to do this is just to sort it.
So we can say return sorted data.
Now that's going to sort it by, jeez I don't know, maybe the first element, alphabetical, by date, I'm not really sure.
So we want to control what it's sorted by, and in here we can say there's a function that is going to take basically one of these items, one of these rows, and tell us what we're going to use to sort for it.
So we're going to say key equals lambda this is a little in line function.
Lambda says there's a function, then the next thing we put is the argument.
So let's say r for record, we do a colon and then we have the body of the function, the implementation.
Where do we want to sort by for hot days?
Let's say with a max temperature for the hot days.
Actual max temp is what we want.
So we're going over here and I'll say r.actual_max_temp.
Now this is close, this is going to actually give us the lowest value first, and then the highest value to the end.
So the default sort is going to go from low to high, how do you reverse it?
There's two ways, we could say reversed=True, I'll spell it correctly, that's one way, or another way a little more flexible, is to just put a negation here and say multiply that by a negative number.
So take your pick, you can do it either way.
While we're here let's write the cold days function, that should be easy.
On the cold days take away that.
And let's do wet days.
And this time we're not going to sort by that, we're going to sort by actual precipitation.
And again wet days are where we have more, so we want to sort that in reverse.
Now the format is a little off so reformat the code.
So PEP 8 is happy.
Alright so those three functions actually should do what we need.
So let's go over here and we'll just print out the five hottest days.
Now this is probably not how we want to view it, so let's print this out slightly differently.
So I would actually like the index, like this is the number 1 hot day, this is number 3 hot day, so I can come over and say idx, and instead of just looping over the days, I can innumerate them and then loop over.
And that will give us the index and the day, for each time.
So then in here we'll put something like a little dot to say what day it is and we'll say the temperature in terms of Fahrenheit on such and such day.
And we'll just do a little string format on this.
So what this is idx and it's zero base, you don't talk in terms of 0 1 2, you talk in 1 2 3 so plus 1.
And then we need the day, dot.
Now notice we're not getting any help here, let's go back to these real quick.
So we can come over here and tell Python this is a record.
Now if we do that, sorry not a record, you can tell it it's a list of record.
Now this is a Python 3.5 feature, and if we come over here we import this typing.List.
So at the very top, we have from typing import List, and we put this here, and I'll go ahead and while we're here just put it on the others because they're all the same type.
We come over here and now we go back to this, and I say let's try that again, d.
Oh yeah, now our editor is smart, now it can help us.
What we want here, we want the actual max temperature, and then we want d.date.
Alright, let's go and run it, see if this whole thing's hanging together.
Boom, look at that, hottest five days, 96-94-92-91-90.
And those are your dates, that's awesome, right?
See how easy it is to answer the question.
The challenge was not actually answering that question, the challenge was taking the data, reading it in, and then converting it to a workable format and storing it in our record.
Once it's stored like that it is easy.
Let's go ahead and do the same thing for the coldest days.
So we'll say that days is not the hot ones but now it's research.cold_days, should do exactly the thing.
And let's do a little print in between just so there's some spacing, and you guessed it, the wet days, same thing, just ask for the wet days.
Let's run it, so there's our hot days, the cold days look really cold, well doesn't look that cold does it?
Did I get the cold?
That might be the high on the cold days.
Let's go down here yeah.
Yeah, yeah, careful.
This going to be actual min temp, like so, and this is going to be actual precipitation.
There we go.
Let's say, inches of rain, there we go.
Oh yeah, now that's starting to look cold isn't it.
23 Fahrenheit, that's like negative negative 5 Celsius for those of you who are on the Celsius scale, this is like 36-37.
Alright so pretty hot, pretty cold.
I notice the sorting is correct.
The weather stays, the heaviest amount of rain during that time was 2.2 inches, or 5 centimeters.
And then it goes down pretty quickly from there.
So hopefully you really got a good sense of how to take the CSV file in, read it, parse it, convert it to a usable format and then just quickly answer questions.
We stored it in a list and sorted the list, there might be other data structures you need to use for your data.
|
|
|
show
|
1:44 |
Recall there were two basic steps that we had to go through to work with this CSV data, and they were both pretty simple.
We're going to start by importing the csv module, so that will let us actually create this dictionary reader to run through it, and we're going to open a file stream that we hand to the dictionary reader to actually get the data.
Then we just create one of these dictionary readers based on the file, and gives us this thing that we can loop over and each item that comes out of the loop is going to be one of those rows in there.
And we get this row back and we work with it one at a time.
Now you saw the data's always text, so you may need to upgrade it to something more usable if you're working with numbers and dates and things that are not just plain text.
The other thing that makes this really, really nice, makes a big difference in terms of working with this data, is to give it a little more structure, and we saw that we could really easily use something called a namedtuple.
This comes out of the collections and then we're going to create the namedtuple here and we call it whatever you want, we make up the name.
I said I'm going to call it record, so record it is.
Just remember it appears in two places, and in that second part, we actually put the basically the header from the CSV, it just so happens that format works perfectly there.
And then we can, if we have some data, we can create one of the by setting the keyword values.
So we set all the values there.
We actually have a shorter way to do it if the dictionary exactly matches the items, which it does in this case.
So we could use the **row, because often there's a ton of keyword values to set, and this will just do it in a super, nice shortcut here.
|
|
|
show
|
1:43 |
Now that you know all about working with CSVs, it's time to do some data journalism.
You're going to come up with an amazing question, and find a data set, and answer some questions about it.
So, let's get you the steps here.
First day is, you're basically done with the first day.
It's more or less to watch the videos, but the final thing to do, I hope you're inspired, is to head over to the GitHub repo, fivethirtyeight/data.
And sort of look through there and find one of the data sets that looks interesting to you, and think about answering some questions.
So, here's what an example of that may look like.
Alright, so you might want to write these three things down.
So, here's the goal, is, I found, maybe I should put data set first in terms of the order, but I found this data set on where you live in the United States you eat different things on the U.S.
holiday Thanksgiving.
So, if you live in the American South, you'd have one type of thing, if you live in the North, in like the Northwest, you eat something different.
It also varies by income, so pretty interesting.
So, you go over here and the goal is going to be to predict, you know, ask two questions of the user, and then predict what they have for Thanksgiving.
So, you ask them where do they live and how much money does their family make, and you're going to use this data set to basically, generate a set of things they're going to eat, right.
You're going to eat turkey, and stuffing, and mashed potatoes, and things like that.
And they answer the questions differently, that menu that you provide to them might be different.
So, here's sort of the steps that you need to do for those few things, alright.
I think that's going to be fun.
You don't write the program on day one.
You've already watched all those videos and listened to me talk, so you're goal is to just find the data set and have a question.
|
|
|
show
|
0:16 |
Day 2 or Day 38, if you're adding them, is to actually create the skeleton of that program and just open a CSV reader to that file.
If you can just load it up and just print out the rows, you're done with day 2.
|
|
|
show
|
0:30 |
And on Day 3 you're going to want to actually work with the data.
So you need to transform it into a way that you can work with.
If you need to work with that particular field, I think my Thanksgiving example might not actually need it because of the way that that works.
Depending on your data you might have to, you know, sort of upgrade it to the numbers or numbers and then, you know, ask the user questions and try to basically provide an answer based on the data.
When you're done, share what you learned as always, and thanks, hopefully you enjoyed this section.
|
|
|
|
25:36 |
|
|
show
|
1:11 |
Hi everyone and welcome to JSON in Python.
This is Julian Sequeira and I'm going to be walking you through some of the more interesting ways of dealing with detailed JSON output.
So JSON, if you're not familiar with it, stands for JavaScript Object Notation and it's pretty much just a way of formatting data, okay.
One of the most common ways of seeing JSON when you're working with Python is through contacting APIs.
Through working with numerous APIs out through the web.
And one of the things about that is that you actually get really complex dictionary nested situations going on.
So the JSON output, if you haven't seen it before, just looks like a little dictionaries and lists and if you get really deeply nested lists and dictionaries, it gets really complicated to try and pull out that data, which is why JSON can sort of screw with you, pretty much.
So, what we're going to do is we're going to go through that in the next couple of days, have some fun with it and see what other cool APIs you can talk to by the end of it.
So, let's move on.
|
|
|
show
|
1:59 |
And here's how your next 3 days are going to look.
So, for the first day working JSON, you're going to watch two videos.
You're going to inspect some JSON schema, and then you're going to watch how to pull down and decode JSON data.
Now, the data set you're going to be pulling down does need an API key which I don't think you'll have, and you don't have to get it for this; you can just follow along.
I've also actually put the data set that we pull down into the repo, so within this repo you can find it.
Now for Day 2, you're going to look at how to pass the nested dictionaries within that same data set.
So for Day 1 you were just playing around with it with what you found in the video.
Now for Day 2, that's when you drill down further into the actual JSON nested dictionary part.
Now once you've watched the video on how to do it, I'd like you to spend the rest of this day, Day 2, playing with it.
So you're going to actually just use that data, pop it into your script, into your shell, whatever it is that you're going to be using, and then go ahead and just play with it.
Follow the same advice and have a go.
And Day 3 is your turn, so what I'd like you to do on this one, little more interesting, is I would like you to go to our PyBites Code Challenge 16.
We'll bring that up here, and that's all about querying you favorite API.
A lot of APIs, as we know, will return JSON data, so what you can do is, and a good example is the OMDB API.
You can use that to return JSON-formatted data on your favorite movies and then come up with an inventive way to present or request that data.
So have a read-through, have a go, and share whatever it is that you come up with.
|
|
|
show
|
2:08 |
Okay, so to start we're going to look at a basic example of JSON output or JSON schema.
Okay so it is pretty complex at times, especially when it starts getting really deep.
So just look at this basic example to understand it.
So from Python perspective, it looks pretty simple for now.
This is a really basic one again and it's about a sort of person object so you've got a title of a person.
You got the type, it's an object.
And then what are the properties of that?
Well there is a first name, a last name, an age, a description, and so on and so forth.
What really gets people and gets me sometimes with a JSON is once it's decoded in Python, all of these become nested dictionaries and lists.
And it makes it quite difficult when you're writing loops and what not to try and drill down to those nested dictionaries.
So looking at this, if this was formatted like a dictionary in Python, your first level of the dictionary has the key title value person, key type value object.
Key properties but the value of properties is another dictionary and that dictionary goes all the way down to here, okay.
And within that dictionary, you then have another key called first name whose value is yet another dictionary, okay.
And then that closes off here and then you have another key whose value is yet another dictionary and so on.
When you break it down visually, it makes a lot more sense.
That said, it is still a little bit of a crazy process trying to drill down, okay.
And we're going to work through that in the next couple of videos.
So this is just a nice basic example of what JSON schema looks like.
So have a good look at this.
Wrap your head around it and move onto the next video.
|
|
|
show
|
5:36 |
So, for this video, we're going to look at some JSON data that is returned by an API.
Okay, we're not going to just download a file and parse that.
What I'd like to do is show you that a lot of APIs respond with JSON data, okay, JSON formatted data.
So, what we need to do in order to look through all of that is, first, we need to import json, obviously, so we can decode the data.
We also need to import requests, because that's how we're going to get the actual data.
All right?
And, for later on in this video, we're going to get pprint, all right, and we'll discuss that in a bit.
Now, there will be some magic here, because I don't want you to see my API key, but, essentially, we're going to go r., r is requests, .get.
Okay, let me do some magic here.
Copy and paste the key and get this JSON data pulled down, and then we'll carry on.
All right, now I've just given us some white space here to work with, get it out of the screen.
So, r has been pulled down, the actual JSON has been pulled down, and we're going to assign that to the data variable.
Now, data = json.loads, all right?
Loads allows us to actually decode the JSON output.
Okay, so the JSON output is pretty ugly, and using json.loads, that allows us to actually decode it, and make it readable.
So, we're going to load in r.text, okay?
Now, if I was to hit data, and enter, and show you that, it would probably kill my session because there's so much data in this.
So what I've actually done is, I've copied and pasted this output into a text file for you.
And that is here, okay?
So you can see this is all the data for my character in the game.
Now, you can see the sort of nested dictionaries I was discussing before.
Okay, you've got, at the highest level, you've got a dictionary key there, and a value, and then we move on to the next one, and so on.
Keep on filtering down, until we get to mounts.
Now mounts is just, long story short, mounts is a sort of creature you can ride on in the game to get around.
So, under the mounts key, we have a large dictionary here, called "collected," okay?
And within that collected key, we have our list of dictionaries as the value.
So, you can see how far it drills down, so we've got the parent key here, whose value is another dictionary, with the key to a list of more dictionaries, okay?
And each mount, each animal that you ride on in this output, has these keys, okay?
So it's a whole array of data and it just goes on and on and on and on, and then you can see number collected, we drop out of that list here, at the end, and we get back into that, we go up one level, and we see number collected, number collected, number not collected, and then we go up to the parent level.
I want to call it the parent level, the top level, and we see realms and whatnot.
Okay?
So that is what that data looks like, the stuff we just pulled down, so how do we work with that data, okay?
Well, to look at that data, we need to treat it just like a dictionary, okay, there's a little bit of difference, and we'll get to that in the next video, but, for example, we now know what the data looks like, so it allows us to figure out how we're going to flesh it out in the Python code.
So for item in data.items, I'm just going to do a standard, sort of, dictionary parse here.
We're just going to print item, okay, and watch what happens.
We get all of that data here and it is, honestly, disgusting.
It does not format correctly, okay.
Now, I've just scrolled that out of the buffer to get the distraction away.
We can then go for item in data.items, okay, same as we just did, but this time, we're going to use pretty print, or pprint, okay, and the beauty of pprint is that it actually knows what JSON data looks like, and it formats it nicely for us.
Okay, and this is the same output we saw in our Notepad file just then.
Wait for it to continue flooding my screen, probably overloading my computer, and it's going to look just like this.
Okay, so there it is there, and that's pretty much how I got that Notepad file in the first place.
So this is JSON data.
This is importing it into Python, into your Python application, and this is pretty much printing the entire thing in a nicely formatted way.
So, in the next video, we will cover how to drill into this, but for now, have fun.
|
|
|
show
|
8:58 |
Okay, so carrying on from the last video, we have this gargantuan bit of JSON response, and it's been formatted nicely by pretty print, to look just like this.
And what we want to do, the aim of this exercise here is to take the names of these mounts.
These in the game I've collected all of these mounts in this list here.
In this list of dictionaries, and I want to get the list of them.
So how do we do that?
Well it's easy enough using key and value calls for a dictionary, to get this data here, so we're not going to cover that.
What we want to do, is talk to the data that's nested below these lists and dictionaries.
So we need to talk to mounts, the mounts key, then we need to talk to the collected key, and so on down to what we want.
So how do we do that, how do we do that in Python code?
Well the first thing we need to do is we need to start off our normal for loop.
So we're going to do for item in data, but instead of doing items as we normally would for keys and values, we're actually going to do some tags, so the key that we want to look at specifically is mounts, isn't it?
So let's just double check that.
Go back to the file, and sure enough yes it is mounts we want to talk to mounts.
And this is where things are slightly different and this is where things get a bit out of hand when it comes to handling nested dictionaries, you really have to investigate the JSON output, okay?
So we're going to go for item in data mounts, well let's just pprint item and see what we come up with.
Well, we get collected, num not collected, and number collected.
And where did those come from?
Let's go back to the file.
So we have collected here, that's the first key, okay?
We're going to scroll all the way to the bottom, and then we have the next key, number collected and number not collected.
And that's exactly what popped up here.
We just wanted the first key for mounts.
But we want to drill into the rest of this stuff.
We want to get further into mounts.
And this is where we further talk to collected.
So you can see we are now going to start staggering our way down, almost like a staircase.
So now we're going to go for item in data mounts, and we know that's collected, okay, well what's going to happen now?
I'll give you a clue so we don't flood the screen.
Printing item is going to print all of this stuff here, and we don't want to flood our screen yet again, okay?
What we do want however, is something in every single one of these dictionaries, so in this list, we have this dictionary, which comes down to here for the Albino Drake.
And underneath that we have this dictionary for the Amber Scorpion which ends here.
And we want the name; each one of these little dictionaries has a name key.
So we call 'em that.
So we've drilled down now with our code to mounts and collected, and now we're going to start talking to these keys here.
So, we're not going to pprint item, we're actually going to pprint the items, but only the name tag.
So we've got for item in data mounts, we're drilling down from the top level to collected, and then pprint the item with just the name tag.
And watch this.
There we have all of those mounts from the game, in the order that they are in those dictionaries, and that's all we got, which is exactly what we wanted, okay?
So we go back in here, you can see we got that name, Albino Drake, Amber Scorpion, Argent Hippogryph.
And so on.
All the way down here.
And it's really, really cool.
So that's how we've just worked our way down and passed our way down through the steps of the nested dictionary.
So what can we so with this?
Let's make it interesting.
Hop into this, now what's something that differs between these mounts?
Well this mount here, the Albino Drake is a flying mount because it's set to True.
But the Scorpion is not flying.
The flying is set to False.
And this is a boolean operator.
It's just True or False.
Not a string, if you considered it a string it would have had the quotes around it.
This is completely boolean, is aquatic and ground and everything.
How 'about we just try and get the flying mounts, the ones that are capable of flying through the air?
Let's narrow it down, do something a little more usable.
So we're going to create a list first that we're going to throw these mounts in, so is flying, just create an empty list, alright?
Now we're going to use the same code for mount in data mounts, we're going to drill down to the next level again, collected, well what do we want to do?
We're going to say if mount is flying, we're going to do something.
Now note that we don't actually have to check for the truthiness so to speak, we don't have to do if mount is flying equals equals True, because Python assumes True from default.
And it is in a string so we don't have to try and match it with a string called True.
We can just go if mount is flying, if it is, then we're just going to append it.
So is flying.append mount, alright?
And that's it.
So what this has stored now, it's actually stored this entire dictionary.
Each one of these dictionaries is now stored in the is flying.
What we can now do is talk to this thing, we can go Len is flying, we got 65 entries there.
Let's compare that with here.
We know our collected has 204.
I've collected 204 of these mounts in the game.
But we only had 65 stored in here, 65 of these dictionaries stored.
So we know this worked.
We know that it took just the flying mounts, the ones that are capable of flying.
So what we can do now, just to show you, we can go for i in is flying, print, we'll just keep pretty print just in case, pprint I, and you'll see we actually got all of that data, didn't we?
So we got the entire dictionary for each one of those flying mounts.
So again I'm sure you can guess, if we want just the data that we want, which is the name, we can go for I in is flying, pprint I, and then we use the tag again that we want to take, name, and there we go.
So our list has changed yet again, we no longer have things like that Scorpion, it goes straight onto the next flying mount that I've collected.
And that's it, so this is really really cool.
This is the best part about JSON.
It's got all the data there, it's just really hard to get to sometimes, so using this method you should be able to drill down through all of the sub dictionary or the nested dictionaries and find the data you want, and then you can
|
|
|
show
|
5:44 |
Okay, so that was JSON.
I hope you enjoyed it.
I know it seemed a bit basic, but the reality is that's most of the work with JSON that you'll end up doing, right, just passing the code, passing the output to find the tags that you need and pulling it out really.
So let's recap everything we did.
For the first bit of code, it was just pulling down and viewing the JSON files.
We just had a sort of overview of what it looked like, the format and what we were looking for and so on.
So we begin by putting JSON, okay.
Then we pull down the file using requests.
Then we used json.loads.
And this essentially decodes the JSON code that is, or the JSON output that's in the odd.text.
Okay so the request pulls down the JSON output and then json.loads decodes it, makes it readable for our code, okay.
Then we just handle the data similar to a dictionary, okay, and we saw that if we would adjust at the top level for the output that we had, if we had just run standard four loop iteration over the data, we got spammed with a lot of data, okay.
Now that was because we were just doing a standard print, yeah, so it didn't format it at all.
Now that's why we were importing it, the top there you can see from pprint import pprint and that is pretty print.
And that formats our JSON decoded output in a really nice way.
Pretty much the way that you would expect to see it if you had an in-browser JSON decoder or JSON viewer.
And this is a nice way of presenting it on our Python command line.
Then we had a look at the JSON nested dictionaries.
This is where things get a little more complicated and you can definitely see that with the data that we had.
So when we looked at our dataset, we saw that there was a mouse key sitting there, right.
So to iterate over that, we run four item in data mounts and then we p print the item.
And that got our next level of keys.
And specifically we then had a collected key which then underneath that had another dictionary and list below.
Okay, so we stared working our way down through the hierarchy of dictionaries, through the nested dictionaries.
Next from there we found we wanted to look for the specific names of the mounts and that's where we used the name key.
We specified that in the tag, okay.
And that p printed a really nice list of names for us.
Then we challenged ourselves to sit there and go okay out of all the mounts that we had collected, let's just print out the ones that are considered flying, okay.
And that's what this bit of code here does.
We have an empty list called IsFlying and then it goes through, checks to see if IsFlying is True, and remembering Python, you don't necessarily need to keep saying if something is true.
You can just say if something, and that is True in itself.
So if mount IsFlying, then we add the mount data, all of it, we add all of that mount data to the IsFlying list.
And then we can just iterate over that as we so pleased.
So this is the JSON data example that we've just gone over just as a little reminder for you.
It was quite in depth.
It just dug deep a little bit, okay.
You could see now everything if you've forgotten already, everything sort of makes sense.
So now it's your turn.
So what next?
Well for this one, there is actually something very specific I'd like you to try.
You're welcome to do whatever you want with JSON obviously, but I think a really good challenge for you at this point would be to go to our Code Challenge platform and just look at this code challenge on Code Challenger Number 16.
Query your favorite API, okay.
Now in this challenge we ask you to go out onto the internet to your favorite API and just do anything, okay.
Do any sort of a pull as long as you're querying the API.
But as we've discussed, APIs tend to return a lot of JSON data.
So a specific one you could try rather than going through all of these looking for one that might interest you is the OMDB API.
If you click this OMDB API link from our Challenge 16, you end up on this website here, OMDB Open Movie Database, okay.
And it actually returns JSON data and you can do some examples here and see what that will look like for you.
So if you want something to challenge yourself for day three, go through this here, OMDB, query the API, and see what you can do with the return data.
Just play with it, manipulate it, just like we did with our other code.
Maybe turn it into an app of some sort.
Just whatever you have time for and whatever you're willing to try.
And other than that, keep calm and
|
|
|
|
23:50 |
|
|
show
|
1:11 |
Hello, this is Michael Kennedy and I will be your guide for Day 10, 11 and 12.
And during these three days you're going to work with JSON APIs and in particular with a couple of search-based APIs.
But of course, what you'll learn here you'll be able to apply to pretty much any JSON API.
APIs are really important.
These are the way that you reach out and you add superpowers to your code, to your application.
You might write an application that has some data in the database, it's got some information that users have input, but maybe you want to add weather information, or integrate with Github or talk to Twitter.
All of these use APIs.
And so we're going to look at the foundation of APIs in this challenge, which is basically HTTP and JSON.
And we're going to do that from Python, of course.
So we're going to work with two services.
One service I'm going to demonstrate how we write code against it, and then I'll give you another service for your code challenge that you can play with, and if you don't like either of those services for your code challenge, feel free to just go find another one.
You'll probably have enough information to do something pretty interesting after this series of videos.
So let's go look at this movie db search service.
|
|
|
show
|
1:47 |
Over here at movie_service by talkpython.fm we have a service that has, I guess probably a couple thousand movies.
Notice down here this does not have all the movie data that you might want, it only has some of the movies, but it's more than enough for us to play with.
There's three things that this service will let you do.
It will let you basically search by keyword, so we come over here and call API search, and here we're searching for run.
And firefox likes to give you this pretty view here, let's go in and just look at the raw, so you can know what you're getting.
So here, the keyword is run, and we've got some hits.
And hits were for things like 'The Rundown', and 'Runaway Bride', and 'Bladerunner' and 'Chicken Run', and all these movies here.
So we'll be able to put whatever we want in the here, if we wanted away, boom.
'Flushed Away' is the first result.
It apparently has to do with sewers and rats and frogs.
Anyway, we can search for these movies using the service, and what we get back is this format here called JSON, which is the JavaScript Object Notation.
This is probably the most popular format for data exchange over these HTP services.
So it's great we can do it here, but we also want to do this in a slightly more structured way.
So we're going to look at two ways.
One using a tool specifically for accessing and working with APIs, cause it is pretty simple to go up here and type enter but what if our interaction required us to change the headers?
If our interaction required us to do an HTTP POST rather than a GET, which is what you normally do in browsers.
That gets tricky.
So we're going to see a tool that helps us explore the full spectrum of APIs, and then we're going to interact with it from Python.
|
|
|
show
|
1:20 |
To truly work with APIs, you need to be able to interact with the entire spectrum of the HTTP protocol, and browsers, while they technically do that, they don't let you as a consumer, as a user of the browser, really easily do that.
So we're going to look at this tool called Postman.
And I've already installed it, you can see it works on all the OSs, it's easy to install.
Let me come over here, and if we wanted to go to that same URL we had before, we could come over here and enter this, and hit Go.
And you see here's the same JSON that we got.
Here's the status code, what it means, okay versus other things, how long it took, how much data there was, what headers were sent back.
That's interesting.
We could even come over here and we could pass additional data, like user id is 72, or something like that.
Now that's not going to have any effect on this service, but it could, right?
We could even come over here and say, we're going to set the accept type, notice the auto-completion.
And accept application, let's just say JSON.
Right?
So be a little more explicit, this is the same thing we're getting.
We come over here and do a PUT and POST.
So as you interact with APIs, here and in other challenges, I encourage you to check out Postman.
It's free, and it's really nice, and you can even create an account, notice mine is nsync, and save these so you can sort of set up a structured way to interact with things, and go back and forth, save for testing.
|
|
|
show
|
0:56 |
We've seen how to poke at our API with just doing a GET request.
We've seen Postman lets us explore better but if we want to access it from code, we need another way.
Now, Python has a built in mechanism for accessing HTTP APIs but it's not the prettiest thing in the world.
So a guy named Kenneth Reitz created this thing called Requests.
Maybe you've heard of it.
It's definitely one of the most popular packages, period.
And to use it is really, really simple.
We're going to use it in just a moment.
If you want to get a URL, you just say GET.
Here you can even pass the auth, check the status code, check the encoding, check the text, and even convert the JSON back to Python dictionaries.
So this is a very popular library.
It's definitely the most-used for accessing HTTP services or Python directly.
So, unless for some reason, you are very adverse to having a dependency on an external package, this is the way, this is the way we're going to do it in Python.
So, next up, let's get started and actually write some code.
|
|
|
show
|
4:07 |
So it's time to get started writing our search app that's going to talk to the movie search API.
Now over here in our repository, I've got Day 10 to 12 selected and I've opened up the terminal here.
We want to open this in PyCharm.
You don't have to use PyCharm, but I'm going to open in in PyCharm.
I'm going to go through a couple of steps.
Whenever you depend upon external packages, it's a good idea to have a virtual environment.
In order to create one of those over here, let's call this app, let's make a folder really quick.
So call this Movie Search.
And go in here.
Then, I'm going to create a virtual environment here.
If we call it .env or venv, then PyCharm will automatically detect it and use it, so might as well call it that.
Now open this in PyCharm, can't seen anything because dot creates hidden files on Mac and Linux, but we're going to open this on Mac and Linux, you have to say file, open, directory and Mac, you can just drop it here.
Let's go ahead and tell PyCharm about about git, so everything I create is going to be put into the git repository for you.
And that'll be a little easier here, go ahead and also tell it to ignore this directory.
Maybe someday it'll do that on it's own.
Now I want to create two files, I don't like to cram everything into one Python file.
When I'm creating an application I want to partition it into pieces so let's go over here and create two things.
We're going to create a program and we're going to create an API.
And go ahead and tell PyCharm it can add stuff to git.
Okay so what we're going to do is we're going to write the code to access the service in the API file and we're going to work with it from the user interaction perspective and orchestrate it from over here.
So let's define a quick method over here, main.
And we'll just have pass.
Now we want to follow the convention for running this program if and only if it's the target of execution.
And in PyCharm, the way that, or, in Python, the way that you do that is you use this if dunder name equals dunder main, then that means it's supposed to run and I'll just call this method here.
This is a little bit set up and ready to go.
We're going to use something over in the API so we're going to create a method here that's going to take a string and it's going to return some search results.
So create.
And say find movie by title, let's say, because that's what we're actually searching for here.
And the keyword, and it's going to do some stuff and return some movies, that's going to be great.
How do we do that?
Well first we have to work with requests.
So we'll come over here and say import requests.
Now let me go ahead and run this, it's not going to work out so well, we're going to right click and create a run configuration in PyCharm, or you just type Python 3, you know, program.py.
That didn't actually import it so nothing actually happened.
But let's do, if we come over here and say import api as we're going to need to, now we try that again, boom, there is no requests.
So of course we have to install requests.
Now if you look in our terminal, notice we have the virtual environment activated here, so we could say, see what's in there.
And there's nothing really in there.
So one of the conventions people like to follow is when they have dependencies they'll have a file called requirements.txt.
And in there, they'll put library names like requests.
requests, like this.
And notice, PyCharm already knows, hey, you need to say pip install requests, or you can just click this and that'll do it for you.
If you wait for a second down here and then we do the pip list again, there should be more stuff including requests, our program should now run.
Ta-dah, okay.
So we have just the basic structure of this thing hanging together, right?
We've installed requests, we've created the program, and the api separation, we've got our requirements, and it's all kind of hanging together.
Next up, we actually have to write our method here, about how we find movies.
|
|
|
show
|
2:23 |
So we have the basic structure of our application written here, but now we want to actually go, when somebody calls this function, we want to go and download this result from our search service, so, recall over here in our movie search service, we put something like this.
We say api/search/{keyword}, and then the search will happen.
So let's go over here and first create the URL.
And the URL we're going to use f-strings.
This is a Python 3.6 feature, if you don't have Python 3.6 or above, then you're going to need to do the older style format.
So we'll say like this, and we want to replace that little part with the variable keyword, so in Python 3.6 with these f-strings, you can say, {keyword}.
Notice the autocomplete.
So, let's begin just by printing out URL, and just make sure that we're on the right path.
So we're going to come over here, and we're going to call result...
Spelling is hard.
Results equalsapi., notice there's our little thing, and let's just, for now, say this is going to be runner.
Going to search for runner.
So if we run this, that looks pretty good, we can click it and test.
Okay, looks like we got the maze runner and runner runner, that's a lot of running.
And so this is working.
Now instead of printing out this, let's actually use it.
So we'll say response equals requests, which we've already installed, get, and we'll pass the URL.
We could go ahead and just work with this.
We could say response.text, unless that failed, unless the, say, wireless is down or something.
So we need to be careful and say, I want to make sure there was no error.
There's a status code, you could check it.
But requests has this cool method called raise_for_status.
So if anything went wrong for whatever reason, you'll get an error, otherwise you can just keep going.
So now we have, and we can print out, what we got back here, and then again.
And notice, there's all the results coming back, well, at least all the ones the server would give us.
That's pretty cool.
Now, we actually, not to like...
We don't want to work with strings, we want to work with data.
So the next thing that we need to do is convert this text into Python dictionaries from the JSON source.
|
|
|
show
|
2:30 |
So we've seen that we've downloaded the data from our search service and we have created the right URL that works, we already tested that in our browser and printed out the text.
So the next thing we need to do is convert the text from JSON format into Python dictionaries.
Now we could use the json library in Python but request has a little goody for us here so we can say results equals response.json, that's all we need, it's converted to JSON so we could print out, it's converted to Python dictionary so we could print out the type of results and we could also print out the results themselves so if we do that, notice we get a dictionary and here we have the keyword and then we have the hits, which is a list of objects that have titles.
Let's try to print out, let's try to return those and then at the program level, print them out.
So, get rid of that and we'll just return results.get hits.
Right, we don't care about the extra data, we just want the results.
And then over here, we're going to get those results back and we can say, for are in results print, let's just print out the title.
Title is, let's, keep going with the f-strings, huh?
Say are .get, now notice we have to treat this as a dictionary, we'll prove this in a moment, like that.
Okay, let's run this and see what we get.
Man, look at that, title.
Blade Runner, Maze Runner, Kite Runner, something else, Logan's Run and so on.
Awesome and we could even do a little bit better, we could say, print, there are length of results, movies found, something like that.
There are six movies found, okay.
Excellent, you might want to do a little test movie, 1 movie, 2 movies, 0 movies, things like that but we're going to just keep it always plural here.
Alright so this is pretty good but notice this, I'm not loving this at all and the more we have to write out there, we could say something like that and IMDB score, let's say we're going to write that out so we'll say, are .get what, what do you put here?
I have no idea.
It's completely annoying that you get no help about this, we could go look this up but let's go and actually improve that in the next video.
|
|
|
show
|
5:04 |
Let's make two quick improvements before we wrap up this application.
First, we're always searching for runner.
How exciting is it to always run this program and just get the same results?
Let's actually make this a thing that the users can input.
So we'll begin by creating a variable.
We could just go and type a variable name, assign the value and put it over here, and use PyCharm to refactor.
Say I want a variable called keyword.
That's pretty cool.
Make sure it still runs, it does.
But let's actually go and say input.
We'll ask the user for input, and we'll give them a prompt.
We'll say keyword of title search for movie, or something like this.
So now when we run it down here I can search for away and we get The Runaways.
I can search for runner and we should get Bladerunner, and we can search for fight, Fight Club, whatever.
Whatever we want to search for, we can now do that.
This is already really awesome, but notice the API is, I'm going to call it crummy.
So we're going to fix that with one more thing.
We're going to use this thing called collections.namedtuple So down here I'll say I'm going to define this type that represents a movie.
It's going to be a collection.namedtuple, and the way it works is you say the name that it thinks its own name is, and then you say all the fields that go in there.
Now this turns out to be quite a pain, so let's go back over here and see what we get.
IMDB score, we have a rating, an we have all these things.
So this is the typical value here, it's going to look like this So in order for this to work well, we have to have all these values listed in series over here.
So, I'm just going to type this in, then I'll speed it up.
Phew, there I've typed them all in and I'll maybe do a few line breaks here just so it fits on the screen.
I just typed in the top level elements here.
So what we can do, is we can actually instead of just churning JSON results, we can actually go over them and return these types, and we'll see why that's a benefit in just a second.
So we'll say this, we'll say for our end results, you know, the hits, maybe H, I don't know.
We're going to need a list, going to say movies, that's a list.
I'm going to put this in here, so we'll say movies.append and we need to append one of these movies.
So we can create a new one and we have to type all of these values in here.
We have to say IMDB code equals R.get IMDB code.
Title equals R.get title, and so on.
Or, there's a way to unpack a dictionary, which is what this is, back into keyword arguments with the names being the keys just like that.
And, the way you do that is you say **, the dictionary name.
So it's as if you said IMDB code equals whatever value it has for IMDB code.
Title equals whatever value it has for title.
It's just a super short, simple way to do that.
So now if we return movies, up here is not going to work the same, but now we can just say R.title, and things like that.
HasScore, take that little bit away.
HasScore, let's say,r., what did we call it?
IMDB Score, that, now let's try that.
Now we are going to search for runner, stick with that.
Boom!
Look how cool that is.
Now, we're still not where we quite really wanted to be.
If I hit dot, we get not, so as in not helpful!
One final trick of what we're going to do, let's go over here and we can use what's called type hint in Python.
Python is a dynamic language, it has no syntactical typing, but you can give the editors hints, and I can say this is actually a string, so you say colon type name and the return value is a list which is actually defined in a typings module, so got to import that.
So we want typings.List.
Notice the, let's put at the top here.
And it's going to be a list of movies like this, okay.
So with a little bit of a hint, I can come over here and now I type r., look at that, director, duration, IMDB code, IMDB score.
Let's just add one more.
With code r.code, now that's the way we like to write.
All the help we can get.
Let's search one more.
Anything on computer, of course!
Hackers with code TT whatever HasScore 6.2.
Awesome, there you have it.
This is how we can consume the movie API.
When you've broken apart into our, our sort of user interaction bit of code here, our API access code here.
We use requests to actually get the data and convert it to JSON and we used a namedtuple to help package it up into something that makes more sense to our program, as well as adding a little type hints, so that the editor actually leverages that help we gave it.
|
|
|
show
|
1:26 |
Let's review the concepts in our search API.
We started out by consuming the MovieDb service, at movie_service.talkpython.fm.
We saw that we could get postmen, which is a really nice way to explore and interact with the API, the full spectrum of HTTP APIs.
And we use requests in Python to actually do the direct interaction in code.
When we zoom down to the code level, you can see that we start by importing requests.
We're going to need to use this library, so we got to import it, and remember we had to install it with pip as well, or make it part of the requirements and PyCharm helped us, but we could have also said pip install -r requirements.txt and achieve the same effect.
Then we're going to go and actually download the data.
Take the URL and say, request.get URL.
Like, this is a response, this is what we work with for the rest of the time.
We want to make sure everything worked, so we're going to check for success with raise for status, and then we want to take that string of JSON and turn it into a Python dictionary.
So we do that by calling .json.
Notice if the format is not actually JSON, this will crash.
But it was JSON in our example, so it completely worked.
After this it's plain Python, there's no more HTTP service involved, we just have a Python dictionary, and you work with it like you do regular data in Python
|
|
|
show
|
0:44 |
Now you've seen me build an application using requests to consume a JSON API.
It's your turn to consume a different API.
So drop over here in GitHub, and we're going to go through the various things and the read me here for what you do for this particular day.
We're going to start out by basically just making the skeleton, create a virtual environment, create a program .py and an api.py, and just make sure that you can import one from the other, and we're going to install Postman.
So make sure you install the Postman application.
Most of what today was was just watching the corresponding videos.
So get everything setup and get ready for the next day.
|
|
|
show
|
1:43 |
Second day of this section is going to actually be to work with an entirely different API, but another one around the podcast just to keep it simple and stable.
So what your going to do is we're going to interact with this search.talkpython.fm Now if you're over here and you're on Talk Python, and you try to search, you could say "I would like to search for let's say, a 100DaysOfCode".
Pull that up you can see it went back and found a couple of elements, an episode and a transcript, and it did this in a ridiculously fast period of time.
But there's actually an API underneath here there's JSON API, and you can write queries you can search yourself right?
it's open, and searchable for you and it's exactly like what you've been working with.
So let's go over here and play with this a little bit.
Click on this, and see the raw data, This is what you get back if you search for tests, so whatever you do is you put the little query string pieces there, so we'll put a100DaysOfCode, and it's going to come back Firefox tries to make that response pretty, but it's going to come back looking something like this.
Alright, so this is the API we're going to work with.
So the first thing you're donna do is explore the API imposement, and your goal for the day is to create a program that does the following: It gets a search word from the user, It calls the search service using that API we just looked at, it makes sure the response from the server was okay so request.
response.raise_for_status I believe, And then you want to return just a basic dictionary of the results, and use that to list out the titles.
So it should look something like this on Day 2.
Run your program, it has a little header if you want, ask the user for some search terms and it says "Boom.
These are the titles."
|
|
|
show
|
0:39 |
The last day is adding polish.
We're going to use a namedtuple.
Now here's an example from our movie one.
You want to create a corresponding one for a search result.
The other thing we're going to do, this is really, really simple and slick, is, if we look over here you'll see that there is a URL that you can get to for every result.
What you're going to do is you're going to write a little bit of code that asks the user which one of these would you like to view in your web browser.
Maybe give 'em a number, and they can put 3, and so then you're goal is to write a little bit of code that will open the web browser and a new window at that URL, and literally those two lines of code is all it takes across platform.
|
|
|
|
34:05 |
|
|
show
|
0:42 |
Okay, everyone welcome back.
This is web scraping with BeautifulSoup 4.
I'm Julian Sequeira, again, and just a disclaimer, this has nothing to do with dinner.
This has everything to do with web scraping.
If you're hungry, go get something to eat.
If not, crack on, because what we're going to do now is this is going to be a very quick module.
We're going to run through pulling down a webpage with requests, not in any detail because we've done that before.
Then we're going to parse that webpage information with BeautifulSoup 4.
You can do some really cool stuff, so I'm very excited to show you this one.
Just set up your environment and the next video, and then we'll get straight to some code.
|
|
|
show
|
2:46 |
This is the readme file for beautifulsoup4, for Day 46 to 48 on web stripping.
Now, day N the first day you're going to be working on this course, I would like you be watching the video on setting up the environment, getting a quick overview of beautifulsoup4.
This is if you have no familiarity on what it is and how it works, and then build your first Beautiful Soup 4 scrapper.
It's actually not too much work, but there is a bit of theory there, with the overview, and you should be able to get it up and running, and then give it a crack yourself, okay?
Watch the videos first, because if you're not familiar with it, it does help to watch it start to finish, okay?
Pull your first site, use the example site in the video, or if you really want to challenge yourself, grab another one.
Day 2, what I'd like you to do is watch this video on requests best practice, okay?
This is covering a little thing that people tend to do with requests that is actually the wrong way to do it, and we discuss the best practice for actually doing it, I won't give it away now.
Then, what I'd like you to do is follow along with this video, detailed Beautiful Soup 4 scrapping and searching.
This will actually go through how to do some targeted searching, so to speak, of the data that you pull down and scrape, okay?
It can be a bit tricky and a bit frustrating to find exactly what you want, but stick with it and you'll get there in the end.
And Day 3, as usual, it's your turn.
So, you've figured out how to scrape a website, you can pull the data that you want, so now I'd like you to actually do something with it, okay?
So store it database, display it in something like a Flask app or a GUI, automate it by emailing it, do whatever you can think of, right?
So, come up with something and do that.
If you can't think of anything, you could try this one.
I've added an extra option here for you to try, which is to find a site that looks complex.
Think of something that maybe has Flash, or whatever other animations on the website.
Pinpoint a data sample, so just something on the website you think that could be interesting, and then see if you can extract it using Beautiful Soup 4, okay?
So that's it, give anything like that a try.
Day 3 is your freestyle, free-for-all, do whatever you want, and just have a good play.
And, move on to the videos and get started.
|
|
|
show
|
1:09 |
Okay, we just have a little bit of setup to do for this one.
First things first, as always, let's create our virtual environment.
Same thing, venv.
Once that's installed, we need to install Beautiful Soup 4, of course, but we also need to pip install requests.
So let's do that quickly.
We'll just activate, the virtual environment here.
Okay, now we can do pip install requests, and once that's done, we can then do pip install bs4 You can probably type in beautifulsoup4, but bs4 is fine, and that's it.
We have that installed.
The last thing I'd like you to do is just create a file called scraper.py, and throw that into your project directory.
When you run it, it will look something like this, scraper.py, just here.
Okay, and that's it.
So once you've got all that set up, launch your file and let's move on to do some coding.
|
|
|
show
|
2:08 |
I just thought I'd give a quick overview for anyone who hasn't dealt with Beautiful Soup 4 before.
So if you haven't, feel free to keep watching, but if you have, skip on over because I'm just going to be repeating myself.
Now, Beautiful Soup 4 allows you to parse web pages.
Okay, we've all dealt with requests by now and we know that we're using requests, we can pull down the code behind their web page, right?
And we can then use Beautiful Soup 4 to parse that data.
All right, I'll tell you what I mean.
So, let's view the page source for our PyBites Code Challenges page.
And here you'll see all of your HTML.
Now, if I wanted specifically to get all of our code challenge names and just put them in a list to make in some sort of an email or whatever application I can think of, right.
Well, how am I going to do that?
If you go into the page source, you need to find, the first thing you need to do is you need to find that data in the code and here it is.
It's an unordered list with ID of article list, and a class of article list.
Okay, and then all of our different challenge headers are stored in list elements, okay?
Now, with that information in hand, we can then use Beautiful Soup 4 to search this page, remembering that requests will pretty much pull down this page looking like this, and Beautiful Soup 4 will parse that, and we can then tell it what to look for.
And now you can start thinking, imagining the cool things you can do with this.
So, we can skip all of this junk up here, all of this code that we don't care about, and drill straight down to the list that we do care about.
And you can use this on any site that you can think of.
You can search by all sorts of different criteria.
And we're going to show that in the next video.
So, get excited, because this is really, really fun stuff.
|
|
|
show
|
9:39 |
Time for some code.
We need to think about what we're going to do first.
The first thing we need to do is actually pull down our website, and what are we going to use for that?
We're going to use requests because we pip installed it, didn't we, that was a bit of a dead giveaway.
We're also going to import bs4.
That's it.
Let's specify the actual URL that we're going to be dealing with here, I'm just going to copy and paste it.
This is the URL of our Pybites projects page.
Looking here, we have out PyBites Code Challenges.
What we're going to do with this one is bring down all of these PyBites projects headers, so, our 100 days.
Our 100 Days Of Code, our 100 Days Of Django.
These different headers.
We're going to pull all of those down and we're just going to use that as a nice, simple example for this script.
Let's start off our code with the standard dum dum.
Now, what are we going to do?
The first thing, obviously, as I said, is to pull down the website, so let's create a function for that.
def pull_site, nice and creative.
We're going to use requests, so I'm going to do this really quickly just so that we can get a move on because we've dealt with requests before.
So, requests.get URL.
That will get the page and store it in the raw site page object.
So, raw site page .raise_for_status Now, this is just to make sure that it works.
If it doesn't work, we'll get an error.
And then, we're just going to return, raw site page.
Nice and easy.
Let's just assign that to something down here called site.
This will assign the raw site page to a variable called site.
Now, we'll record a video after this explaining why this is not a good idea, what we're doing.
But, for now, as just a nice little explainer, this will do.
Let's create another function.
This function we're going to call scrape.
It's going to be used against our site object.
We need to think ahead a little bit.
I'm going to think ahead by putting this list here.
If you think about our page, as we pull this data out of the page, these headers, we need to store them somewhere, don't we?
We must store them in a header list.
We create the empty list.
Now we get to the Beautiful Soup 4 stuff, and this is really, really easy, so don't worry if you don't wrap your head around it.
But it's only a couple of lines of code, which is why we all love Python, right?
We're going to create a soup object, and it's not a bowl of soup, it's just a normal object.
bs4.BeautifulSoup4, .BeautifulSoup, sorry.
We're going to take the text of the site.
So, site.text, we're going to take that.
That's going to be called against our Beautiful Soup 4.
We're going to use the Beautiful Soup 4 HTML parser in order to get our sort of HTML code nicely into this soup object.
Once we do that we have our soup object and HTML header list.
This is going to be a list of our HTML headers.
You can see what we're doing.
This is already really, really simple.
We've taken Beautiful Soup 4 and we've told it to get the text of the site using the HTML parser because site is going to be a HTML document, pretty much, right?
We're going to store that in soup.
We're creating an object here that is going to be...
I'll show you.
HTML header list equals soup.select.
What are we selecting?
The select option here for soup, it allows us to pull down exactly what we need.
We get to select something out of the HTML source.
Let's look at the HTML source again.
We'll go view page source.
We'll get to these headers.
The first header is called zero.PyBites apps.
We find that on the page, it's going to be in a nice little h3 class.
What's unique about it, and this is where you really have to get thinking and analyzing this page, the thing that's unique about all of our headers here, so, here's zero, here's number one down here, but they all have the project header CSS class.
Playing with bs4 does need some tinkering.
Occasionally, you'll find someone will have reused the same CSS class somewhere else in the same page, so when you select it you'll get more than just what you wanted.
But in this case, I know, because this is our site, we've only used project header against these headers that we want to see, these ones here.
We're going to select everything that has the project header class.
Let's copy that.
We'll go down here, this is what we're selecting.
We have to put the dot because it is a CSS class.
And let's see it.
All this has done is we've created the soup object of the site using the HTML parser, and then we've selected, within our soup object, everything with the CSS class project header.
We've stored those, we've stored everything that it finds into HTML header list.
Easy peasy.
Now all we need to do is iterate over this and store the information that we need into this header list.
We'll do that.
We'll go, for headers in HTML header_list we're going to go header_list.append, as we know how to do that.
headers.get text.
We're saying, just get the text.
Just to show you what that means.
Everything in here, in the class project header, we actually got the whole h3 tag.
That soup select pulled the whole tag, but all we wanted was the text.
That's what the get text option does, that's what this get text does right here.
It strips out the tags, the HTML code, and gets you just the plain string text that we asked for.
That's it.
We want to see these headers, so let's just quickly create another for loop here.
For headers in header_list print, ooo, what did I do there?
Print headers.
And that's it.
Save that, and what this will now allow us to do is print out the headers that we have stored in header list in this for loop here.
Let's have a look at that and see what it looks like.
Silly me, I've forgotten one thing, we actually have to call our scrape function.
So now we will write scrape site.
Simple.
Save that, and let's give it a crack.
I'll just move the screen to the right.
There's my command prompt.
Let's just run Python scraper.py.
Hit Enter.
And it worked, look at that.
There's that plain text that we asked for with the get text.
We got the first header, PyBites apps.
We got second header 100 Days Of Code, 100 Days Of Django, and so on, and so forth.
Now we have a list with just our headers.
This is really cool.
If you think about it, you could use this to create a newsletter.
You could use this to save your website's headers for who knows what, to print out in a list and stick on the wall as a trophy.
But this is the idea of Beautiful Soup 4.
You can get a website and you can just strip out all the tags and find the information you want, pull it out, and then, do things with it.
So, it's really, really cool.
The next video we're going to cover some more interesting...
|
|
|
show
|
1:50 |
Alright, one quick public service announcement regarding this code that we've just written.
This section here, the pulling of the site.
Not actually kosher to keep that in this script.
The reason for that is we don't want to submit a request to a website every time we want to scrape some data.
We might run a scraper like this at a different interval set to actually pulling the website.
The reason for that is, you think about it, not every site is going to update every few minutes.
Not every site is going to update every day.
So if you keep pinging that site with a request, you're going to very quickly spam them.
You might even get yourself blocked.
And you could use up their bandwidth limit.
There are certain websites that, you know, can only support a certain amount of hits per per minute, alright?
And if you keep doing that, you're going to make the website that you enjoy viewing so much pretty unhappy.
So the best practice here is to put all of this into a different script, run that on a cron job at a different interval or whatever other automated way you want to do that, and then using Beautiful Soup 4, point at the downloaded HTML file or at the page that you have pulled down from requests, alright.
Nice and easy.
It's actually much more pleasant for everyone to do it that way, and I would totally recommend doing it.
The only reason we've done it this way right now is just for demonstration purposes.
It's much easier.
But in production, definitely put your requests in a different script and use Beautiful Soup 4 to talk to a static file, not the actual URL, unless of course it's a one off thing.
|
|
|
show
|
10:20 |
Alrighty, now we want to actually do something interesting so let's go to our article page here on PyBites.
I want to do something like pull down every single article name that we have written.
Very, very daunting so the first thing we want to do is view the page source.
If you, just a quick tip, if you ever get stuck and you're not too sure what is what in this page here, you can click on inspect.
As you scroll down through inspect through the code the HTML code within the inspect, you'll actually be able to see what is which part of the page.
We need to lower this down here, lower this down here.
And here is our HTML code that runs the page.
As we hover down through these little tabs, these little arrows here, these drop downs, you'll see parts of the page get highlighted.
That's how you know which code is actioning which part of the page.
We know this is our main here.
We find the main tag and sure enough that's highlighted.
Now we can click on article here.
You can see that's highlighted the section in the middle that we want, right?
We can keep drilling down.
Here is the unordered list, ul, that is our list of article names.
Then here are all the list elements, the li.
Open them up and there is our href link and the actual name of the article.
That's what we want to pull down.
We can look at that quite simply here.
But in case this was a much more complex page such as news websites and game websites and whatever, you might want to use that inspect methodology.
Alright, now that we know we want to get the unordered list, let's do some playing in the Python shell.
I've started off by importing Beautiful Soup 4 and requests.
I've already done the requests start get of our articles page.
We've done the raise_for_status to make sure it worked.
Now let's create our soup object.
So soup equals bs4.BeautifulSoup, oops, don't need the capital O.
site.text.
So this is very similar to our other script.
And HTML parser.
Alright, and with that done what can we do?
We can search.
We don't have to use that select object.
That was very specific and that was very CSS oriented.
But now we're going to look at tags, alright?
Back on our webpage, how's this for tricky?
The individual links don't have specific CSS classes.
Uh-oh, so how are we going to, how are we going to find them?
Alright, we're going to have to do some searching right?
How about we search for the unordered list.
We could just do soup.tagname, isn't that cool?
Now you just have to specify the tag that you want to find.
You don't even have to put anything around it.
It doesn't need to be in brackets, nothing special.
Soup.ul.
Hang on a minute, what do we get?
Now look at this, we got an unordered list.
Ah but, we got this unordered list.
We got the actual menu bar on the left.
We didn't get this one.
Now why is that?
That is because soup.ul, or soup.tag only returns the very first tag that it finds that matches.
If we look at that source code again you'll find we actually have another unordered list on the page.
That is our menu here, okay.
That's not going to work using soup.ul is not going to work, because we're only pulling this one here.
What do we need to do to find the next one?
Well we need to do a little bit more digging.
We could try the soup.find_all options.
Let's see what that returns.
So soup.find_all.
Then we specify the name of the tag that we want.
We're going to specify ul.
Let's hit enter and see what happens.
Look at that, we've got everything.
We got all of the article names.
Let's scroll up quickly here.
But no we also got the very first unordered list as well.
We got that same menu bar.
How do we strip that out?
Well, I suppose we could go through and do regex and all sorts of crazy stuff.
But Beautiful Soup actually let's you drill down a little bit further.
What makes our unordered list here unique?
On our page, on PyBites, it's the only unordered list that lives within our main tag.
Look up here, here's main.
That's the opening of main and we saw that closing of main down on the bottom.
And look, it's the only unordered list.
What we can do is we can do soup.main.ul.
You can see how far we can actually drill down.
Isn't this really cool?
We run that and what do we get?
Let's go back up to where we ran the command and from soup.main.ul, we got the unordered list and we got all of the list elements with the atags, the hrefs, and the actual plain text in the middle.
There we go, we've already gotten exactly what we want.
But we actually don't need all of these tags around the side.
We don't even need the URL.
How are we going to get around that?
Well let's see what we can do.
We don't actually need the unordered list, do we?
We don't need this whole UL tag, we only need the list elements and we know from looking at the code that these are the only list elements within the main tag.
Main tag ends here, there's no more list elements.
What if we do that same, find_all, but just on list.
Let's go soup.manin.find_all, because we're only going to search within the main element.
There we go, look at that.
It's not formatted as nicely as the other one that we saw, but it is the information that we want.
You've got your list elements, you've got a URL, and they you've got your title, and then it closes off.
Let's give ourselves some white space to make this a little easy to read.
What can we do, we want to store all of that.
Let's store that in a list called all_li.
We're getting all of the li options.
We do soup.main.find_all li.
Now all of that is stored in all_li.
Now how cool is this?
The text in here in each one of these list elements is actually the stream, right?
You know that, we discussed it in the previous video.
What we can do, we can do for title in all_li I guess for items for each one of these items.
I shouldn't really use the word title.
Let's actually change that to be for item in all_li.
It's this we're going for each one of these just so you can follow along.
What do we want?
Well we want just the subject line.
We just want this string, we just want the text.
How do we specify that?
We go print, now this is going to be really easy and I'll tell you what, it's just crazy sometimes how simple they make it.
item.string, and that is it.
Can you believe it?
To strip out all of this, all the HTML and all we want is that, item.string.
You ready?
How cool is that?
We've just gone through I think it's like 100 objects, 100 articles that we've written.
We've just printed out all the names.
This would be so cool to store in a database and check back on it from time to time.
Email it out, keep it saved somewhere.
I love this sort of stuff.
There you go, we've look at quite a few things here.
We've looked at find_all.
We've looked at using just a tag name, and we've looked at using a sort of nested tag name.
So you can actually drill down through your HTML document which is super cool to help you find nested or children objects within your HTML.
That's Beautiful Soup 4.
That's pretty much it and it's absolutely wonderful.
There's obviously so much more to cover and that could be a course in itself.
The documentation is wonderful.
Definitely have a look through that if you get stuck.
But for most people this is pretty much the bread and butter of Beautiful Soup 4, so enjoy it, come up with cool stuff.
If you do make anything cool using bs4, let us know.
Send us an email or something like that.
|
|
|
show
|
5:31 |
And that my friends, is the basic overview of web scraping with Beautiful Soup 4.
There is so much to it as I said, but this should get you up and running, and I hope it was enough to really get you excited about web scraping and get you creating some cool stuff.
So just a quick re-cap of everything we did.
Well we scraped a website, and the first thing we did, was we imported Beautiful Soup 4, simple, simple, simple stuff.
Now, we then scraped the site, okay, and then we created an empty header list, all right, the first step was to create an empty list so that when we got all the headers, we could pop them there.
All right, now this is the important part.
We're creating the soup object, the Beautiful Soup 4 object and we do that by running that bs4.BeautifulSoup and we tell it to get the text of the site, site.text and pass it using the HTML passer.
All right, and then, we decided to select, okay so we're being very specific here, we were selecting the css .projectheader class, so anything in our document; in our HTML document; that had that class was going to appear, and we were very lucky, we did the research, and we found that our H3 headers, were the only tags that use that CSS class, okay, that's why it could work.
So just be careful again in case you pull a class that quite a few HTML objects are using, 'cause then you're going to get a lot of unexpected results.
All right, and then after that the only thing worth noting here, is as we were creating our list, our header list, we were using get text on all of those headers, on all of those items that we selected using the projectheader class, to just get the text, we wanted the get text option there.
Okay, and that's the scraping a website, pretty simple, next we did some funky command line stuff, using the Python Shell, and that was just to demonstrate some very simple, yet effective Beautiful Soup 4 features.
All right, so the first thing we did was we imported bs4 of course and then we created that soup object again, so skipping through that.
The first cool thing we did is we were able to search the entire site, that soup object that we created for the very first ul tag, remembering that this sort of search, only brings up the first tag, okay and that didn't work for us.
Then we wanted to find all of the ul, the unordered list tags and while that works, that brought up everything and again, that's not what we wanted, so find_all, will search the entire HTML site, for that specific tag.
All right, now, this time we decided to drill down into the main tag, so as we've covered, you have that nice little nested feature here, where you search soup for the main tag and then we went, within the main tag, drilled down to the unordered list, and the first unordered list it pulled, was the list we wanted, but again it had ul tags in there which we didn't actually need for our purposes.
So then we did something very similar, but in this case we wanted find_all, because if we had just specified soup.main.li, we would have only gotten the first list object within main, so this time we go soup.main.findall list tags, find all of the li tags within that HTML document, okay, that fall underneath the main tag.
And then we stored all of that into an object called all_li, and then we just iterated over it using a for loop, pulled all of the items within there, the individual li tags, and then we used .string to simply pull, that plain text, the plain text, the headers of our articles and that was it.
Nice and easy, pretty simple stuff, the more practice you do, the better you'll get.
And that was it, so your turn, very cool stuff.
Go out, I reckon the challenge for you should be to go out to one of your favorite sites, okay, find maybe the news article section and try and pull down all of their news articles.
Maybe just on one page, maybe across multiple pages, do something like that.
Even try and pull, rather than just the header, maybe try and pull the very first blurb of the news article.
Do that maybe it's a game news website, could be anything you want, but just give it a try.
This is now your chance to go out there and try and pass a website.
If you want a really fun one, try going to talkpython.fm and try and pull down maybe all the episodes.
Either way, have fun, keep calm and code.
|
|
|
|
31:01 |
|
|
show
|
0:50 |
As you advance further in your Python projects, you're inevitably going to hit a point where you write some code and it's just slower than you want it to be.
This happens all the time, when you're doing scientific computation, you're calling services, maybe you're talking to a database.
It really happens a lot on the web 'cause, for popular websites, performance is critical.
We're going to spend the next couple of days focusing on how to get Python to tell us exactly where it's spending its time.
Making things faster, that's a different problem.
How do we optimize our code, use the right data structures, and so on?
That's what you might do after this, but this will tell you where things are slow, where you need to focus your effort.
This whole concept is called profiling and you'll see a lot of it is built right into Python.
And there's some great external tools, as well.
|
|
|
show
|
1:11 |
Now something that will probably catch you off guard at some point is that your intuition is actually really bad for guessing where program is slow and where it spends its time.
This has happened to me many, many times and I've been doing programming for a long while.
Sometimes you get it right, but often you don't.
So the first thing that you need to do before you try to improve the performance of your application, is measure, measure, measure, and that's profiling.
So what we're going to do is we're going to run a built in command that's built in to Python itself to measure where our code is working.
And we're going to do this in two particular ways.
We're also going to have some nice output.
Now in the beginning the output that we're going to work with is actually going to be just sort of a text table type thing in the terminal or just in the program output.
And at the end, I'll show you actually how to get PyCharm to draw these little graphs where it shows you we start up program and call main, main calls go, and then go is calling these 3 functions and even the color tells you where you're spending the time.
Like, the red is worse than the yellow which is worse than the green, and so on.
So we're going to be able to get this kind of output and understanding from our program.
|
|
|
show
|
4:14 |
Let's take a practical example and see how profiling can help us understand this performance.
We previously talked about exploring CSV data earlier in the course, so we're going to take that exact same code and we're going to try to understand it, and in fact tweak it a little bit, based on what we see in the performance.
So, let's pull this up here.
We actually have in our demo code over here, under 'Days 49-51' we have two copies, and right now they're the same, of course the final code'll be changed, the starter code is exactly what you're going to see which we start with.
So you can play around with this data over here, this is more or less just the end product from the CSV section.
Over here we're going to work on this and we're going to try to understand its performance.
We're going to actually step outside of PyCharm here, let me just copy the path to this file, there's a couple things we'll need to do.
And first thing we want to activate our virtual environment.
What we want to do is we want to use a built in module and we can understand the entire program's behavior from the outside, we don't have to write any code to do this.
So what we want to do is we want to run cProfile, and we want to tell it to sort, we'll talk about sorting in a minute, we want to run that against program.py.
How's it going to work?
Poorly, because it's not a separate program, it's just a module in Python so what we need to do is say Python -m to run the module.
cProfile, capitalization here, capital 'P' matters.
Now we're going to give it this, and let's see if that works.
Okay, great, we got a bunch of gibberish-looking stuff here, a lot of things going on about frozen imports and all sorts of things, and it turns out this is not how we want to look at our code.
I don't know how it's sorting it but it's not the right way.
We would like to sort by cumulative time.
There's basically two things that you probably care about here.
One is per call, which is how much time is each one individually spending, and I think this is sort of the same thing, like how much time is just in this function.
Not functions it calls, or above, but like summed up across the number of calls.
But I find that by far the most useful one is this cumtime, cumulative time.
So let's go over here, and you need to pass the sort parameter, but it won't work if you put it over here, -S.
It needs to be before the script.
So we'll say '-S cumtime'.
Try it again.
Okay, now let's see what we've got.
A couple of built in imports, and notice we're working with research.py and program.py so this is some module stuff, this is not a lot we can do.
But this right here, research.py init, this is pretty interesting.
So this is actually the code that we call to read, basically parse the CSV.
So if we look over here, this init is the thing that actually does the loading, the parse row.
Over here like this we can look for parse row, and there's that.
And we're spending about 300 - about 3 milliseconds on this, not super, super long, but we're calling a bunch of times.
Okay, so it turns out that this program's a little hard to understand because it's not doing that much.
This is actually an easier job for complex, involved applications I find a lot of times because it's pretty clear where it's spending time.
This one, it's actually really quick.
But we're still going to analyze it, don't worry.
I just want to sort of give you the sense that actually this, even though it's a simple example, it's kind of hard to understand the performance.
If you want to just run the whole thing and see how it works, here you go.
Just run cProfile, sort by something, give a domain script to run, off you go.
This is one way, but notice when we did this there's all sorts of stuff in here that's irrelevant to us.
For example, initializing the typing module.
I don't care, we can't control that, that's just something we're doing to define some definitions.
You could say 'don't use typing' and that's an option, but can you hide that?
Does importlib bootstrap find and load?
These things, loading the module, we're spending significant time here.
We can't control that.
So what we want to do is we want to measure the parts that we can really carefully work with and control.
So we're going to see how to do that using the API from within Python and we'll get better answers here.
|
|
|
show
|
1:51 |
Now one takeaway from this here is that we're actually spending a ton of startup time and other things.
And depending on how your code is working, if it's intended to be called over and over again, this is very common if you use like a web app, and you start it and every time somebody hits this page, some stuff is going to happen over and over.
You might not want to measure the start up time so much as steady state time.
So let's do one real quick thing before we actually get fully to the CPython API.
Let's just run this a lot.
So, then here we have this main.
Let's just run main like 100 times, or 50 times, or something like that.
And measure that.
That will get rid of some of the variation.
It'll definitely suppress some of the module Python startup times.
So we'll just say this.
Let's do it 25 times.
Now we're here and we'll run the same thing.
Once again, but it'll take a little bit longer.
Still, not long, right?
But you can see, it's going over and over again it's doing this little printout here.
So now if we look over here, here's our main, spending a little bit of time there.
Doing our research initialization, we're spending a decent amount of time in parse row.
Over here, these are cumulative times.
So, like, for example, we're spending 210 milliseconds in module load, but now we're spending 180 milliseconds in main.
That may be totally fast enough, maybe not.
On the Talk Python Training website, we try to get things down to 10 milliseconds, 20 milliseconds.
Some of the pages that are really complicated, you know, there's a lot going on.
It's like 50 milliseconds.
But you certainly want to try to get that number down.
I think if this was a web app, that number would be too high.
Of course it's not, but what we're going to do is we're going to look at what we're doing here and at first try to understand why this is happening and how we can make it faster.
|
|
|
show
|
3:22 |
Alright, let's go back to our code here and we're going to do a little bit of work with the API.
So what we can do, is we can come up here and say we're going to try to, as much as possible, ignore the start up time and all those kinds of things and we just want to measure all our important code.
So what we're going to do is import cProfile and this is not great, but, before we even try to go and import this we're going to create a profiler and disable further profiling.
So we'll go like so.
There we go, we're going to say profiler disable and probably we'll just actually take this code out once we're done playing around with it, 'cause, you know, these are supposed to go to the top.
But I don't want to time that stuff.
We're going to say, disable.
What we want to do is we want to time this method, I want to time this one, and this one, and we're just going to straight up time it at first and then we're going to reorganize it so we get a better look at it here.
Alright so let's go to our profiler and say enable.
And then as soon as we're done down here, we'll go down and say profiler disable.
Okay.
Now if we run this are we going to see some great profiler output?
Eh, probably not, let's try.
Well we ran it 25 times, that was cool.
But nah, where'd our stats go?
None.
Okay, so what we actually need to do down here at the end is say profiler.printstats and this will give us basically the same graph as we had before.
There it is.
Now, of course, it's sorting by heck I don't actually know what it's sorting by.
But not what we want.
So we come down here and say sort.
Now this is annoying, I guess I'll say it that way.
It says the sort is an integer and its default value is -1.
Do you know what you put here?
Cumtime as a string.
Yeah let's go ahead and tell PyCharm that's spelled correctly.
That's what it is, that's how it works.
Okay, so down here, now you can see the cumulative time is descending.
It looks like we're sorting correctly there.
We've had 115,000 function calls.
That's non-trivial, apparently.
Look at this, look how much cleaner and realistic this looks.
Alright, we're spending time in research and net, and parse row, this is kind of the whole startup time bit.
This next stuff, this is definitely in there.
We're spending some time in sorted.
That's pretty cool.
And here we have our three, our hot days, wet days, and cold days.
Okay, that's pretty cool, and then here you can see some of these lambdas, or our sort functions that we're passing along in research, and so on.
So this gives us a much more clean and pure view of what's going on here.
Let's actually crank this up to 100.
Just to make it stand out a little bit more.
Here we go.
So now we're spending a decent amount of time in these places, and here we're spending like, not quite 20 milliseconds in the three, data reporting sections.
Okay this is all well and good and these numbers right here, the stuff I've highlighted, is great.
However, this method here, it's kind of hiding, this main, where's main?
Main's not showing up because we didn't, we didn't call it directly, we basically disabled profiling but there's still some stuff going on here like this looping, and this numarray and this string formatting, all this junk is still being profiled.
We're going to use the API to clean that up as well.
|
|
|
show
|
3:53 |
Now we're turning off the profile until we get to our code.
Run this little bit and then we disable it again.
Right up here we have profile enable and we have profile disable.
But there's still a lot of reporting stuff and do you really care how fast the thing prints out?
Like, it's print to the console, you really can't control that.
That's not the essence.
So let's just reorganize this code, refactor it so that we can group the analytics and the data bits of it and then we'll move on.
Okay, so let's come over here and we'll say we'll get those days and get those days and those days.
Now clearly, there's a problem here.
We can't just keep calling the days like we were.
So, we've have to call this hot days, cold days, and wet days.
And we got to replace in that here, hot days, cold days, and wet days.
Okay, so now we can take this profile bit and disable it way sooner, like this.
So here we can do a little bit of work in this block of code here and only profile that.
Let's run this one more time.
All right now, how things are looking.
Okay, that looks even a little bit cleaner.
They didn't change the numbers for this obviously because that's outside of what we were doing, and it wouldn't change this either, right.
But it does clean things up just a little bit.
Let's look at what is the worst case scenario here.
Well there's init right here, this is obviously the worst function.
It's at the top.
But let's go look at it.
It's doing this line right here.
Chances are we can't really do any better than that.
It turns out that we can call it less often, that's one thing we could try to do is check and see if it's already been initialized, then don't do it, that's actually a massive, massive performance gain, but let's make what we already have faster before we add that.
Over here, we're basically parsing the row and we're pinning the data.
Remember parsing row down here actually does all sorts of conversions and then assigns it to this record and so on.
So, there's this init, but really the thing that is the problem here, this parse row that we're calling 36,135 times.
That is a ton of times that we're calling this.
Can we make it faster?
Answer is, probably, yes, yes we can.
How can we do that?
One thing we could realize is, it's really this all this conversion these are taking strings and converting them to integers, the dictionary read and write is like crazy fast.
So, you could look at that and figure this out, but it, that's not really the problem, the problem is the string conversion to numbers ints and floats.
And then also this, we're allocating this record and we're signing well over however elements there are in this named tuple and we're giving it back.
What can we do here to make this faster?
Well it turns out, if you look at the way our program works, first up here that we're working with actual max temperature, actual precipitaion, and over in the programming we're working with actual min temp and we should have been sorting by min temp here as well.
Okay, so minor little bug, but really highs on a cold day are pretty close to the lows as well.
Alright so we're working with these three values, max temp, min temp, and precipitation.
If you look at the little reports we're running we're also working with date, nothing else.
However, just for completeness sake, we said we're going to convert everything, we're going to convert the mean temperature, the record temperature, the average temperature, you name it we're converting that.
Well if we know our program isn't actually going to touch those pieces of data let's not do that.
So let's see what we can do about improving performance by reducing some of the data we're working with here.
|
|
|
show
|
6:19 |
We saw this parse row is where we're spending most of the time in the code that we wrote, that we're actually interacting with.
We're also, just for completeness' sake, taking every element of this file and converting it, and storing it and working with it.
But what we've learned is that our program actually only uses four fields; three of which we're converting.
Why do we need to convert all the others, right?
If we're never going to look at the average min temperature, why do we need to convert it?
Now, this is not something you want to start with, 'cause this could cause all sorts of problems, but once you know the data you're working with and how you're going to use it, you probably want to come along here and say, well, actual mean temp, don't use that, actual min and max, those we are, these averages are out, these records are out, we're down to average precipitation, and those.
So now we're down to just these three.
So this is going to be faster.
However, we're still creating this record which stores 12 values, and we're sort of passing them all along here.
Let's do a little bit better.
What do we want, we want a date, actual, not actual mean, so we can not even put them into our data structure.
Take out actual mean, put our min, our max, a bunch of average stuff we're not using, actual precipitation, and that's it.
So we have one, two, three, four, those are our four values.
Now this trick is not going to work anymore because there's more data in the dictionary than it accepts.
Okay, so we got to go back and do this a little more manual now.
So we're going to say row.get date, and we'll just do this for each one.
Okay.
A little bit more verbose, but we're only storing the four values, we're only getting them from the dictionary, initializing them, all that kind of stuff.
Now let's just look really quickly here at how long we spend on these two.
I'll put these into a comment right up here.
Alright let's run it and see if that makes any difference.
It's so fast, really, that you probably wouldn't actually visually tell but like I said, if you can take it down from 300, what are we looking at here?
We're looking at quite a bit here, 750, this is the one that probably matters.
350 milliseconds, that is a lot of time.
What if it's something interactive in real time, like a webapp for example.
Let's try again.
Now look at this.
This part actually stepped up and got in the way of this.
It used to be those were next to each other, and why?
'Cause that got way, way better.
So let's go down here and print this out.
I'm going to delete this CSV row, there's not a lot we can do about that for the moment.
Look at this; 350 to 159.
That's more than 50% reduction, just by looking at the way we're creating or reading our data, and working like this, right?
We don't need to load and parse that other data.
We could actually go and simplify our original data source, really, but that probably doesn't make a lot of sense.
This is probably the way to do it.
So we used profiling to say, well, this function is where we're spending so much time.
If we look at the other ones, look at the part where our code is running, this next and sorted, like this stuff we don't control, these are the other important ones, but they're like 20 milliseconds for 100, so that's one fifth of one millisecond?
.21?
.21 milliseconds?
That's fast enough, alright?
We probably just don't care to optimize that any faster, and you know, we look at that code, we look at that code down here, like, you could try some stuff to try to make it faster, right, we could maybe store our data re-sorted based on some condition, right, like we pre-sort this on the max, maybe it's less sorting for the min, you know certainly this one would be crazy fast, how much better can we make it, right?
If it's .2 milliseconds and we make it .18 milliseconds, no one's going to know.
Especially when you look at the fact that there's a total of 600 milliseconds in this whole experience, so really, this is probably as good as it's going to get.
The other thing we can do, the final thing we can do, and just notice that we're still spending a very large portion, five sixths out of that, whatever that is, a very large portion of our time in this init function.
Because we happen to be calling it over and over.
So now that we've got it's individual run at about as good as we're going to get, let's just add one more thing.
Super simple, like, hey, have you already initialized it?
We're just going to keep the data, it's unlikely to have changed since then.
Now we run it, and we get different answers still.
It's now down to these three that are the actual slow ones.
But like I said, I don't think we can optimize that any faster.
Here's the research.init, and that's six milliseconds.
I don't think we can do better than that.
We're loading a pretty large text file and parsing it; six milliseconds, we're going to be happy with that.
So you can see how we went through this process of iteration with profiling, to actually come to make our code much, much faster.
It used to take almost half a second, now it takes 55 milliseconds.
And that's actually to call it, how many times did we call it, 100 times, is that what I said?
Yeah, so in the end we're sort of running the whole program 100 times and we've got it down to 55 milliseconds.
Less than one millisecond to run that whole analysis; load that file, do that, and so on.
That's not quite right because we're only technically loading parts of the file once, and caching that, right, but you can see how we go through this process to really look at where our code is slow, think about why it's slow, and whether or not we can change it.
Sometimes we could, parse row, other times, hot days, cold days, wet days, we're kind of there, like, there's not a whole lot more we can do.
If we want that to be faster, maybe we have to pre-compute those and store them, like, basically cache the result of that cold days list and so on.
But that's, that adds a bunch of complexity and it's just not worth it here.
|
|
|
show
|
3:03 |
Alright, so all of this was really useful and helpful and I think we did a lot of good stuff with it, but this text view, while it is technically helpful, you really can do better.
In this simple program, what I'm going to show you doesn't come out really that great because there's so much overhead, like I said, a sort of programmed start-up and stuff.
But in a real complex application, you would really be able to make great use of what I'm going to show you.
So, we saw that we can come over here and run the profiler externally like this.
And that works fine, or we can even use the API internally.
Let me show you one other option.
Now for this to work, we need to go back, we need to take a bit of a step back into this mode here where we're running the profiler from the command line.
Just the whole program basically.
So let's drop in this program PyCharm bit.
Let's drop this enabling and disabling and printing and we can still leave everything else the same.
But we're going to take away the profiler API internally.
And we're going to run this just like normal, and it runs.
There's no output that is anything special.
But once you have a run configuration-- now this is only for those of you who care about PyCharm and have the Pro Edition.
If you're using something else like Visual Studio Code or something, you're going to have to do what we've already seen, alright?
There are ways to implement these tools outside of PyCharm, but this is pretty nice.
Once we create this, we can run it here but if you go over there, it'll say profile that.
We click it, wait a second.
First of all, if you look up at the top, way at the top, it is running the cProfiler.
And this list here is the list that you already saw.
But we can click on, say 'time' and see, here's main, here's the research py stuff we're doing, here's the Hot Days, all that kind of stuff.
Here's the init that we're calling.
Same thing, but you can quickly jump around.
You can even say, "Show this on the call graph." Well, of course, you see it right there.
This is a visualization of that result.
Let me come down here and zoom in, this will become useful.
Notice, here's our program, it's calling main, it's calling "Hot Days, Wet Days, Cold Days." These are pretty quick.
Now we're calling this "Init." We're calling this one 99 times, but we're only going through the parse row 365 times.
Remember, that's one year's worth of data, 365 rows, so even though we call this 99 times, we're not actually parsing it 99 times, we're just doing that for one round through the file.
So here you can see where you're spending your time.
You can actually visually go through it.
Like I said, in a real app, this is actually more helpful because the overall program start-up is not so significantly shown in the graph.
It's where your app's doing most of its work.
This is so simple that it kind of gets lost in the noise, but this graphical view is really, really nice as well.
|
|
|
show
|
1:37 |
Let's review some of the concepts around measuring performance with profiling and Python's cProfile module.
Now from any project, regardless of your editor, if you just want to measure the overall performance of your app, this is probably the best thing you can do.
Python -m cProfile, so run Python, make sure that's the right version.
Instruct it to run the module cProfile, capital P, and while you're at it, the most useful one is sorting by cumtime.
So do a -S, cumtime and then give it to a entry point into your Python program to run.
Here program notqi, and you automatically get that nice output that you can start working with it, iterating on.
One, to run just a section of code there's two options, there's one I'm showing you here and you could also create a unit test that just run that code and then run the unit test with profiling.
But we're going to focus on the more general case here.
So what you do is you import the profiler, and tell it to start up disabled stop tracking anything, just import yourself and go from there.
Run whatever startup code you got to do to get into the state you want to profile, and then enable profiling, run your code and go back and disable it.
And in our example you saw we actually moved the reporting outside of this block and the data generation within it so that we could measure really precisely just the part we were working on.
Some other stuff here at the end you probably don't care about.
And at some point you want to see the stats so you'll say, profiler.print_stats.
|
|
|
show
|
1:59 |
Now, before I turn you loose to go work on the code on your own and do your own profiling, I want to give you a short warning.
It's not a major warning, but there is an effect you really need to be aware of.
There's some parallels here with quantum mechanics; in quantum mechanics we have Heisenberg's uncertainty principle where it talks about the more precisely you know the position of something, the less precisely you can tell its speed and momentum.
So, by measuring one thing really closely you have actually weakened your understanding of the other.
And profilers are like this as well.
You have your code operating one way and you measure it really deeply, actually put tons of hooks into it to do this monitoring or porting with cProfile and it might actually change the performance of your code.
So, when you look at those numbers, like for example we said our program takes 610 milliseconds to run.
Maybe it only takes 400 milliseconds to run, but with profiling it takes 600 and these effects are not evenly distributed.
It's not like, "Well, the whole program slows down 20%." No.
Some of it is barely affected.
Some of it's massively affected and I would say a general rule is: the more things you do in small pieces, that's affected more.
The stuff that's kind of pushed into the standard library, it doesn't have it's hooks in there.
So, for example that parse row loop looping over every row in CSV probably has some affect where as the sort, that's one line measured and then it's handed off to CPython and then it's time when it's back.
So, there might be a ton of operations in there but they're not measured.
So, just be aware this Heisenberg uncertainty principle going on with profilers also somewhat applies to debuggers.
So, they kind of both apply here but in this context we're concerned about profilers and timing and it really can have a big affect.
That said, these profilers are massively helpful and much better than your intuition on understanding where your code's slow and how you should optimize it.
|
|
|
show
|
0:46 |
You've seen how profiling can make your application faster.
It turns you into a detective, hunting for performance problems in your application.
Now, it's your turn to work on your applications using the cProfile and the techniques that you've learned here.
We're going to start on Day 1 by just watching these videos, of course, and then picking an application that you're going to optimize.
Pick some app that you've previously built.
At this point in the course you should have built many little applications.
You can totally pick one of those.
Or if you've built something outside the course, use that.
That's all fine, as long as it's the Python app, this should work just fine.
So for today just think about the app that you want to work with, that you want to try to profile and understand the performance, and we're going to work on the next two days on making it faster.
|
|
|
show
|
0:58 |
Second day, you've already chosen your application.
So what we're going to do is we're going to use c profile or if you're using PyCharm Pro, you can use the visual profiling tools there, as well.
Understand your applications performance.
So run the cProfile module against your app.
You can either use the api for very fine-grained stuff or just run it against your entire application like we saw in the command line.
Sort probably by cumulative time, cumtime.
That'll make it much easier to understand actually where it's slow.
So you're job for today is to use cProfile to find the five slowest methods in your application.
Write them down, make a little chart, put them in a text file, something like that.
And be sure to include the millisecond times that were recorded.
That way when you try to improve it on the next day you could actually see if that's an improvement or maybe even makes it worse.
So just go through, do a little bit of detective work and find the five slowest methods that you control, that you might be able to change.
|
|
|
show
|
0:58 |
Third day, it's time to improve the performance of your application.
You've chosen it.
You've gone through and found out where it's slow.
So what you're going to do is focus one by one on the five slow functions and try to make it faster.
Look at it, try to understand where it's slow, and if you can change something about the way that it works, right, in our example we said, well, we're parsing the CSV and we're actually converting 12 columns of data and actually we're only using four.
Let's just throw away the other eight columns because we're never using them, and that conversion is entirely wasteful.
We'll look for things like that.
Go through each one of the five functions, change 'em one at a time, rerun the profiler compared against your times from the previous day, and if it gets better, keep that change.
If it actually gets slower, forget it.
Just leave it alone or try something different.
All right, that's it.
So now you should have an app that's faster.
Hopefully, much faster than it was before and you now have this new skill with profiling to understand the performance of Python applications.
|
|
|
|
17:57 |
|
|
show
|
0:34 |
Good day everyone, I'm Julian Sequeira.
Welcome back and this time we're going to look at Feedparser.
This is a library that is really cool and I absolutely love it.
I use it in a few scripts and it's actually designed to parse RSS feeds.
Go figure.
It's really, really fun to use, very simple, very satisfying.
So let's move on to the first video and what we're going to do is first we're going to pull down an XML file in our RSS feed.
And in the next video after that, we're then going to parse it.
Really simple and quick.
Let's get to it!
|
|
|
show
|
1:47 |
Okay, very quick setup for this project, we're going to create the feedparser folder, just like I have, and we're going to install our virtual environment, very good practice as always.
Once it's up and running, we can launch it, venv\scripts\activate, it because I'm a Windows junkie, alright, now we can install feedparser, alright, that might take a minute or two to install, depending on your speed, and everything.
Once that's done, we will try and install requests, and that's pretty much all we need for this project.
After that, we're going, we're actually going to use requests to pull down the XML file, and then use feedparser to parse the XML feed, so install requests.
Alright, off it goes, and we are done, now folder-wise, inside your directory, I would like you to create two Python files, one called parser.py, and one called pull_xml.py.
Okay, just do that, empty files, and we will continue in the next video.
|
|
|
show
|
1:16 |
Okay, let's get cracking.
First thing we need to do is import requests, sorry.
import requests.
Now I know you probably know how to use requests so I'm not going over this too much.
But what I'd like you to do is enter the URL of your feed.
Now to get that for example, we're going to be pulling the new releases XML feed from Steam.
Stored up, steam powered.
Okay, all I've done to get that is just Google "Steam Feed." Came up here, I just grab the first one and there was a link on the website for their RSS feed.
Okay, this is the news one, but we're actually going to use the new releases for the video games.
So you can feel free to grab whatever you want and once you do that, just pop the URL into here and assign it to URL.
So there's mine there.
Next, we're just going to use our standard Python and dunder there.
Okay, and then what we're going to do is we're going to requests.get.
So, essentially, we're going to get that URL and we're going to store it or we're going to assign it to the r variable.
Okay, and then we're actually going to write the contents of this file, of this XML feed, this that you're pulling down, we're going to write that down to an XML file.
Okay, so to do that, just going to do it the old fashioned way.
We're going to open a file, let's just call it newreleases.
Just like the actual XML.
We're just going to write binary and we're going to open it as f.
And I'm using that with Statement as usual just to make sure it closes out right when it's done.
So, we're going to write r.content.
I'm not explaining this in detail because you would have experienced requests by now, so that should be nice and familiar.
But this is necessary to pull down the file.
Alright, so we save that, that's all we need.
Now, head over here to your shell.
Woops, we don't actually want to launch the shell, We want to go Python pull_xml.py.
Alright, that completed.
Now, if we bring up our folder here, or everything that's inside, you will have seen it's created in newreleases XML file.
Alright, that's it there.
Now, we'll open that file in explorer.
Where are we?
Open, let's just choose, okay, don't hate me.
Let's just choose internet explorer.
So, now that this is open, you can have a good look at what's inside this XML file.
Pay attention, maybe while you're doing this for yours, just open this, your XML feed in a browser or in your favorite editor, just so you can have a look at these little tags here.
So pay attention to that, we'll talk about them in the next video.
|
|
|
show
|
3:12 |
Okay, we have our xml feed downloaded and saved, and now we're going to actually parse it with feedparser.
So, what we need to do is import feedparser.
Okay, and that's half the work done.
No, I'm just kidding.
What we want to do now is we need to actually tell feedparser what file it's going to be passing.
Now, you could actually use the url, okay.
You could use the url from, directly, but the problem with that is, is that it requires the internet connection, and if it can't get that, it's going to fail.
So, it's actually better from and application standpoint to download the parse, the feedparser, sorry the feed, and then parse it using a separate script.
That's why we've done it in two different scripts.
We could have done it in one just by telling feedparser to point directly to the url, but we're going to do it parsing a local file.
Okay, so feedfile is a newreleases.xml.
So, the same file that we just downloaded and saved.
Okay, now what do we want to do?
We want to actually parse that file, alright?
And that's an argument for feedparser.
So, we're going to parse it and store it in the feed variable.
Okay, so feedparser.parse.
Now, it's as the name implies, right?
It's going to just parse over the file, and store all of those contents inside the feed variable.
Okay?
Now, if we bring up our xml file.
Where have you gone?
Let's open it here, open it again in internet explorer.
Don't hate me, let's make it a little bit bigger.
Okay, so what we notice here is that, we can see it's staggered out, it's xml.
We've all seen that before, but it's pretty much, once it's loaded into feed, it becomes a sort of dictionary, okay?
With your title, your link, your description, and these are the sort of keys that we want to pull out.
Okay, and by doing that, so to do that we actually use these tags.
Okay, and that's what feedparser does.
It parses, and let's you pull data based on these tags.
Alright, so you'll see that.
Here's what we'll do, so this is the...
what I think we should try getting is the title.
So, we want the title of the feed, the feed entry.
So, Midweek Madness, Dragon's Dogma, blah blah blah.
That's what we want to pull.
We also want the published date.
Okay, now most xml feeds, or most rss feeds should have this.
Some don't, but we'll get to that in a minute.
So, we want the publication date, alright?
So we know what date.
And then I think we should get the link as well, because we would like to get the url for this deal, or this new game launch, or whatever it is.
Alright, so we go back to our file here, to our script, and we will go.
We're going to use a for loop to parse over this data, okay?
So, we're going to go for entry in feed, that's this, in feed.entries.
Okay, that's why I've said for entry.
So, for every entry within all of the entries within feed.
What are we going to do?
Well, we're going to print something.
So, this is just for the sake of this script.
So, we're going to print entry.published, so even though I will point this out, this one got me at the start.
Even though it says pub date here, that is not actually what feedparser gets.
That's actually called published from the feedparser standpoint.
So, entry.published.
Just going to use some standard string stuff here, so bare with me, then we're going to choose the title.
So, imagine this as you're writing it.
The date, and then the title, alright?
So, for entry.title, throw in a colon there, and what's next?
entry.link So, all we're doing is we're printing out the date, the title, and then the link for that, and that's it.
Okay, nice and simple, and you won't believe me, but that's it.
Okay, so it's pretty simple.
So, we'll go Python parser.py, and that's it.
Let's maximize this, so look at that.
We have the date, Friday the 5th of January, 2018.
At that time, watch live on Steam, Paladins World Championships, and then, we have the url.
How simple is that?
We've parsed this entire feed, ignored all the extra stuff in there that doesn't matter, and we've taken just these titles, with the date, and the url.
Very, very...
|
|
|
show
|
5:24 |
Okay, one last little thing for you which is a bit of a best practice as always with Python scripts, you would normally put in some sort of an error check, just to make sure or a conditional check, just to make sure everything is in place before you run your script, right.
So in this case, what happens if one of these tags doesn't exist in the feed?
Well, sometimes these RSS feeds out there don't always include the default tags, like title and link or description or whatever else, okay, if that happens well then your script's going to break.
So you should try and capture those errors but right now, I'm not going to walk you through error catching and testing and trying except and everything that's another module in itself, right.
So what I will show is just a really quick, if statement that just works, okay.
So you could do if and then your tag name, now I would definitely insist on title being in there, so if title in feed.entries, we're looking at the first item in feed.entries there.
Then we want you to run the full loop and that's it, okay, that's all I'm looking at now then you can put ls break or something like that or you could run your try and except and what if you want to wrap around it.
But in this case, that's all we need, so we can save that and then we can run that, so Python and we'll get the same output as last time.
Okay, we can go and see all of that data now just to prove that this actually worked, here's what we can do, let's clear and let's change the actual tag we're looking for.
So let's come up with something that's definitely not going to be in there.
Let's see if I can spell, so that should be in every feed right but unfortunately not so if Julian rocks in feed.entries then run your forward.
Okay, let's run that and bang, nothing happened, let's put title back in and there we have it, okay, so that's it if you want to do some sort of testing against it before you run it, well that's the way to do it.
Okay, and that's pretty much feed parser nice and simple.
|
|
|
show
|
2:44 |
And that's it, I told you it was simple.
So Feedparser is awesome.
A very, very simple and small lightweight thing to use but really helps you out if you want to automate things like feeds.
So, let's just recap quickly what we did without going into too much detail.
We import requests and this is for pulling down the XML feed.
Okay.
Specify the feed that we want to pull down, okay.
We actually get the feed using that URL and we store it in r.
Okay.
We then open a file, you can call this whatever you want, and then we write the contents of that XML file, that feed, into the file that you specified there, okay.
Simple.
And now, onto the Feedparser stuff.
So obviously the first thing we do is import feedparser.
Okay.
Then we specify that actual file that we created in the last step.
Okay, remember we separated these two processes of pulling the file and then parsing it just in case you had a scenario where, let's say you couldn't pull the file.
Well, if you couldn't pull it, at least you have an existing file and you can continue parsing that.
The whole thing doesn't fall over, alright.
Now we parse it using feedparser.parse and throw that into the feed, all right.
And then we have the little sanity check there to make sure the feed is okay to parse, that it has that title tag that we want and that we did necessary again.
You can wrap some sort of a try except or whatever you know, error checking you want around that.
Then for every entry within that feed we're going to take the data stored against publish in the publish tag, in the title tag and the link tag and then we're going to print that in a nice little string and that's it, okay.
Now, very exciting.
It's your turn.
So for the next day I would like you, instead of printing out that data, so in the previous step you saw we printed out the publish, the title and the link.
Instead of printing it out, why not do something interesting with it?
What can you think that you might be able to do with it?
So just some ideas, maybe you could e-mail that data which is exactly what I'm doing with this steam stuff.
That's the script I'm running.
You could e-mail that to yourself.
You could potentially store it in a database.
There's a nice little challenge for you.
You figure out a way to store that data in a database.
Or you could just think of something else.
Anything you can think of, any other libraries that you could use to do something interesting with that.
Come up with it, try your own feed and have fun with it and go parse those feeds.
|
|
|
show
|
3:00 |
First things first, let's go through the ReadMe file.
Quick word of warning, feedparser is a very very quick topic.
As you can see by this stuff on your screen, this is not going to take you very long.
And yeah, reality is, that's what feedparser is.
It's just that simple, that it's quick to learn.
So Day 1, you are going to pretty much do everything.
You're going to watch the videos, set up your environment, pull the feed and then parse it.
Okay, so it'll involve using requests.
Day 2, I'm going to show you how to do a quick, sort of tricky sanity check when parsing your feed.
So, watch the Feedparses and the Check video and then that's pretty much everything you need to know by that point.
So, I'd like you to pull and parse an RSS feed of your choice.
A bit of practice for you on Day 2.
Now on Day 3, just wrap it up by watching the concepts video and then I want you to come up with something to do with the data you're pulling from feedparser, okay.
So, again, the usual stuff is there, like store it in the database or email it out.
Build some sort of application around it, but I like the idea of maybe letting the user specify from a list what RSS tags they want to pull down, okay.
So, that could be a cool little project.
So, day three is just testing it.
Playing it around, seeing how you go, but that's the three days for feedparser.
They're going to be very quick and very small in size, but enjoy them nonetheless.
|
|
|
|
32:25 |
|
|
show
|
1:09 |
Recall way back when we worked on the search API, consuming the search API, and we were using requests to interact with HTTP services.
That worked pretty well, but it turns out if you're working with complex APIs, and they're very structured, they want you to do things like pass certain headers, some things go into query parameters, others go into a JSON body, and it's this sort of rich, known, fixed API, you may well be better off using this thing called Uplink.
And that's what we're going to focus on now.
Instead of consuming HTTP services in an ad hoc fashion, we're going to use the Uplink library to create very structured and predictable APIs.
So once you implement it, you kind of forget that it's there, and you just treat it like another part of Python.
So, Uplink is a really great API for building what here they describe as declarative http clients.
So instead of implementing all the details, you just say, "I want to do a get request against this URL with these variables and parameters, and Uplink, make that happen.
Make this all work for us."
|
|
|
show
|
2:07 |
Now, before we go and write this, I want to give you a quick glimpse at how we define API's with Uplink.
Just so you know, where we're going, and what we're working with.
So here is a, API, a structured API, granted, it only has one method we could implement many others, That consumes the GitHub API.
Now, there's a couple of interesting things here.
First of all, we have this function called list_repos.
If you look at its implementation, it's empty.
It's literally just a string, that says, get the users public repository.
This is the docstring so you get a little help about it.
Technically you could just put the word, pass.
You don't actually have to write this function, you use the signature of the function to let Uplink hook into the API.
Notice there's an at get decorator, it has user /{user}/repos, and that {user}, anything that goes in the curly's, that actually becomes an argument.
So if we call this function, list_repos, and we say user equals 772, that's going to go into that URL, and that's what the path annotation indicates here.
There's also a sort_by, notice its a query.
This is really cool, so the URL will actually be users, slash, whatever you pass for users, slash repos, question mark, sort equals the value of sort_by.
So, stars for example, something like that.
So, this way we'd basically declare or imitate our ways we're going to access the service, and it's almost entirely up to Uplink to make this happen.
Now, to use it is crazy simple.
So we're going to come down here and we just create an, instance of this class, pass the URL.
We could hard code that in and we will in our example.
Then you just call it, gitHub.list_repos, and you pass in say, octocat, that's the username, and sort by its creted here, and you get the repos back, look at this.
So, really, really nice way to create structured API's that let you work with headers, body, query strings, the particular URL's and not actually have to juggle all those details.
So, that's what we're going to build for an API that we haven't even talked about yet.
So, let's get to that.
|
|
|
show
|
1:01 |
Now, let me just put one final warning out there before we jump into building these API's with Uplink.
Uplink is great for creating structured clients against HTTP services, works really, really well.
However, if the API you're working with already has a Python implementation, use that.
It's likely implemented and maintained by the company that actually controls the API.
It'll continually be upgraded, and so on.
So, for example, over here at Stripe, they have an API.
We could use Uplink to build our very own client to talk to it.
But, we can just pip install stripe, and they'll maintain that and upgrade that over time, and we don't have to worry about it.
So, Uplink really fits in the place where you have this structured API you want to work with, however, it doesn't have like an official PyPI package that is the API wrapper.
Which there are many, many of those of course, but first check and see if there's something from the company or organization to already access that API and use that, but if not, Uplink, that's where we're goin'.
|
|
|
show
|
3:08 |
Alright, here we are in our GitHub Repo.
In the Uplink directory, we're going to quickly create a virtual environment.
We're going to want to install some third party packages, namely uplink and all of its dependencies.
So, you want to have this here, so you don't mess with the global one.
Now that that's done, we can just drop this into PyCharm, open it however you like.
Alright, it's open, there's no files, we're starting from an entirely blank project.
So let's do two things, let's go over here and add a program and let's add a requirements.txt.
So, in order to work with Uplink, it probably won't surprise you to know, you have to install Uplink.
So we'll come over here and say uplink.
Now, we're going to install this, however, let's quickly look at the Uplink documentation.
So, you can see it's really targeting all the versions of Python, great code coverage, really nice, however, there is this sort of note here: warning, until this becomes an official version one, maybe don't depend on the exact stability of the API.
Chances are, what we're doing is really pretty basic and won't change, but I'll show you how we can hedge for that in a second.
So let's go over here.
Install our requirements, and notice, we got Uplink 0.4.0 and we can actually...
This will go away in a second.
We can come over here and say this is actually == to this.
And when we do this, it should still just say: "No, no we're all good, everything's installed." That way, when you get this project, you can put this and it won't change.
In case that API really is unstable, this will let you work with exactly what we're using for this video.
Now this little green here is just PyCharm saying this is misspelled.
We can just save it, tell it no, leave us alone.
Okay, so we are ready, actually to write some code.
And let's just put a little bit of structure in place.
What we're going to do it we're going to work with a blog service.
So, imagine this is a program that lets us edit our own blog, but not from the web.
We're going to log into our application here and we can say view our existing post, edit our post, we can create new posts, really kind of a toy example but, it has much of the RESTful components that any API would have.
So, it accepts POST, PUT, DELETE, the various verbs and JSON bodies, and other types of interesting things, authentication and headers, and it'll let you play around with many of the capabilities without getting into a really super complicated service.
So let's just write the skeleton here and then we'll go check out the service.
Alright, so I'm going to just copy something in and it's just going to like this.
So, what we're going to do, is we're going to define basically a couple of operations here.
We'll use this one first.
So we're going to have a main method and it's just going to go around and around as long as you don't enter a blank line, it's going to ask you, would you like to write a post?
Or, read the existing ones?
The service starts out with some already there.
And then it just says each time through, do they say write, do they say read, if not exit.
We're going to fill this out with the implementation of talking to the API.
|
|
|
show
|
1:40 |
Over here at consumer_services_api.talkpython.fm, we have at least three services that you can play with.
So this is the backend for the blog, and it gives you the operations right here.
So you can get, and it'll list, if you just do a getting into this, it will give you all of the blog posts.
If you do a get against that, some particular id, you'll get the details only about that blog post.
Create a new one you do an HTTP POST.
To update one you do a PUT, and to actually remove one you do a DELETE against these particular URL's here.
So this can be totally done with requests, but it's a lot of juggling the pieces.
And if you use the restricted version, then you've got to use the authentication settings that actually go into the headers and stuff like that.
There's also this kind of crazy SOAP version, we're going to stay away from that.
So, we're just going to focus with this one here, but if you wanted to get more interesting stuff going on, you could actually use like basic authentication with those, and so on.
So if we look here, and you'll see we have a list, and then just blog post, blog post, blog post.
Now these are not super interesting here, right?
They're just title, content, view count, id, which is kind of like a primary key, and then the date it was published, okay?
They're not advanced, but it's plenty for us to play with.
Right, so we're going to use this URL, and I would just leave this open, we might come back in and refer to these as we build out our service here.
You guys can play with this, you can update and delete posts however you want.
Actually, it's each person that comes and works with the service gets their own copy.
So don't worry you're not going to mess it up for someone, have fun with it.
|
|
|
show
|
4:22 |
So here's our skeleton of our app, let's go ahead and start by defining the client for the service we're going to use over in a separate class file, so we'll call this blog_client, something like that, actually, call it like this, and then create the class as BlogClient.
You just entered Python class, we talked about this in the text game, where we built our wizard and dragon and stuff.
The way Uplink works is, of course we're going to import uplink, and then, we need to derive from this thing called an uplink.Consumer.
Now this will tell Uplink it's going to work with our particular methods.
However, we still need to do a few things.
We need to define the operations that we're going to see, and then have those map to the service.
So let's go over here and define a method, just all_posts.
It doesn't take any argument, it's just going to go up there and download them, that's what we saw when we clicked right here.
Now notice the whole URL is like so, and then, for the various pieces, the part that changes as you know, basically this little end part, okay, so we can actually go and say this, we can say define it dunder init, and we can set that at one place so we can say super.__init__, so this is going to pass this information off to the Uplink consumer, notice there's the base_url, so we'll say base_url is, alright so we don't have to say that anywhere.
Down here we can say what we're going to do, this is actually going to be an HTTP GET, let's just put the details really quick here, so, the way that works is we put a little docstring here that just says gets all posts, called blog_entries.
I know they're typically called posts, but the word, let's just call all_entries.
We're going to use HTTP verbs, GET POST and so on, and that's, you know, nomenclature can be challenging there.
So we've got this, now this is not going to do anything for us right, it's just going to return nothing basically, but what we can do down here is we can say add uplink.get, and this tells it convert this to some sort of method that's going to go to the server and it's just going to be, let's take that part off there, and say api/blog.
This is literally all we have to do.
So, we're ready to use this thing.
Let's come over here and just test it out on one and then we'll look at some more interesting pieces, so I'm not going to go and write a lot of code here to make a print out, I'm just going to show you that it works.
So let's come over here and we'll say response equals, actually we'll have to create our client say svc equals blog_client like that, import at the top, and then we'll say svc.all_entries, let's just say what is this, and let's just say what value does it have?
Okay, so let's run this and see if any of it works.
What went wrong?
Well, I forgot one little detail, we need to call main.
Let's read our posts.
Oh my goodness, look at this, we got a response from the server 200, everything is A okay, and it's actually a requests response, now it turns out you can use other underlying network providers other than requests, but if you don't do anything, that's what you get, so requests is pretty cool, we already talked about that previously, that's what we used before.
So, what we can do, if we come over here and we type response., you get no, no help, nothing.
So let's go over here and quickly add a little type annotation that says this returns this, and import at the top.
If we do that, and now we come over here and type response.
we get lots of good stuff so we can say raise_for_status, just to make sure this worked.
If it doesn't work, that line's going to sort of crash, and then we can just come down here and say post equals response.json, and let's just do a quick print out for this one.
Let's show the view count, and these things have come back here, when we say JSON converts to a dictionary, well a list of dictionaries, so it does do dictionary stuff, so be a view count, you can get this from looking just at the JSON that actually comes back, and we're going to have title, so let's run this one more time.
Let's read the posts.
Bam, how awesome is that.
So, we're off to a really, really good start, let's go and implement the rest of the features.
|
|
|
show
|
3:20 |
Now, before we move on from our read posts, let's actually do one more thing.
Let's add another method here, that's going to correspond to this.
So, what we've done so far is we've just gotten the general info for all of them.
Let's get the details for one in particular.
Theoretically, this one might return more information and more details, whereas, the get all of them might just have high level info.
This is going to be interesting because we have to pass the post id, so, what we're going to do down here is let's change this to "show a number" so we can say "which number do you want to see".
The way that, the easiest way to do that is to enumerate this and tell it to start at 1.
And change this to a little number here like this.
So, that's going to print it out and then let's do a, so, we'll ask which number they want to view and then we'll say selected_id.
It's going to be, we're going to go to our posts, and we're going to use the selected index but we're showing them 1 based in arrays but lists are 0 based would you like this dot get_id.
Now, let's just print out selected_id really quick.
Just to prove that this little bit is working.
Now, this is totally missing error handling at lots of levels but just to see that it works.
Just read them, which number do we want to view, I want to view 3, alright, so, that's cool.
It pulls out that id and I'm sure you know that that's correct, actually, you have no way of knowing but I'm pretty sure it's working.
So, what we want to do is actually go and use this to get some details.
So, back here we go, and this is going to be similar to what we had before but slightly more interesting.
I'll say, entry my_id, and here we'll pass post_id.
Now remember, the way this went, was up here, we had a slash curly id like this, and if we want to call it, you don't want to call it id in Python, because id is a built-in and it overrides the name, so, you would just put this like so, so, when we call this function this value, that is going to be replaced right there.
So, let's say get, so we'll get one particular detail.
Now, instead of doing this, we'll say selected post, entry by id and then we'll pass in the selected_id.
Now, again, no error checking to make sure that this worked and so on but that's okay.
So, here we'll actually, I need to say response, then response.raise_for_status, we'll make this a little bit cleaner in a second and then we'll have to come over here and say response.json because it comes back as JSON, until we do this, it doesn't become a thing and then let's just print out the details about it, here.
So, we get it back.
Get the response back.
Make sure it worked.
We get the JSON and then that turns it into an object and we're going to print out here.
Let's just try this and make sure it works.
Let's look at the easy breezy Python HTTP clients.
Look at that, it totally worked.
We went and got it from the server, here's it's id and it's easy breezy.
Here's it when it was written.
Here's it's body content and so on.
This is pretty cool, and so, this is really nice the way this is working; it turns out that this raise_for_status is a little bit annoying that we have to do this each time.
It would be better if we could tell this whole thing just like "hey, don't even give me back anything if it didn't work".
We'll do that next.
|
|
|
show
|
2:51 |
This is working pretty well, but this constant need to call raise_for_status, super annoying.
So if it came back with a 404, this would give us an error and say 404, you didn't get the right response value.
So let's go fix that real quick.
Let's do that by adding another little helper thing, I'll call this uplink_helpers.
Now this is not to do with Uplink, this is us.
Okay, so we're going to write an import uplink, and what we're going to do is we're going to define what's called a response handler.
So we'll say @uplink.responsehandler, and define a method called raise_for_status.
You can call it whatever you want.
And here, it takes the response.
So, if we put this somewhere in our service description, it will be called automatically, and we can just do this, response.raise_for_status.
And that's like calling, this is a response which comes from requests, this is it's way to check for errors, and if it works then we'll just return this and carry on.
Because it's one of these Uplink response handlers, it lets is do this little bit, this little trick here, that's going to make everything wonderful.
Let's go over here and put blog 2 right there.
So let's try to see if we can make it break.
I want to read, fails, could not find this URL, and where did this happen?
It happened on this raise_for_status.
And what we need to do, is we need to actually call that all over the place, if for some reason we don't, it'll give us some weird value about the JSON not matching.
Why, because it gave us a 404 not JSON.
But we don't want to have to call this everywhere.
So let's get rid of these, any it yet, not yet.
There would be more but we're going to skip them.
So now what we can do, is we can take, from our little helper, we come over here and say, @raise_for_status.
Have to import that from our little helpers we wrote here.
Python is saying this should be listed in requirements.
It's not technically required, because it's a dependency, but yeah, sure, let's go ahead and list it.
Now this means all of these functions will all of a sudden start validating, so if I run this again we should not see that JSON error, in fact we should see, well it worked 'cause I changed it.
Let's put it back so it's broken one more time.
See 404 client error, where did this happen?
If you go, here, it's just right when we try to access it, right?
Even though we're not checking this raise_for_status thing that we added, it's really really nice.
We're going to need to do one more thing like this.
When you apply these decorators to the whole class, it applies to every method.
If you apply them to a method, it applies only to that method.
Whew, okay, so now we have our error handling in place.
|
|
|
show
|
4:42 |
If we look at our service, it tell us the way to create a post is to add HTTP POST against that URL.
And what we need to do in our post, is basically pass this information along.
A title, a content, a view count, and a publisher.
We don't need the id that's generated by the database.
We need to somehow do that, and it starts out looking pretty obvious, but then it's not so obvious it's easy, it's just not obvious.
So we know that we want to do HTTP POST against /api/blog, and this will be create new entry.
And it's going to have some stuff that goes here.
This'll be create a new post, but what well it turns out right at this level, I don't love the way that this works, I would like to see something different, but here's how it works.
Basically you pass **kwargs, you pass arbitrary keyword arguments.
And then what you say is this an uplink.body So this document maps to the body.
Now this is actually not going to work quite at first, it's going to give us the funky error, the fix is super easy I want you to see me run into the error, so that you can get around it.
It really depends on what the service is expecting, this service expects a JSON body, if this was like a form post type of thing, then what we actually have is perfect.
So let's go and try to use this.
I'll just pay some code that gets the input from the user.
Okay so, here's what we're going to do, we're going to ask for the title, the body, and the view count from the user again no error handling on the view count, but you should add that.
And then we're just going to say it's published right now, when you right it.
You can't change that.
And so we're going to call create new entry and we're going to use keyword arguments here.
Now PyCharm is being a little more, helpful.
Basically the way they're using type annotations to structure the behavior is conflicting with the actual type checking that PyCharm is doing here.
So I'm not sure PyCharm really has this right, I'm not sure who I should blame for this little funkiness here.
But let's just tell it chill out for a minute, so we can suppress that for this statement and it will be okay.
Now this should fail with a 400 bad response, but it's not obvious why.
Let's go and run that, and now notice there's a bunch of these that are starting to pile up.
Let's close them off, and tell this to run a single instance so it restarts.
Alright let's try this, I'm going try to right a post, this is going to be just created this, and the contents are going to be a new post, it's viewed 71 times, and boom 400.
Bad request.
Why?
Well it's not at all obvious why, you'd have to somehow look at the response from the server or something to that effect maybe the server could give you a better answer.
Could not parse the JSON body you sent, it looks like this but I expected something else, this service doesn't give us enough information really to know.
But I'll tell you what is happening is, it's actually doing form encoded post, rather than a JSON post.
So we need to tell this little client, hey when you post stuff to this server do that in JSON form not standard web form.
So we can just say a uplink.json.
So now this applies to every method anytime it sees the body that means JSON when we say that.
Let's run it again and this should work, and let's do a quick read just to see.
Notice there are 4, let's do one, now let's write a new post, this was done live, and it should come into existence.
Should be fun to see it appear now, and it's very popular.
Boom, look at that it's created.
Well our program said it's created, has an id that means is like probably did, but let's just hit list again.
Look at that, number one this was done live, and let's actually view the details of it.
This was done live, right now you can see when it was recorded, and it should be fine and appears right now, this is totally cool.
Let's do one little quick fix, up here let's put a comma.
Digit grouping in there, so over here we can say colon comma, that will do Digit grouping.
Now we can read them, 1000 view perfect this was done live.
To review we figured out what the URL is that we're going to work with.
For various API end points, we created functions that map that information to behaviors we're doing here.
And then we just call them, and we don't even implement anything, look there's literally no implementation to any of these methods.
They're just documented which is pretty wild actually.
|
|
|
show
|
3:21 |
Now when we called service.create new entry, let's just type it again.
And we saw Python kind of freaked out, and what could we put in here?
Well, this **kwargs just means, you can put anything and so much for the help here.
You're just kind of on your own.
You have to know this is exactly how it goes, but it doesn't have to be this way.
Let's go over here and fix this.
Let's rename this to double underscore, under here it will say create new underscores.
A, no that's fine.
And then we'll define, __create_new_entry.
So why the double underscore?
This hides it from being used from the outside.
When we say service., we'll never see this function.
Right.
Almost private, almost.
So here we can just say return self.__create_new_entry and then we need to put some stuff in here.
Let's go borrow this real quick.
And up here, we don't have to have this unpleasant **kwargs.
We can have real values like title, which is a string, content which is a string, view count.
Let's just call them views, which isn't it?
And published which is a string.
And we could even put some values like this.
I'll say if published is None, then we'll go and set it to be the current value right here, like that.
Of course we're going to have to import that here, and this was views and so on.
Now this one still is kind of doing this free count thing so we can suppress it internally, but nobody outside of here will have to know.
You could specify tighter on content or if you want to override the views, you can do so here and then this is actually going to go to the service.
And we might as well go ahead and tell it.
Then it also returns this.
Okay, so now if we come back over here, let's write this again.
So svc.__create_new_entry, oh look, did we get any help with visitor?
Of course we do.
We put title, we put content, we could put the view count.
I'll go ahead and do that.
We'll leave the published off like this.
Don't need that warning.
This is much cleaner.
Now we know how to work with the API.
We put reasonable defaults and have it work really well.
So let's see what's here.
Let's do one more post.
Let's write it.
Of course, there's that lack of error handling.
Let's write a post.
This will be the final post.
It was Final Frontier and say 7,001.
Okay, created just like before.
If we go and read them, it should be there.
You want to see details about it, it's exactly what we wrote.
But we have this much nicer way to work with it.
Okay so that's uplink.
If you're going to work with this well structured API, it really lets you control the way you interact with it.
Let's just look over here really quickly at a few more variations.
We talked about how you can pass at the query strings.
You can do things like specify the headers.
You can pass in an authorization, which then gets stored in the header.
You could even run synchronous and asynchronous versions.
Okay, so there's a lot more to go, but I think we're going to leave that exploration up to you.
|
|
|
show
|
1:55 |
Let's review what we built.
We defined a client to interact with our HTTP service by creating a class and having it derive from uplink.Consumer.
So we created blog_client and its consumer so uplink can do its magic.
The next thing that we needed to do was pass it the base url.
Here's one way to do that.
We could tell this class, it's always going to work with that API, so you don't have to pass this base url every time.
It's really nice to have this if you're doing testing against your own APIs.
You could, say if you're in debug mode, then you say, like a local host version, otherwise use production or staging, whatever, right?
So this is really nice, it sort of sets it up.
And then anytime we want to have an API point called, we just write a method, decorate it with one of the HTTP verbs, here we're using uplink.get/api/blog/post_id, and that post_id is one of the arguments.
Now of course what we get back is a request version of a response.
And notice, there's no real implementation, but here's a nice chance to add a doc string and add a little documentation.
So this is what I would think of as a raw API method.
Down here, we saw when we want to pass the body sometimes that's a little cumbersome, doesn't really give the consumer of the client a lot of help on what to put, so we wrote this wrapper function.
It takes meaningful arguments, creates some default values for us, and then calls this hidden internal one that routes to our url/api/blog.
To create a new one, we just kind of pass on through.
Really really nice, and for that last part to work when we did uplink.body, we had to specify JSON, otherwise it's going to pass it as form encoded, which, the server, if it doesn't want that, it's going to get upset.
Here's what we got to do to built data servers, and now we can just use it as if it was a standard class, and all these things flow over to the service, really really nice.
|
|
|
show
|
1:14 |
You've seen how fun it is to build API clients with uplink.
Now it's your turn, and we're going to have you build an API client against an API which has several endpoints.
You've seen this service before, over at movie_service.talkpython.fm, and it has these three endpoints.
Recall we did this in one of our service demos previously but we're going to take an entirely different approach and you're going to write that from scratch.
So over here, we've seen that we can go /api/search/something, here we're searching for all movies that have Run as a substring on keywords, or we can find them by director.
Here's all of the movies written by, or directed by James Cameron.
Things like that.
So we're going to take this and let you model it with uplink.
So the first day, really is just mostly watching the videos and if you've gotten this far, you're pretty much there.
So you're mostly done.
Go ahead and just create a shell project, an empty project that has a virtual environment, it has uplink installed, and program.py and an api.py.
And then just you know import uplink inside the api.py, import api inside program.py, run program.
Make sure it's all hanging together, right?
So you'll be ready to start for the next day.
|
|
|
show
|
0:58 |
Now, for Day 2, you're going to work with this movie service.
Now, I just copied these over for you.
Here are the three API endpoints.
So, /api/search/{keyword}, /api/director/{directorname}, things like that.
So, I've kind of laid out the goals of what I would like you to do on this particular day.
On the second day, what I want is for you to more or less create the movie search client class.
This is the uplink client.
Don't have to test it, you don't have to use it, but you're going to need to add three methods to it, one for each endpoint.
All right, and there's a few other steps about like setting the base URL, and things like this.
And here's just a reminder of how this generally looks.
This is not what you do for this one but, you'll have a class, interactional consumer, you have a method, it derives from uplink.get, and you can pass parameters.
So, shouldn't be a huge effort for you, I hope.
But, fill this out to match these three end points as you see fit.
|
|
|
show
|
0:37 |
Third day, you have your API client built.
You've got your program ready.
Now you need to use it.
So just fill out program.py.
Add a simple UI that just asks the user a questions like, hey, what, or how do you want to search for your movie?
By director, by keyword, and so on.
And then just use your client to do that search and then present the results to the user, right?
Should be pretty straightforward.
Remember, you get the response back, you have to make sure that it's valid and then you call json to actually get the data, right?
That's it, so hope you enjoyed learning about uplink.
It's a really unique and interesting way to models APIs.
|
|
|
|
21:51 |
|
|
show
|
0:55 |
Hello and welcome back to the 100 Days of Python.
The next three days, I will be your guide, teaching you how you can do Twitter data analysis with Python.
First, we set up an application with the Twitter API.
Next, we set up a virtual environment and import the Twitter key secret and access tokens.
Then, we dive straight in using the cursor object of the tweepy module to get all our tweets.
Then we show our most popular tweets based on an average of the number of likes and retweets.
Then we look at the top hashtags and mentions, and finally, we feed all our tweets into an awesome module called Wordcloud, which makes a nice visual representation of our Twitter usage.
And the second and third day, I got a lot of interesting projects lined up to solidify your newly gained Twitter data analysis skills.
This will be a lot of fun and I'm exciting to teach you this.
See you in the next video.
|
|
|
show
|
0:43 |
First we want to make an app using the Twitter API, so head over to apps.twitter.com/app/new, I'm going to call it Twitter API Demo to work on the small Tweepy Python code example.
We can just put in our website and callback URL's not needed.
After I agree with the terms and create your Twitter application.
With the app created you'll want to head over to keys and access tokens, and note down the consumer key, consumer secret, and your access token, and secret.
And we will need to export those as variables, which I will show you in the next video.
|
|
|
show
|
2:40 |
Next we create our virtual environment, and normally I would do that with Python -m venv venv.
Here I got an error and I think that's because I'm using Anaconda.
So I got another way of doing it, which is virtualenv -p path to the Anaconda's Python and then the name of the virtual environment.
I'm going to remove the one I had and run that.
Right, as I'm deactivating and activating virtual environments all the time, I made another useful alias to activate them.
So here we activated the virtual environment, and to get out of the virtual environment, deactivate currently there's nothing installed.
With the virtual environment activated I'm going to install the dependencies.
pip install tweepy and wordcloud.
Right?
See what we have and notice that it brought in some other dependencies like pillow, which is an image library.
Numpy, matplotlib, I think those are dependencies of wordcloud to show the nice visualization we see towards the end of this lesson.
One final thing we need is to export the Twitter, key, secret, and access token.
Let's do at the virtual environment level.
First, I'm going to deactivate it.
Then I'm going to edit the venv bin activate script.
That's a script that runs every time we enable or activate this virtual environment.
You can ignore all this setup and go straight to the end.
I'm going to make more environment variables and here you have to enter the key, secret, and access token and secret you got when you created the Twitter app.
I'm going to save that, activate the virtual environment and now, if I look in my env, we have these access tokens available in our environment.
In the next video you'll see how I use the os module with the environment method to access those variables in my notebook.
And that concludes the setup process.
In the next video we're finally going to write some code to access data from our PyBites Twitter account.
|
|
|
show
|
2:59 |
Alright, let's do some coding.
Finally.
First, let's import the modules we're going to use and do some set up.
Then, I'm going to define a namedtuple called Tweet.
And next, I'm going to set some global variables, which, in Python, are uppercase, and words divided by underscore.
So, we're going to look at Twitter data from our account and here are the environment variables explained in last video, loaded into the notebook.
And you can use os environment or os.environ and you can make a script in your favorite editor.
Or follow along in the notebook but notice to load a virtual environment in iPython, there is some set up you might need to do.
So, here's a link and a command you can run to get the virtual environment loaded into your notebook.
That's all set.
Lets dive straight into getting PyBite's Twitter history which is over two thousand tweets.
And we're going to look at the most popular tweets by the number of likes and retweets the most common hashtags and mentions and finally, create a nice Wordcloud and we will see that Tweepy is awesome in making this very easy.
Alright, let's make an API object first.
Alright, and then let's define a function to get all our tweets.
Wow, that's a lot going on here.
So, we use a Tweepy cursor, which is an efficient way to loop all over the tweets.
And, I'm going to access the user time line, which is basically all our tweets, screen name is PyBites and for now, I'm not going to show replies because I need them later.
I'm going to include the retweets, so, basically I get everything.
And that's good because we can always discard stuff later.
But we can not put stuff back that was initially not there.
So, then to loop over it, I use the items on that cursor, we had a namedtuple at the beginning, with id text created likes and retweets fields, and I'm just populating those and yielding each tweet one by one.
So, this is basically a generator, which we covered in Day 16.
Then let's load it on to a list, which might take a while, but makes it easier to inspect.
And let's see how big that is.
Great, so, we have 2400 tweets.
Let's see what we can do with those tweets.
|
|
|
show
|
2:46 |
And let's see, in particular, what tweets were most popular.
And I'm going to first use a list comprehension, which I showed you on Day 16, to exclude the retweets.
And a retweet is easy to see because it always starts with a RT.
Next, let's get the top 10.
And for that I need to do some sorting.
Okay, so how does sorted work?
You give it a sequence, which is the list of tweets and we use the key argument that can take a function or callable and we give it a lambda, which is basically a just a simple function in a one-liner.
And we give it a tweet, and then it will average of the number of likes and retweets.
That's sorts the list of tweets by highest average.
And if you then do it reversed=True, you get the highest at the top.
Alright?
Got already with this format.
So, let's try the for loop to make it nicer.
First, I'll do a specify a format, which I will then use for every row.
I got a column of five.
Separator...
Another column of five...
And the text.
You can use f-strings.
When I was preparing this notebook, I will still using the older formats, so I'm going with that for now.
Besides, if you're not on 3.6, you might still need it.
I use some nice icons.
Then I do a dashed line which I can just say dash times 100 and then the loop.
For tweet in top 10, I'm going to print, format, format, and then I can just fit in those keyboard arguments likes...
and just for the fun of it, let's use a return icon instead of the new line.
Oops.
And I have to close this.
Look at that.
Our first tweet was the launch of our co-tennis platform.
And the second one was our Flash course, etc, etc.
So we have the likes, number of retweets and the text of the tweets.
So here you already see the benefits of doing a bit of data analysis to explore your data set.
And it's not taking that much of code.
Once we have the data loaded in, it's fairly easy.
|
|
|
show
|
2:13 |
Next up are common hashtags and mentions.
I mean, we tweet out a lot of stuff, but what is the hashtag that we mention the most?
Let's define two regular expressions, one for hashtag and one for mention.
And we covered regex more extensively in Day 28, so you should be familiar with this syntax.
Then, I'm going to join all the tweets together in one big string.
And if the mentions can be skewed by having retweets in them, I'm going to define another string with all the tweets excluding retweets.
Next, I'm going to use the find_all method, which we also covered in Day 28, to get all the hashtags.
Cool.
Then we can use the calendar, which we covered in Day 4, in the collections module, to see the most common hashtags.
Look at that.
Obviously we tweet a lot of about Python, but also 100 Days of Code.
And web frameworks like Django and Flask.
Oh yeah, Python and 100 Days of Code.
Let's look at the mentions.
Look at that.
Yeah, we really like the work @Python_tip is doing by tweeting out every day a Python tip or trick.
@PacktPub, we tweet out the new free e-book every day, which is awesome.
And of course, @talkpython, we really like the show and all the stuff they put out there.
Then Bader, @RealPython, they have excellent articles, etc.
So this makes a lot of sense, and it's nice to see this in numbers.
Although the results are definitely correct, I just want to show you how the results are if I exclude the retweets.
So I can just copy this code, and instead of "all tweets", I'm going to call it on, "all tweets excluding retweets".
Yeah, that's more or less the same, but there are some other users here that bubble up to the top.
So next up, you're going to make a Wordcloud of all our tweets.
And it's going to be awesome.
|
|
|
show
|
3:49 |
Alright, our last part, building a Wordcloud.
I left this in the notebook, although we prepped and we have all the requirements installed.
One way you could also do it is to run pip install inside the notebook using an exclamation mark, but make sure that your virtual environment is enabled to not install it in your global namespace.
But we have already Wordcloud, so let's move on and get all the Tweets, but this time we filter out all the retweets I mentioned.
And as the code is pretty similar as the last video, I'm just going to copy-paste it here.
It looks over the tweets, and it excludes the retweets that start with "RT" and with the at sign.
So, retweet and mention.
And that should give us a clean list for the Wordcloud.
Now, here's the wordcloud module.
It's a little Wordcloud generator in Python and you can just feed it a bunch of text and it comes up with this nice output.
You can put a mask on it to get the words in the shape you want.
And I'm going to use that to put the words in the shape of our PyBites logo.
So let's make the Wordcloud.
I'm going to type it out because it's a bit of code and I come back and explain it line by line.
And this takes a while.
It's doing a lot of processing in the background.
So let's wait for it to come back.
Cool.
We got a Wordcloud object.
Let me quickly highlight what happened.
First, we made a PyBites mask by doing an image.open on a PyBites logo I have in my directory.
An image is from the Pillow library.
Then we make a set of stop words, and stop words we imported in the beginning which is part of the Wordcloud module.
I add, and that was basically by doing some trial and error, I had to add co and https because those were common tags.
They're false positives because those are related to Twitter links, and, yeah.
We don't want to have these misrepresent our Twitter word populations, so we add them to the stop words.
Then we make the Wordcloud object.
We give it a white background, max words 2000, you would have to try it on your own data set what the best value is here.
We pass it in the mask and the stop words.
Then we generate the Wordcloud, passing in the string of all the Tweets we defined earlier.
Next up, I want to show the Wordcloud in the browser.
And we're going to use a little bit of matplotlib to do that.
This might take a bit as well.
Alright.
That looks better.
And look at that!
We got the Wordcloud in the form of our PyBites logo.
By the way, this is our logo and mask, so you see the similar shape.
And look at that.
I mean, what's cool about this is that you really see what we're all about: 100 Days Of Code, Python, Code Challenge, API, Django, PacktPub, Twitter.
So they're really things that stand out, flask, of course, so very cool.
And nice that you can just import the module.
Three lines of code to create the object and four lines of code to make the image, basically, and you're set.
I mean, it's pretty impressive.
That's a wrap of this lesson.
I hope you like it and you got a taste of how to get data from the Twitter API and do a bit of analysis on that data.
|
|
|
show
|
2:10 |
Lets quickly summarize what we've learned so far you can use Tweepy to interface with the Twitter API always load API keys and secrets from your environment and a way to do that is to use the os.environ.
Here's how you make a Tweepy API object, then we can use that object to get our way to cursor till you see we get all the tweets from your timeline, then we did a top ten of most popular tweets.
First we looked over all the tweets and used sorted to get a written line down to get the most popular tweets as defined by an average of total likes and retweets per tweet and voila.
I guess some marketing folks out there will be interesting to know which tweets are doing well, well you can and it's only a few lines of code.
Next is most used hashtags and mentions.
What are we talking about the most, so we define a couple of regular expressions and put all the tweets in a big string then we use find all in combination with calender and we saw that before in the collections and regex lessons.
To get to most common hashtags, which were these, and similarly to get the most mentioned Twitter handles, which were those, very useful info.
Lastly, we made a Wordcloud of all the tweets and we used the wordcloud module, we define the mask which was our pilots logo, added some stump words to get a better result and constructed the word cloud object.
To get the Wordcloud to show in the notebook we used a little bit of matte lot lip and look at that, we got a word cloud in the shape PyBites logo.
How cool is that right?
I mean visually its beautiful but its also informative in that we really see some words standing out.
Alright, with these practical examples under your belt now its your turn to go through, the practical exercises we have lined up for you in Day 2 and 3.
Good luck.
|
|
|
show
|
3:36 |
Welcome back to the second day of the Twitter API lesson.
And in this video, I will show you a couple of ideas and projects you could be working on.
The one we prefer, specifically, is how to make your #100DaysOfCode daily tweet.
I mean, if you're doing the challenge properly, you should tweet out every day your progress, which is a great way to share your progress and work and also have that extra push to do it.
To be accountable.
And, so, we made a script when we did the 100 days to automatically tweet out our progress.
And, obviously, it uses the Twitter API to automate that.
As you noticed in the lessons, we did mostly get, this would be a post request to the API, so that would be a nice extension.
And this is a related article, "How To Build a Twitter Bot".
Basically, how to automate Twitter.
A very useful tool to have.
Then there is this three-part code challenge you can do, which we broke down by getting the data and do some Twitter data analysis to find out about similar tweeters.
Again, you will be working with Twitter API data and look at what Twitter users are similar.
So, that could be interesting.
And we have number seven, which is a Twitter sentiment analysis.
For this, you don't have to know about, like, very sophisticated machine learning libraries.
Back in the day, we used TextBlob.
It was quite easy to use.
Though your analysis would still be a bit more intelligent.
So, you can do one or more of these challenges.
And here are some extra links if you're more interest in testing how to test an API, here's an article about parsing Twitter geo-data and mocking API calls.
So that could be interesting for you to look at how to use the patch object to mock the Twitter API, or Tweepy, in this case.
And so, this could be another thing you could be working on.
You could even combine it with the Slack API.
For example, to post to a channel every time your domain gets, or whatever search term, gets mentioned, and we did that here, so this is our own 100 Days Of Code repository.
And Day 20, we had this domain mention script.
So you can take this, adjust it to your needs, or build it up from scratch.
And as you see here, we used another library, Twython, which is also very nice to talk with the Twitter API.
And we use the Twython streamer to look at Twitter data in real time.
So, the other thing that you can do, which is very interesting, is look at Twitter's streaming API and combine that with Slack.
It would be a very cool project to work on.
Another option is to export your Twitter archive.
That'll get you a CSV file.
And then Day 37, you should have learned about parsing CSV, so you could also do that to get a similar Twitter archive report with some stats.
One other example, we did a guest post the other day on Real Python.
Another thing you could do is read through this article and see how you can use the Twitter API to convert tweets of a particular handle into a nice web app.
So, those are quite some projects and examples.
You can look through them and take whatever interests you.
The goal, really, is to get more practice using the Twitter API with Python.
And, with that said, don't forget to have fun, and keep calm, and code in Python.
|
|
|
|
24:59 |
|
|
show
|
0:52 |
Welcome back to the 100 Days of Python, Day 61.
Wow, that means you're already 60% in.
Way to go and keep going.
I hope you enjoy it.
The next 3 days, I will be your guide, showing you how you can use the GitHub API with Python.
We will be using a module called PyGitHub, which makes it pretty easy to work with the API.
We will both retrieve data from the API, as well as post data to the API.
While doing that, I will also show you the builtin help and their functions in Python, to retrieve more documentation from the API.
And finally, I will also show you how to use pdb, the debugger, to look at your code in realtime.
Working with APIs is a very useful skill to have.
So I'm very excited to show you how to do that.
|
|
|
show
|
3:30 |
Alright, let's get started.
First, we need to pip install pygithub, which is the module we are going to use to query the API and post to it.
So, let's head over to my terminal, and create a virtual environment.
Let's create a directory, CD into it, and, as explained in other videos, I have an alias to create virtual environments based on my use of Anaconda.
So I found a virtual env with the path pointing to my Python binary in Anaconda, that's the best way for me to do it, but as you've probably seen in other videos, another way to do it is Python -m venv, and the name of your venv, which I usually call venv by convention.
That's totally cool as well.
But I'm going to go with my setup.
Then you have to enable the virtual environment.
So, I'm doing that often because I use virtual environments for every project I work on, I have an alias.
So, I can just type ae, and I'm in.
So as you see we are starting from a clean slate, and I'm going to do pip install pygithub.
So with that done, head over to the notebook, and note that I have the virtual environment enabled.
Here's how you can do that.
You need to pip install ipykernel, and then there's a command that you can set your virtual environment inside the notebook.
That's why you see me using venv here, and having access to pygithub.
So, let's import the modules we are going to use.
And it's a bit inconsistent, so the package is called pyGitHub, camel-cased, but you actually use it as github lowercased.
Now, let's make a Github object.
And now I can work with that object.
Notice that we didn't log in, so we're a bit limited in the amount of calls we can make to the API at this point.
And you will see later that when we make this object with a token, we can make many more calls to the API.
And let's work with our PyBites user.
So, I'm going to store the user in pb.
And there you go, and before retrieving data from the API, let's take a little bit of a detour to show you the help functions in Python.
And that's because I've found the documentation not very complete and helpful for this module, so, when I worked with this module for a co-challenged platform, I used help and there to inspect the module and see what was available for use.
So that's why I want to give you those tips as well.
|
|
|
show
|
2:16 |
Let's look quickly how you can get help in Python.
And some time ago we did an article describing the main functions you can use.
So we have help, dir, combining them, pydoc.
So let's see if we can use pydoc on the Github module.
And to use an outside command in you Jupyter notebook you can use the !
or exclamation mark followed by the command.
Right, I thought I mistyped a module, but doing it on the package and on the module name, the importer there is no Python documentation found.
But not to worry, you can just use help on an object.
For example, we just created pb, the get_user PyBites and I can now type help on pb, and look at that.
It's a named user and it shows the class and the methods and even the URL to the Github API.
So in the next example we want to see the get_repos in action.
So I can just go to get_repos, see what it receives, see what it returns.
And see the endpoint in the API.
That's pretty useful.
And another command is dir, you can use it like that, and here we see all the attributes on that object.
So you see the dunder methods, the internal methods and the public interface.
And now I know I can for example, get followers.
How cool is that!
Later we will see git gists, and look at how huge the API is, how many methods and attributes an object has.
You can get a lot of data out of it.
We can also just call help on a method like this.
So we already saw this one before but instead of scrolling through the whole object or class we can just look at a single method.
And that's all there is to the basics.
I use this heavily when I was working with the API and let's look at a practical example next.
|
|
|
show
|
4:14 |
All right.
Enough introduction.
Let's write some code and get something usable working.
So, I mentioned the git repos method before.
And we're now going to use it on the PyBites or pb object to get all the repos and sort them by most popular.
And I define popularity as the amount of stars the repo has at this moment.
So we're going to use get_repos.
And the GitHub API tells me it's in paginated list.
Let's define a namedtuple as best practice to better describe what we're working with.
So we have a repo that holds a name, stars and forks.
Let's write a method, get_repo_stats.
Let's collect the repos in a list which we then can easily sort.
Let's ignore the forks.
Right.
There's some stuff to take in.
Just run quickly over it.
So we keep a list of repos, appending namedtuples, which we initialize with data we're getting back from the get_repos.
So every element in that paginated list contains attributes of which we want name, stars, which are called stargazers in the GitHub API, and the fork count.
Then we return to repos list and we give it to sorted and the great thing about sorted is that it takes an optional key argument which can receive any callable.
Now a lambda is a quick way to define an inline function or anonymous function that we use here to indicate that we want to sort on the number of stars.
And we want the high stars up at the top, most popular, so we say reversed=True.
That gives the whole list.
I put a second argument to this function, the number of items we want to see, so I can then slice the list like this.
So, take the first up until n.
So this will give me item 0, 1, 2, 3, 4.
And let's call it.
get_repo_stats on pb user and I leave n off so it will default to five.
An error.
All right, this already looked weird to me and stargazers does not have a count object.
That's me mistyping it.
Repo has a stargazers_count.
And forks is with an s.
All right, so here we see our most popular repos.
The challenge is, by far, wins and, look at that, 100 Days Of Code, very applicable in this course, and, if you want to see what we did in our 100 Days Of Code, we kept a log.
We saving that the number's correct.
And here we logged what we did every day.
And I encourage you to do the same actually because when you log it and tweet it out, you make yourself accountable and it's very likely that you make it to the end and you have a great collection of scripts to later use in your further Python career.
Let's look at another user, for example, Mike Kennedy.
And his user is mikeckennedy.
So, I create an object and I call get_repo_stats on mk.
Now look at that.
You can see from this output that his Jumpstart course is popular, as well as Write Pythonic Code.
So that's pretty cool.
And next, we're going to post to the API, creating a gist.
|
|
|
show
|
4:44 |
Alright, let's post to the GitHub API, creating a gist.
Now, with the current access, we cannot just post to the API.
It would mean not very secure, right?
So we need to create some sort of access token.
And there are various levels of access.
I mean the GitHub API is pretty granular.
But for this one, I'm going to create a personal access token.
Let's go to my GitHub account, settings, developer settings, personal access tokens, and click on generate new token.
I'm just giving the description.
And look at all the scopes.
There's a lot of different access levels, but I'm interested now in creating gist.
So I click on the corresponding access.
And I click on generate token.
That gives us our token.
And next I will show you how to load that into the notebook.
As per best practice, never leave such a token in your code.
But load it from the environment.
So back at the terminal, deactivate the virtual environment, open your venv virtual environment, the name of your virtual environment.
venv, activate script with your favorite editor.
Go to the end, and let's export github_gist_create_token, fit a token your just copy over.
Save this, activate the virtual environment again.
Source or I have my alias set up.
And now I should have the variable in my environment.
Okay, great.
We can now post to the API.
Let's load in the token.
It would not be available that would give me a keyerror.
So we are good.
Let's create a new object.
Passing in the token.
And to come back on those rate limits, look at the difference.
Look at that.
Now we can make five thousand calls to the API.
Compare that to the, what was it?
50 or 60 before, so authorizing with a token gives you more power.
Let's get my user.
And you see that I'm an authenticated user.
And now, let's create a gist.
Hold on there.
I'm missing required arguments.
Yeah, that's not going to work straight away, of course.
And I did that on purpose, to go back to the help.
Look at that, that's the contract or the interface we have to this method of the API.
We defined if the gist is going to be public or not.
We give it files and a description.
And notice that the files need to be of an input file contact type, which I imported at the start.
So let's first, write some code to be posted.
So I have some code here, that's actually the code we wrote before to get the repo stats.
I'm not going to share this with the world.
Excitement!
So that would be me, create, gist, public True.
And then we need to patch it in a dictionary of the file name.
The name of the gist, I'm going to call it, repostats.py.
And the value would be that input file content object.
And I pass it in my code.
And lastly, we give a description.
GitHub users most popular repos.
Alright, let's run this.
And it comes back with a gist.
Let's go over to GitHub.
And look at this.
There is a repo_stats.py, which was just created by my user.
And look at that.
This code is now available to the world.
And it was automatically posted via the GitHub API, using Python.
|
|
|
show
|
3:50 |
Finally, let's wrap up with a pro tip.
Use pdb to inspect GitHub objects.
Let's say I want to see all the gists of PyBites.
So we do a get_user on the GitHub object from before.
And I call get_gists.
And I look over them.
Let's copy this in.
I'm just going to print the description created at and the link to the gist.
So now I knew about these attributes already, but if you don't and you want to inspect the gist, what you can do is break at this point using pdb.
This would be the same from the REPL and this allows me to inspect the objects that are currently in the program's execution.
It's like if the current frame of the execution has been paused and you can just inspect all of that.
It's like, "Time out," and only you are in and you can see all the things.
Nothing is moving.
I can look at the object.
This not really, this doesn't look very nice.
I can use pp.
And here you see a better representation of the object, nicely laid out.
So here is the section I'm interested in.
The files, for example, that are associated with this one.
And look at that how, you can drill down how rich the objects are in the API.
For example, the owner, I can go all the way to his avatar, his URL.
I could inspect the owner, etc.
It's worth to spend a little time reading up on pdb.
It's very useful, not only to debug issues, but also to inspect your program and its objects as you're building it.
And we did an article in PyBites about pdb which, if you are interested, is an interesting read.
Back to the example.
You can also use help from pdb.
And you have to actually use exclamation mark.
And look at that.
Here's the gist class with its methods and attributes.
So, here, for example, we have a fork of and that we can use to see if the gist was forked off somebody else's gist.
So let's try that next.
I'm going to copy and paste the previous for loop, that used that new attribute that we found in help.
Right, this hangs because I still, that's important and maybe less obvious here in the Jupyter notebook.
When I'm still in pdb, I do need to exit the prompt.
And there you see that it then finishes the cell and I'm ready now to execute the next cell.
So here we see that some of the gists we have we're based off forks.
This one was not.
And this one, for example, was forked.
And you can see that here.
Cool.
And just because we can.
And that's a wrap!
I hope you enjoyed this lesson of the GitHub API.
|
|
|
show
|
2:03 |
Let's review what we've learned so far.
First, we did some setup.
We had to create a virtual environment and pip install pygithub.
Then, we looked at how you can create a Github object to interface with the API.
Use the get_user method to get info off our PyBites user and we've seen that you can use help to inspect that object to see all the methods and attributes available.
The same with there.
And even more interesting, you can use pdb to live inspect your code as it is running.
That was very useful for me working with this module.
Then we wrote a script to get the most popular repos of PyBites.
We use the get_repos method of the API and saw how you can use lambda to sort on an attribute, in this case, stars, of the namedtuple to get the most popular repo at the top.
Which lead to this output and the Github API offers a ton of data.
And lastly, we did a post request to the API by creating a gist.
We created an access token and we saw how you can load it into your script via the os.environ method.
We made a Github object with the token and saw that the rate limiting increased.
So you can make more calls to the API when you're authenticated.
Then we used to create_gist method to get all of the input file content to post code to the Github API.
So we had some code, which was actually a script we wrote, and we used the method saying public True, script name, code, wrapped into the input file content method, and a description.
Look at that.
That created a gist on Github.
And now it's your turn.
Keep calm and code in Python.
|
|
|
show
|
2:00 |
Welcome back to the second day of the Github API project and today it's your turn to start using the API with Python to build something practical, something usable, something you like.
We've done a couple of code challenges on the PyBites blogs that are related.
One was to query your favorite API.
And one of the submissions was building a Github profiler that takes a user name and returns a nice profile page using Flask.
That could be a nice use case here.
Secondly, there was Oktoberfest, by Digital Ocean last October, and you could get a t-shirt if you made four pull requests, and obviously the Github API was used to measure the amount of pull requests so we made a challenge to use bottle to replicate that application, and although that it's not running anymore, it's still a cool app to query the amount of pull requests a user makes during a certain period, so that could be another thing to work on.
Then I want to highlight co-challenges.
Our platform that uses to Githun API to log in users and we have a dedicated button.
And I'm already logged in with Github as you saw in the previous lesson.
And another feature for example is the whole integration of our blog challenges.
The flow is like write up, setup with git, total whole process of making your branch, and finally you can submit your work.
And if you do a PR, we used to get API to reach out to your branch and see if you actually committed Python fouls, which in this case I did not, not yet.
And this again is integrating the Github API into our web application, so that's another example.
And that's it, that's those are a few ideas, and be creative, remember this is great stuff to show in your Github profile, so have fun and learn a lot.
|
|
|
show
|
1:30 |
Right, welcome back to the third day of the GitHub API project.
I hope you had some fun by now using the GitHub API and you chose an interesting project to work on, and this gives you some more links.
So here's the GitHub Developer REST API Version 3 documentation.
You probably will use this a lot, although it should also try to help in the pdb inspection techniques I showed you in this lesson.
And maybe if you're not making the GitHub objects with a token, you might run into limitations of the amount of calls you can do to the API.
Here is an article about request cache.
The cache is close to the API in an SQI database, so when you're developing your cool app, and you do a lot of calls to the API, this could actually be useful to keep that limit down.
The other thing is that this might speed up the response from the API, because it just creates your local database.
So this just an extra pointer you might want to check out when working with any API actually.
And don't forget to share your work.
You can use #100DaysOfCode, there's a lot of people doing that, and that's getting quite some traction.
And of course, feel free to include Talk Python and PyBites in your tweets.
We are really passionate about this stuff, and love to see what you guys are doing and coming up with.
Have fun and go learn a lot of API GitHub goodness, and Python of course.
|
|
|
|
29:49 |
|
|
show
|
0:48 |
G'day everyone, welcome back.
This is Julian Sequeira again and welcome to Sending Emails with SMTPLib.
This is one of my favorites just because I love automating stuff, right.
And this is one of the first cool things that you're going to automate with Python.
Sending emails virus stripped is extremely gratifying and awesome if you want to spam your friends and I think you're really going to enjoy it, too.
So, the point of these videos is to teach you how to send an email using a script, SMPTLib and the Python MIME modules which I'll explain in a bit.
So, click next and carry on with the videos.
Next, we're going to set up your Gmail application ID and then straight from there, create a script.
|
|
|
show
|
1:45 |
For the next few days, we're going to be working with sending emails with the SMTPLib.
And to do that, we're going to break it down, obviously, across a couple of things.
The first day is mainly preparation, and again, across both days, it's going to be a bit taxing, but just bear with it.
So you'll need a Gmail account, and you'll need to obtain your Gmail application ID.
There is a video on exactly how to do that, and it'll walk you through it from start to finish.
Then, you're going to, pretty much still on Day 1, send an email with SMTPLib.
So it's very cool, you get to send that email using code, so that's fantastic, all right?
Day 2, you're going to actually make things a little bit nicer, and learn what you can about the Multipurpose Internet Mail Extensions module.
So, you'll learn a couple of little things there, you'll also learn a little trick, which will allow you to maintain or honor your BCC rules.
Okay, I'll explain that in the video, you'll find out.
And lastly, Day 3, what I would like you to do is, now that you have your perfect basic email script, okay, and it works, I'd like you to start adding data to it.
So figure out somewhere to pull the data from, it could be from a previous challenge in this entire 100 Days Of Code course, could be anything.
But what I'd like you to do is get that data into an email and email it off to yourself.
And that's it, so have fun, enjoy the next 3 days.
|
|
|
show
|
2:56 |
Okay, the first thing we want to do is generate an application password or an application ID.
This is a specific code, a string that we are going to insert into our script that allows your script or you program to talk to Google okay, this is going to talk to your Google account and it'll give you a script access into your Gmail account in order to be able to send these emails, okay.
Naturally that needs to happen or just anyone could script your account, right?
So we kind of want to have something like this.
Now I'm looking at a support.goggle Article 185833, just write that number down, 185833 that is the article all about signing in using application passwords.
If you go down to How To Generate An App Password you can click on App Passwords here that takes you to security.google.com Settings, Security, App Passwords okay don't worry these will all pop up on the screen as you're watching this.
Now, let's just copy and paste that.
You'll be asked to log in, okay enter your Gmail password or your Google account password I should say and then you can progress to the next screen.
Once we're logged in you can then see any existing application passwords you might have running.
Probably the safest thing to do would be to create one of these passwords per application, okay.
That way if it ever gets compromised it's only really one, you can delete that and you'll only impact one application.
Now to do this, to set one up, you click on Select The App, now we want to work with our mail, okay, so that's what we're going to select select a device, now in this case, we're going to choose Other, Custom Name let's just call it 100 Days Script alright and then we click on Generate.
And this will give us a nice pop up with the application password in a yellow rectangle.
So like I said, it's going to be mapped to one application store it in there maybe save it in a password vault if you feel you're going to lose the application or the environment variable just keep very close tabs on this, understanding that it has full access to your account, okay.
So be careful, be very careful and, click on Done and then you'll be able to see it in your current application passwords and that's it, keep that password handy we're going to need it in the next script.
|
|
|
show
|
0:55 |
Alrighty, this one's nice and quick, the setup, so just go ahead and create yourself an emailer folder.
whatever you want to call it for this project, and install your virtual environment.
Now, with this, smtplib and the mime modules they're all built in, it's all standard Lib.
So you actually won't need to pip install anything extra.
Not for this, but as always let's just activate our virtual environment just so we have a nice clean environment to run in.
And in this directory go ahead and create yourself two files, I'm separating them just for ease of explanation right.
So we're going to create an emailer file and an emailer-mime file.
Call them whatever you want, that's just what I'm naming them.
And let's populate the files.
|
|
|
show
|
6:55 |
All right, let's look at that blank slate, it's a bit daunting, isn't it?
So let's fill it up.
Now, this one here is going to have a few different sections, okay?
It might be a bit complex if you're quite new to this stuff but just roll with it and let's see how we do, okay?
So we're going to start off our application using Python 3 and we're going to import our smtplib.
Nice, all right.
So when we send an email using smtplib, we need an address that we're sending from.
That's going to be our Gmail, right?
And we need to send the email to someone, so let's just set up two variables for ourselves, okay?
from_address, let's use the PyBites email.
Feel free to spam, no actually don't spam us on that, please and you can send us some fan mail, maybe some, "Hey guys, you're doing a great job," emails.
Or Julien is cooler than Bob.
No, I'm just kidding.
So we have to_address, well, we're going to send it to ourselves, okay?
That way I don't accidentally spam someone 'cause that actually did happen.
Now, the email needs body, right?
This is the text that's going to be populating our email script, or our email that we send out, okay?
Now, I use this script for sending out my email to myself for new releases on Steam, you know, the game platform.
So this just going to be a string of some sort, okay?
It could be a paragraph, it could be whatever you want.
However it shows up here is going to be the plain text that shows up in your email, okay?
That includes carriage returns and whatnot, so we'll just go new releases on and sales on Steam.
Click the links below to check them out.
Excellent, done.
Get that right.
Now, for the nitty-gritty, all right?
So the first thing we need to tell our script is what smtp server we're using.
So while we in our heads are thinking yes, let's use some Gmail, our script actually has no idea.
So we're going to set up a little...
Oops, smtp, not pt, I always get that wrong server equals and now we start using our...
Oh jeez, every time.
Now we start using our smtplib module so smtp and within the brackets, this is where we want to use the Gmail settings.
Now, these just copy off me smtp.gmail.com.
You can easily google for these, okay?
If you just search for Gmail smtp settings, you'll get them, okay?
And the port number to use is 587.
That's just a number, you don't need to put the apostrophes around it, the quotes around it, okay?
Now, one cool thing that smtplib does is it essentially...
It requires you to send a hello message, almost think of it like a heartbeat, right?
It has to send this hello message to the smtp server.
And that way, if there is a failure, if, for some reason, the server is unreachable, you will get an error in return and your script won't run, it won't go through all of these steps for nothing, okay?
And we do that using smtpserver.ehlo, that's it, okay?
By calling that, by running that, we send the sort of heartbeat off to the smtp server going, "Are you there?
Can you respond?" That sort of thing, all right?
Next up, we want to start the encryption, okay?
We're using TLS because it's Gmail.
This is all you googly available, all right?
Google it, you'll find out, okay?
So start TLS, that's it.
Start our encrypted session, right?
And now, we do the login.
So makes a bit of sense, right?
We want to start an encrypted line first before we put in any sort of cryptic details, okay?
So smtp, now we want to actually provide our details to the server so we'll logging in, all right?
So smtpserver.login and we're going to put our email that we're sending the email from, okay?
This is your Gmail account that you'll be using for automation that you're sending the emails from.
And now, in this section here, you put your application ID, password, whatever you want to call it, okay?
Now, I'm obviously not putting mine in there because I don't want you to use my email to spam me or get up to other sort of mischief, right?
Now that that's there, we can go smtpserver.sendmail.
Yay, send mail, this is the actual fun part, this is where we're sending our email.
So we need three things here.
What do we need?
We need the from_address, we need to know where we're sending the email from.
We need to know where we're sending the email to and we need the stuff that populates the email, all right?
So we have from_address, we have to_address and then we have the body.
There we go, from_address, to_address and body.
That's it.
That's all, we're done.
Now, as we've come to learn a lot of modules require us to close the connection, okay?
So we're going to close our connection to this and smtp server and I like to add something just for login, email sent successfully and that is that.
So if you've done all of that right, and you run this script, you will end up with an email, okay?
And it will just be a nice, simple plain text email, you'll notice a few things about it which I'll show you in just a second.
Obviously, I can't run this one, so I actually have this script fully written with my application ID elsewhere, here's one I prepared earlier.
And this is what the email looks like.
And we just bring up Gmail here, and there we go.
So you can see there's an email that was sent, it says new releases and sales on Steam, click the links below to check them out.
That's it, right?
We only specified
|
|
|
show
|
8:26 |
Before we get started with the actual code, let's just understand a bit what MIME is.
MIME is actually an acronym for Multipurpose Internet Mail Extensions.
I'd rather say MIME than all of that.
With MIME, it actually extends email functionality.
You think about all the cool HTML stuff, and audio, video, images and so on that you can attach to emails, and all of that.
That's all thanks to MIME.
It's not plain text.
It actually allows you to give your emails multiple parts such as header information, and all of those nice things.
One thing you'll notice looking at the screen here is without email from the previous video, the SMTPlib sendmail, we don't have a subject.
We don't really have much at all.
There was nothing for BCC.
There was nothing.
That was the real basic, basic stuff.
With MIME we get to go a bit further than that.
Let's hop into the emailer-mime.py file you created, and let's get cracking.
Now we're import smtplib as we did before.
We'll keep that the same.
Now we need to actually start importing the MIME modules.
It's not too bad.
Just roll with it here, alright?
This seems a bit complex, but from email.MIME, this is all just the stuff in the module that we're taking out, okay?
We're not going to import everything, just what we need.
From email.mime.multipart, import MIMEMultipart.
This is the module that's going to allow us to, I guess, section up our email.
Build our email together, alright?
You'll see what that means in a minute so just roll with it.
from email.mime.text, import MIMEText.
This is just to do with the text section.
Again, you'll see how this all fits together in a minute.
Alright, so we'll stick with what we know.
We get a from_address.
pybitesblog@gmail.com, okay?
Now we want a to_address.
Now one thing I would like you to consider here is the BCC, the essence of BCC, alright?
That was a carbon copy, blind carbon copy.
That means no one can see who's been BCC'd on an email.
Now with that, you'll notice that MIME actually fails us.
I'm going to touch on that in the next video, so don't panic.
Let's just go with this, okay?
To address, let's again stick with what we know.
pybytesblog@gmail.com.
Alright, now what we want to do is we want to take the ability to build our email using multipart.
We're going to take that function and we're going to assign it to the message object, alright?
We're going to make that our message object.
Why do we do that?
Just because it's easier to use message instead of my multipart.
Again, you will see what I mean.
Alright, so what are the different sections that we want to build?
Well we want to build our header.
To build our header, this is the format.
We want to have a from field, so message from...
Is what?
Well it's going to be our from_address, that's it.
What we've done is we've actually built this little header tag that will actually extend the functionality of our email.
Our email will look nicer and will have that as a valid id for the from field.
Next, we want to have to, so message to...
We're going to use our to address.
Nice and easy so far, right?
Now for the fun part.
Now we get to specify a subject.
Message subject equals, well how about we take that first line from the last one?
New releases and sales on steam, okay?
You can call that obviously whatever you want for this practice round.
Now back to this, we'll build our body.
I'm just going to take the exact same text from our previous script, dump it in there, right?
Now we want to build it all together.
We go message.attach, and now we're going to attach, if you just paid attention for a second there you would've seen that we just created body.
We didn't actually assign it to message.
This isn't included in our message.
That's what this attach thing is doing.
It's attaching our bulk, our body to the message.
Message.attach, and this is where MIMEText comes in.
Now we're taking our body.
Again, that's this object here, this variable.
What kind of an email, what kind of a body is this going to be?
Well it's just going to be plain text, not okay text.
Yes, to answer your question, you can put HTML there.
Your body can be filled with HTML tags.
You can literally write HTML between these three here, and it will form your HTML email.
That's just a bit beyond the scope of this as it's a bit too much.
Alright, now we move into our normal SMTP stuff, so a bit of magic.
We're just going to make all of that appear here, and we're back.
It's exactly the same smtplib stuff that we saw in the previous video.
Just chuck it in there.
You can feel free to edit your existing script, whatever you want to do.
Now when we run sendmail, if you remember we threw the body in there, okay?
We had the from_address, the to_address, and the body.
In this case, body has already been thrown into our message, so how do we combine that?
How do we get this working?
Well sendmail needs string, it needs text.
It doesn't like an object like the message object being thrown in there, okay?
What we need to do is get our message as a string.
message.as_string, and we'll assign that to text.
Again, this here text, you can make that whatever you want.
Let's give ourselves some white space.
Delete that in a minute.
Alright, and then we get back down to smtpserver.sendmail, and we're going to go from_address, oops.
We're going to go to_address, and we're going to go text.
Then as usual, SMTPserver.quit, and we're done, okay?
Now let's just quickly throw in this print email sent successfully.
Save that.
Now when you run your script, you should get an almost identical email.
The body should be exactly the same, because again, we didn't do anything differently here.
The thing that's cool is that you should have a subject, and some more header information.
Let's have a look at that.
Alright, so there's the email.
New releases and sales on steam.
And now you can see the same information there.
When we drop that down we can see a to_address, and which is my email, and yeah, that's it.
|
|
|
show
|
3:33 |
One last thing I wanted to show you really really quickly, was the BCC, okay?
A lot of the times, if you send, if you're automating this sort of thing, you don't want everyone to see everyone who this e-mail is being sent to, right?
So imagine you have a mailing list of something.
Imagine sending out all 100 to 2,000 e-mails and everyone's seeing each other on the e-mail.
Not great, okay?
So you can actually BCC this.
As I mentioned before, MIME does not honor BCC by default, it's actually by design.
Go figure, right?
If you were to create an object in here, message...
BCC, for that field, it actually works in that, that field is populated with the e-mail addresses that you put in there.
The problem is, it doesn't honor the nature of BCC in that it's blind.
It may as well be a CC field, tagged as a BCC field.
It's kind of crazy, right?
And it was something I struggled with for, for a while.
So the way I get around this using MIME and SMTPLib is by throwing it into your SMTP server line.
This send mail line I should say.
Okay?
So let's say...
I have three e-mail addresses.
I'm just going to copy them and paste them in here, right?
Done.
So we've got Codewright's blog, we got my e-mail at Gmail, and which doesn't actually work, and we've got e-mail at Gmail, which I'm hoping doesn't work either.
Now...
If we again, if we were to do it this way, with the message building in the multi part, all of these e-mails would see each other when they get your e-mail, right?
So what we actually want to do, is rather than do it in specified in your header information, because that gets displayed by default by design.
We'll just throw it down here into the send mail section.
In order to do this though, if you think of it this way.
Think about your types here.
Your Python types.
to_address is a string, which means you can't easily add these onto it, because BCC is a list.
So how do we get around that?
Well, we make to_address a list down here, and then we add on to it with BCC.
That's it, okay?
All you need to do is send this now, and everyone on your BCC list will get the e-mail and they won't be able to see each other.
And furthermore, in the production environment or something more official than this demo, you'll probably make your BCC list of e-mails.
This will be an e-mail list.
You'll pull from a database or something like that, and then you'll just pull in the list, all right?
You won't have to type them all into your script, because that'd be ridiculous.
So there's our send mail with from_address to_address, as a list.
With BCC added on to it, and then our text body, and that's it.
So enjoy, and good luck with all your e-mail automated needs.
|
|
|
show
|
4:31 |
How easy was that?
This is pretty much one of the coolest scripts because you almost just have to write it once.
And then you can copy and paste it for whatever project you want, obviously remembering a couple of good practices there which is one of them being to create your own application id for every application, right?
Okay, so, what did we do?
What's our recap?
Well, we got our Gmail application password.
There's your quick guide on how to do it.
Again, a quick Google will get you everything you need to find out how to do that, but I will provide the links.
Next, send email with smtplib.
Well, we began by importing smtplib, go figure.
Right, then, we specified the server that we're running, specifically the Gmail server.
Then, we checked for a heartbeat, using that hello message, okay, that's just to make sure the server's okay and ready to go.
And then we started the TLS encryption, all right?
Next, we sent through our login details, and just a word of advice, never, ever, ever hardcode your application password into your script.
Okay, never do that.
The safest thing you can probably do that's also super simple, is make your application password an environment variable, okay?
And then use something like os, or whatever to, reference that id, okay, in variable form.
Import it, reference it, okay?
Next, we sent the email from address to address body with a sendmail and then we quit.
We closed that connection to the SMTP server.
And we got a nice, plain-text email.
Next, we have send an email with MIME.
Okay.
This one was a little more complex.
We started by importing the required modules, right, Multipart and text.
Then, we created the Multipart object in Message.
Again, that's just nice and easy.
All right, we built the header.
From, to, and subject, yes?
Yes, yes, we all got that.
That was so that we had all that extra information, made our emails a little more functional and beautiful.
All right, now, we had to attach our body text to this Message object, okay?
Remember, when you specify your body text or whatever's going to be in the email, you don't do it using Message, you just sort of create your variable and then you attach it, all right?
That's what MIME text is for.
And then, we took that entire awesome Message, Body, Header object that we'd created and we turned it into a nice string, and we assigned that to text, and that way, sendmail, beautiful sendmail could talk to it and send the email off, all right?
And I've also included this little BCC trick in there.
Remember, we took our to_address and made it a list, that's this here, and then we had our existing list of BCC emails, whether we pulled that in from external or, I guess, hardcoded it into the script, whatever floats your boat, and we combined the two lists and sent them out.
And that is it, my friends.
It is your turn.
Now, I reckon, really cool thing you can try is to write this script yourself.
As I hinted at in one of the videos, find something that you can populate into your email with some sort of Python data structure or process, whether it be just a list of names, it could be something from a database, whatever, try your hand at that, and if you smash that and you have some extra time, I reckon try and automate it.
Set yourself up a cron job if you're running Linux, hopefully, or a scheduler on Windows, whatever you can find, whatever you have, just Google around, find a way to automate it, and maybe send your mates some annoying emails, maybe just your smiley face with a thumbs-up.
Do something like that.
In fact, I might go and do that to Bob now.
So enjoy, keep calm, and code.
|
|
|
|
20:45 |
|
|
show
|
0:49 |
Welcome back, this is Julian Sequeira and I am going to be walking you through a very simple yet awesome module named pyperclip.
This is a module that we'll simply copy and paste from your code, there we go, done.
May as well not watch the next three videos.
This is a module I actually can't live without.
It has made so many scripts just that little bit easier for me and it's just a wonderful, wonderful script.
So, module I should say.
So, I reckon you're going to enjoy the next couple of days.
We're going to do a couple of really simple scripts after we walk through how to use pyperclip.
Don't worry that takes about two seconds, copy and paste.
So, click the next button, watch the next video, and let's create some fun scripts.
|
|
|
show
|
1:44 |
Okay, very quickly, here's how your first three days for pyperclip are going to pan out.
So for the first day, you're actually just going to learn how to use pyperclip.
That shouldn't take long, only a couple of minutes, because it's very simple.
And after that, you're going to generate an affiliate link using pyperclip.
That's a script that we use, and it's actually quite useful.
You've got a used case there that you can probably change to suit your needs, so that's a great script to be creating on Day 1.
Okay?
Day 2, you're going to do the same thing, you're going to create another script.
So these are going to be a few easy days, you're just creating stuff for yourself, right?
Create a text replacer script.
Now this one will, well, you can read here.
It allows you to replace text using pyperclip.
I won't give too much away, watch the videos.
And last but not least, Day 3, come up with something yourself using pyperclip.
Okay, so you've got the basics down, well, it's all basic, right?
And what you need to do is create a challenging project for yourself, okay?
You can complete it or not on Day 3, it doesn't matter, but one great idea is a persistent clip board.
Something that will, I guess, save the things that you copy to the clipboard, and then allow you to paste them all back later.
That's a really cool idea.
Another one would be a sort of password vault.
It doesn't have to be secure.
I wouldn't actually recommend using it, but create a password vault that uses pyperclip to do the copying of your password for when you want to paste it out somewhere.
So these are some cool used case ideas, use your imagination, and make something great.
|
|
|
show
|
0:52 |
Righty oh, let's get cracking.
All right, so a quick setup for us.
Let us quickly create our virtual environment.
Create the venv and all we have to do for this video for it to work for the rest of this lesson is pip install.
First let's activate it.
Okay, so, pip install pyperclip because it isn't in standard lib.
And once that is installed, I'd like you to go through and just create the following two files text-replacer.py and affiliate.py.
That should give you a hint as to what these scripts are going to be.
So once you've got everything installed, and pip installed and whatnot, just go ahead and move onto the next video.
|
|
|
show
|
2:34 |
Okay, this might be the quickest demonstration you're going to see in this entire course, so.
Alright, in the shell we're just going to import pyperclip.
This video is just going to walk you through the pyperclip usage.
In your head just think about the whole, the way you copy and paste at the moment, so if you want to copy something from the command line and paste it somewhere else, you're going to copy to put it on the clipboard, and then you're going to paste it off the clipboard.
Same sort of concept here, but almost reversed.
So, if you want to take the user's text that they have copied to the clipboard, you're going to paste it into your code, and then once you've manipulated it, and you want to put it back on the clipboard, you're going to copy it out of your code.
So, if we do pyperclip.paste it's going to show you what I have on my clipboard or the last item on my clipboard, okay, which is this URL.
Now, let's say we just want to strip out the HTTPS and have just codechallenge.es there, okay.
If we want to push that back to the clipboard, we just go pyperclip.copy and then in here we put whatever we want in, okay.
Now, mind you, you can make this a variable.
So, this doesn't have to be plain text.
If your variable happens to contain an entire, say, book, or an entire chapter, or an entire website worth of text, you can pop that variable in here and it'll copy it back to the clipboard.
Okay, and then just to show that that worked, let's just put pyperclip.paste back in, actually, I'm not going to copy that, that'll override the clipboard, won't it?
So, pyperclip.paste and there we have it, just the stuff that we sent back to the clipboard using copy.
Okay, one thing to then keep in mind, is that as you use this script, as you use this module pyperclip.copy and paste, it will override what you have on your clipboard, so be careful.
Just keep that in mind as you're using it, especially when you're using it in a script that you're going to call, few times a day, you might actually end up copying over the top of something important.
So, just keep that in mind.
And, now let's create some scripts.
|
|
|
show
|
5:26 |
It's time to create something useful.
This is a script we use, Bob and I use for PyBites, to actually put our affiliate code into some of the Amazon links that we use on the website.
This is really cool because it's a great demonstration of how you can make a script for yourself that is useful day to day and is really just a nice, cool, dirty script.
You know, it doesn't have to be pretty and it doesn't have to have all the cool Pythonic formation around it.
It's not going to be any functions.
It's not going to be anything, just a couple of lines of code.
So let's start off by importing pyperclip, and what this code's going to do is it's going to take a URL and it's going to tack on our Amazon affiliate code onto the end of your URL.
So it's going to paste it in, edit it, and then copy it back out to the clipboard.
So the first thing we need is our affiliate code.
That's a constant, it's not going to change.
Let me just copy that.
Now you'll notice that the affiliate code is this here, right?
But this here, if you were to inspect any of the affiliate links that we have, you need to tack this onto the end of the URL, or somewhere in the URL, and this will then provide the correct affiliate link.
You can't just put this in there.
You have to have this there too, okay?
Alright, so we'll move on.
Now we want the URL, so the URL you're bringing in is going to be the pyperclip.paste, right?
Now obviously, we're not going to do any huge amount of testing here, because this is just, again, a dirty script.
I'm not going to sit here and say, well, if it's not a link that's being pasted in, you know, and all that sort of rubbish.
We just want to go quick and dirty, okay?
So the most we're going to do is check for the word Amazon in the URL, so if Amazon is not in our URL, well then, let's just return a message.
What are we going to say?
Sorry, invalid link, okay?
Nice and simple, don't want to go over the top, and now what are we going to do?
This is where we're going to manipulate the URL, so we've called in the URL with pyperclip.paste.
We've checked to see if it has the word Amazon in it, and if it does have Amazon in it, we can then, let's create a new variable called new_link.
And it's just going to be simple string manipulation.
We're going to go URL, which is the paste, plus affiliate code.
That's it, so pyperclip.copy as we saw in the other video, new_link, and then print.
Alright, we're going to say affiliate link generated and copied to clipboard.
Oops, close that off.
Alright, so not much to it.
It's actually very, very simple, isn't it?
So we like that, so we're pasting it in.
We're checking to see if it has Amazon in it.
If it does, we're appending the affiliate code on, then we're copying it back to the clipboard, okay?
Let's save that.
Now if we need to run that, we just have to copy something to the clipboard, so let's copy my Gmail link, mail.google.com, and let's run the script, see what happens.
Alright, it says sorry, invalid link.
That's exactly what we wanted.
And now I've just copied an Amazon link for one of those Fire Stick devices, and we're going to run the script again.
And it'll go affiliate link generated and copied to clipboard, so let's just paste that in here.
And there's all the standard Amazon URL, and then right on the end there we see end tag equals 0fPython20, which is our affiliate code.
And then just to be sure, we can go check that in on Amazon and see if it works, and it does.
I don't expect you to do that.
This isn't some sort of cheap sales trick.
Yeah, so it all works really well, and this is, again, a nice simple script.
Obviously there's a lot of checking that could be done.
For example, if I take amazon.com.au, copy that to clipboard, and then run this again, it's going to say it's generated, but when I hit paste, you can see we've just got amazon.com.au and the tag, which is not a valid link, so obviously this isn't something for production use for the rest of the world.
This is just something that you're going to use just as a little hack job when you know you have the proper type of URL copied to the clipboard.
So there you have it, nice little use case of.
|
|
|
show
|
6:15 |
Okay for this script we're going to create a text replacer.
So this is a quick script that will take in, off the clipboard, some text, and will allow you to then substitute certain words in that text with other words, and then paste it back to the clipboard.
Again, this is something I've used and I keep handy, because there's a few times, especially at work that I need to do stuff like this.
So let's import pyperclip.
Let's throw in this as usual.
Let's create our functions first.
We need to create a function that will paste in the information, right?
So paste_from_clipboard.
I'm making these very detailed names, just so we know what we're talking about.
And we'll say the text that we're going to deal with is pyperclip.paste And we'll return that.
So, return text.
I'm keeping this super clean and simple.
So we've got our text, we've read it in from the clipboard, and we're going to return it.
Now we need to take that text, and replace it.
We're going to do that with a replace_text.
So def replace_text.
Let's read in old text.
We'll just change the name like that to make it interesting and descriptive.
Now what do we want to do?
We want to replace some text, so we're going to ask the user what they would like to replace, rather than hard code it in.
So we'll just create a target, is input: What would you like to replace?
Then we're going to actually do the: What do they want to replace it with?
First, they're specifying the word they would like to have replaced, and now they're saying what they want to have it replaced with.
So replacement = input, and what would you like to replace it with?
Let's just hit enter.
There we go.
We're going to build a new text block after we've done the replacement.
To do that, we're going to go new text is...
So old text.replace, cause we can do that.
It's Python, it's cool!
Old text.replace target, and replacement, and that just does a simple search for the target, and then replaces it with the replacement text.
Then we'll return that.
Return new text.
Let's call these down here, so first we're going to say old text, cause remember we're calling that in here?
Old text is...
paste_from_clipboard, and then new text is replace text and loading in the old text.
And now we need to copy it back.
It's going to be similar to the paste_from_clipboard, we're going to def copy_to_clipboard.
And we'll load the new text into that.
And then all it needs to do is run that same pyperclip.
pyperclip.copy New text.
Now obviously, this is a simple enough script, you don't actually have to break it down into functions.
I just thought that'd be much easier for displaying that.
Then we'll just print a little message saying, the new string is now copied to the clipboard.
That's it.
So we'll get rid of the bright, white space.
Let's call that function here, okay?
And we go copy to clipboard New text.
So we'll save that.
Let me just copy a block of text for us to actually do this.
We will do this.
So here's the block of text, alright?
Let's run the script.
Alright, what would you like to replace?
Let's replace Julien.
And what would you like to replace it with?
Bob.
The new string is copied to the clipboard.
What's cooler than cool?
Bob.
Now that's a blatant lie, but that's a great demonstration point.
Let's try it again.
So we'll go run the script.
What would you like to replace?
Let's replace Bob with Mike.
New string is copied, let's hit paste.
What's cooler than cool?
Mike.
I'm not going to comment.
Sorry, Mike.
Let's run it one more time.
What would you like to replace?
Let's replace Mike with ice cold.
And paste.
What's cooler than cool?
Ice cold.
And that's it.
Really cool, simple script.
Something usable, I'm sure it's something you can make use of in day-to-day life.
Enjoy it, use it, and that's pretty's much...
|
|
|
show
|
3:05 |
And, that was pyperclip.
You can see it's pretty fun, isn't it?
So, there are a lot of different things you can do with it.
Used cases, I'm sure you're starting to think of, which is good because, well we'll discuss that in just a minute.
Let's recap everything we did, okay?
Just a quick overview, I'll make it very fast.
We're importing pyperclip, okay?
We paste what's on the clipboard into your code using pyperclip.paste, okay?
Then, we copy anything between the copy brackets, we copy that back to the clipboard using pyperclip.copy.
Alright, our affiliate script, okay?
We assigned the paste, okay.
Everything that was on the clipboard we assigned it to a variable, right?
And, then the only tricky thing, I suppose, was that we were checking to see if the word "amazon" was in our URL, and if it wasn't, then we said it was an invalid link.
And, if it was, it then appended the affiliate code onto the end of the URL.
Really simple stuff, very useful.
Obviously, no fact checking to the max, anyway because if you just put amazon.com, that would pass but that's not a valid affiliate link, okay?
Right, then we built a text replacer script, which is also a lot of fun.
Maybe not as useful, but really really fun anyway.
So, we imported pyperclip again.
Alright, we pasted what was on the clipboard back in, into our code, alright.
We replaced it using user specified text.
Okay, they got to choose what they wanted to be replaced, and then they got to typing the word or words that they wanted to replace it with.
Alright, and once that was done, it then copied back to the clipboard.
Easy peasy.
Alright, now it's your turn.
So, pyperclip, one really cool thing with clipboards is that you can actually make a clipboard that has persistent memory, so to speak, okay?
Once you copy something onto the clipboard, it's saved there and you can look at your history of copies, everything that you've copied to the clipboard.
I think that would be a very, very cool use case for pyperclip.
So, for you Day 3, think about how you can copy what's on the clipboard, and if anything is copied to the clipboard come up with a way to store it, perhaps and maybe make some sort of application that will then have your history of everything that you've copied.
That would be very cool.
If not, if that's too complicated and you don't have much time.
Well then, just go ahead and think about the things that you copy and paste on a daily basis.
You could use this as a simple thing to make your own password vault and whatever else you can think of, so come up with something that uses pyperclip and code that for your Day 3.
|
|
|
|
33:29 |
|
|
show
|
0:39 |
Good day and welcome to Excel automation with openpyxl.
I'm Julian Sequeira and I'm going to be walking you through a couple of days of playing with a really boring finance Excel spreadsheet.
But, unfortunately that's the way, that's its trial by fire, right.
We need to be able to play with an actual, really well populated spread sheet in order to make working with openpyxl doable, really.
So get your Excel boots on and get prepared to play with Excel, manipulate some cells, insert some data, all with openpyxl.
|
|
|
show
|
1:58 |
Okay, for the next three 3 with ppenpyxl, here's what you're going to do.
For the first day, obviously, there's going to be a bit of setup for it and I will be going through explaining the workbooks and worksheets.
Okay, that's in that video there.
And after we do that we're then going to deal with pulling some cell values, so pulling data out of the spreadsheet.
It's going to be pretty simple, but it's going to be pretty useful, okay?
So use the financial sample xlsx file, it's located in this repo, okay?
For Day 2, you're going to actually expand on everything you learned in day one with max row, and then on inserting data into the spreadsheet, okay?
That's a very useful one, as you can imagine.
So that's going to be a lot of fun.
Once you're done watching the videos, obviously, play around again with that spreadsheet, and play with inserting data.
So maybe do it one cell at a time.
And then try populating an entire column, okay?
For Day 3, this again as usual, is where you're going to do it yourself.
Okay, come up with something cool.
Ideas, perhaps try editing an employee shift roster.
Okay, so imagine a roster in a spreadsheet of people's names and times and dates and whatever, and maybe monitor it for changes, okay?
So there's a script that does something when something changes, or perhaps a script that allows an employee to update it.
So your spreadsheet is almost like your data base.
Okay, you could also try doing that with a financial budget, something similar, so when you get a list, or a dictionary, of spending data, it updates the spreadsheet, okay?
You could even populate the spreadsheet with data, pull down from an API of some sort.
Okay, so have a go, enjoy it, and excuse the pun.
|
|
|
show
|
0:58 |
Okay, so the first thing we need to do, as usual, is set up our environment.
So we're going to create ourselves a virtual environment, called venv, and once that's installed, we are going to launch it.
Okay, and then we're going to pip install openpyxl That's all we're going to need for this lesson.
The other thing you can do, if you wish, is create a Python file in this directory called excel_automation.
Furthermore, if you want to follow along with the commands, as I type them, you'll want to download the financial sample.
Okay, this is a document that you'll see in the repo.
Pull that Excel file across and you should be able to follow along with that.
|
|
|
show
|
4:05 |
All right, we're going to start off pretty simple, because Excel automation can be a bit complex at times.
Let's open up the Python shell in our virtual environment.
Okay, and we will import from openpyxl.
We're going to import load_workbook, okay?
Now this is going to allow us to actually load the Excel workbook, the actual Excel file.
So I've got the Excel file here.
This is a financial sample I pulled off the net just filled with lots of random data.
I hope it's not actually real stuff.
Now terminology, workbook.
Workbook is the name for this entire file, our Excel file, alright?
That is the workbook.
So when you hear the term workbook, envision that.
What you need to then remember if you're not versed with Excel is that these tabs down here, these are worksheets.
Okay, so the overall file, the parent file, is the workbook and these here are the worksheets.
Okay, the different spreadsheets inside the workbook, alright?
So visualize that and then you won't get the two confused.
Now if we want to open the workbook, we want to load it in, we use workbook or wb = load_workbook, okay?
And then we need the name of the file.
So this is financial-sample.xlsx, okay.
Right and that loaded and then now we can actually start to interrogate the workbook.
So we can go wb.sheetnames and that gives us the sheets, or the spreadsheets down here so already you see we can with interrogating that file, we're talking to it, it's pretty cool, right?
Now one really cool thing that you'll probably see is you need to be able to drill down into these sheets.
So if we're going to import any data or pull any data, how are we going to know which sheet we're talking to?
Well, that's the next step.
Alright and one of the default things that a lot of people go onto is saying okay, my worksheet, worksheet one, is going to be the active, the active worksheet, alright, and the problem with this is and it's perfectly fine if you only have one worksheet and you've got some file saves and tests involved here but you need to understand this catch.
wb.active will put you on the first worksheet or the last worksheet, I should say, that had any sort of data entered or edited, whatever, on it, any action on that, any activity, okay?
So you can see ws one, wb.active, is our finances 2017 worksheet.
If we go in here and we enter in some bogus data, we save that.
Now we obviously need to reload the workbook so I'll do that very quickly.
We reload the workbook.
Now when we do, let's go ws two equals wb.active.
We get yearly totals.
WS one is still pointing at finances 2017.
So don't let that catch you out.
If you always want to talk to the active sheet or the last sheet that was edited, that's perfectly fine but if you want to talk to a specific sheet, don't assume that workbook dot active is going to get you to the right worksheet.
|
|
|
show
|
6:42 |
Let's quickly look at pulling specific cell data out of a spreadsheet.
Okay so we've imported openpyxl using load_orkbook, and we've loaded the workbook financial sample into the wb variable.
So let's look at the sheet names we have available.
And again, we have Finances 2017 and Yearly Totals.
That's this stuff here, okay?
Now what do we want to do?
Well, let's specify the worksheet we want to work on, okay?
Now, if we want to specify the exact sheet, we've looked at wb.active and we know that you've got a little catch there.
So if we want to specify the actual one, we actually go workbook and then we just put the name of the tab, or the spreadsheet in there that we got from the previous command.
Okay so Workbook Finances 2017 is ws1, and there we go.
So now, when we write anything using ws1, we are going to be pointing to this worksheet here, which is what we want to have a look at.
All right, what's first?
Well, if we want to get a cell, okay, we need to know the coordinates of that cell.
So your coordinates are your letters along the top, and your numbers down the vertical.
And specifically, we want to get the value of the cell, so we're actually going to use the word value.
So let's look at just randomly, we'll look at C9.
Let's say we want to get the data specifically in this cell, C9.
So we're expecting to see Montana returned.
How do we do that?
Well, we go ws1.
And then we just simply put in the cell coordinates.
Look at that, ws1['C9'].
And look at that, all we got returned was the object, the fact that C9 is a cell in Finances 2017.
So what were we missing?
Well, as I mentioned, we're going to use value, okay?
The value attribute.
So ws1['C9'].value.
And there we go, we're returned with Montana.
And we can try that again just to prove that wasn't a fluke, 'cause there are a lot of Montanas there.
We can go well, what's B9?
Okay let's say it's the country Canada.
Okay?
So we'll go ws1['B9'].value.
And there's Canada.
All right?
So nice, very very cool, very easy.
You can start pulling data out manually this way.
All right, let's do something a little more interesting.
Let's say for example we have column L here.
And we've got the profit of all of these different transactions or whatever they happen to be.
We can actually collect all of this data and get a total for ourselves.
So why don't we do that?
Let's go to, let's create ourselves a variable here.
So profit total equals zero.
Now what we're going to do is we're going to create a list.
We're going to create a list of this column, of the items in this column.
So we're going to say full column in list L.
So we've created a list of the L column.
Should actually put a column there.
We then go for row.
So now we've got the column up here.
And now we're looking at the rows in this column.
Okay so we've got the column, we specified L, now we're going down to each, we're going to individually talk to each one of these cells.
So full row in range.
Now we're specifically going to look at a range here.
So why don't we go from row two down to row, how about 101.
Let's try this one here.
So we're pretty much looking at exactly 100 cells.
So we'll go full row in range.
2, 101.
We want to get the cell.
So we need, remember we need this cell, we need this coordinate, this C9.
Okay we need to put that together.
So we're going to go column so we go L we know that's our column.
And then we want a string of the row because the row is a number.
So column, meaning L, string meaning this row here.
Okay?
So string rows, that's what our cell is made up of.
So this is going to generate L2, L3, L4, L5 and so on to 101.
Now, we want to go, want to actually add it all together.
So profit total.
Is equal to, we'll make it a float because we know there were actual float things in there.
So ws1, because again we're talking of worksheet one.
And cell, because remember the code just above was generating our cell for us, and .value.
And that should be it.
Okay we've closed everything off.
All right, profit total has been populated.
So now we can print profit total and there we go.
There's a lot of money.
So 3.2 million dollars pretty much is the profit total of these cells here, two down to 101.
So there you have it.
We can talk to the cells.
We've got our cells here.
We can talk to them individually and we can then run some quick little scripts on them, some maths.
I know it's easier in the document just to highlight it and get the sum, but now you know how you can do it on
|
|
|
show
|
4:01 |
So I'm sure a few of you had a question from the last video, which was "What happens if we don't know the end cell for the range?" So in the last video we did a sort of range check.
We went from cell 2, down to 101 in our column, and we just added all of the values up.
Now what happens if we don't know that, you know that end value, that end range number - 101.
You know spreadsheets are constantly growing, so you know we can't hard code our end value in.
This is where openpyxl really shines, it's got something awesome that I absolutely love, and that is max_row.
What we do is, we go ws1, we've specified our worksheet as Finances 2017.
We go ws1.max_row 705.
So what this looks at is it goes into the spreadsheet, goes down here and it just pops down.
I'll let it scroll, pops down to the last active cell.
Okay?
It's not the last fully populated one just like that but wherever the lowest, or the highest, rather, the highest cell happens to be.
So I just popped this in here to show that, while yes, in the nicely formatted sort of rows that we've got here.
Because I've entered something here, max_row is 705.
Okay?
So we'll just delete that, not that it really matters.
And we'll just do a quick demonstration printing out something really quick.
So we'll go for row, we can actually let's just do max_row=ws1.max_row.
That way we don't need to type it out every time.
Let's grab pretty much all of the country data I reckon.
Let's just double check the file here.
And yes, B is the country, so we'll go four row, in range two, 'cause we don't want the header, right?
So two max row, mkay?
And we'll just create the cell quickly, so we'll go with B, 'cause that's the country, try something different rather than money.
And that's string of the row.
Okay, and then we'll just print it out.
So this is going to give us one heck of a list, but for the sake of this, let's do it.
So remember, we still have to specify ws1.
Even though we have got the cell here, we still need to say this is worksheet 1, otherwise he's not going to know.
So ws1 cell.value.
And before I hit enter, this for-loop, it's gone row two, over to the maximum row, which we know is 705.
So this is going to do the 705 times, build this cell number, and then print out the value, okay?
So ready?
Here we go.
And there, we now have None, but that's because, we have, no data down here, okay.
So we can expect that, that's okay.
But, we see all of them, United States, Canada, Mexico, France, Germany, and so on.
That's another way of accessing all of the cells that you need, in a row you can see here, you can combine things now.
You can combine that with other rows as well.
So we could obviously build in the code, we could build the B, we could build that cell, we could also build that along with A.
So we know the government in Germany, the mid-market in France, and so on.
You can see I could start to build these.
|
|
|
show
|
8:09 |
Alright, for this video, I thought I'd quickly show you what this could potentially look like in a script.
So we'll do a standard import here, from openpyxl import load_workbook, and we are going to load the same workbook.
Now we're going to choose worksheet 1, try and format this a little nicer, ws1 = wb, we're still specifying the same file, finances 2017, that same worksheet I should say.
Now what do we want to do?
Let's create a quick function here.
We are going to select our L column again, now where's that file going?
Let's bring this up here nice and quick.
We want to take the same profit column, and this time we want to calculate the overall profit of whatever this data sample happens to be of.
And we want to dump it below here.
So how are we going to do that?
Well let's just pop back to the file quickly.
We're looking here, okay.
Let's give ourselves some white space, let's throw in the default under there, let's create a function.
We're going to call this function insert_sum.
Because what we're going to do is we're going to insert an actual function here, and insert one of those standard Excel sum workers equals sum and so on.
Now to do that, let's create the function, def insert_sum Alright we don't actually need to pass any variables into this one, working at global level nice and simple.
Okay so what do we need to do?
Well we need to figure out what cell, what row, what column we're working with, same with all the other videos we've seen so far.
Let's work with how about this.
We're in row L, so why don't we go with L703.
So how do we do that?
We go ws1, still doing the same thing that we did on the Python show before, ws1, and we're going to specify L703, now we're hide coding it.
I'll show you to get around this in a minute.
Is, is being assigned, now this is where we throw in that function, so sum L2, 'cause we don't want the header, 2L, let's see, what was the last row, 701, so L701.
Very simple Excel sum there.
And then what do we need to do?
Well something we haven't covered yet, we actually need to save.
So we go wb.save.
And we're saving the workbook.
Now we don't necessarily have to put it in the function here, we can throw it down under here, so wb.save.
Then we save it as the actual file name.
So financial-sample.xlsx.
And that's it.
So what this code will do is it's going to run this function here insert sum, and it's going to insert this sum function here into this actual cell here.
Let's run that.
Python Excel Automation.
Now why didn't that work?
Ah, why do you think?
Permission denied, and that is because the file is still open.
So let's close it, let's not save it, and let's try again.
Bang, there we go.
Okay, let's open the file again.
And let's see what we've got.
Alright, so there's our total there.
We can format, you can see there's the sum that we put in our code, let's quickly format the cell's currency, we get a 16.8 million dollar, 16.9 million dollars pretty much.
Again we run into that problem with max_row.
What if this spreadsheet grows?
Then we're kind of screwed, aren't we.
So let's incorporate max_row in, let's get rid of this, delete that, save the file so there's nothing there, and close it off so we don't have any issues.
Now how can we change this?
Well let's give ourselves a max_row variable, max_row equals ws1.max_row.
We've figured that out in the last video, now let's change this up.
We don't necessarily need to know L703.
We just need to know it's L.
So ws1['L'], let's just do some string work here, I'm going to keep it nice and simple.
String max_row.
So L max_row.
Remember the max_row could be 700, 800, 900, 10,000.
It's always going to build that with this here.
Now we're going to equal assign it, the sum.
But again the sum, we don't know what that end value is going to be, so let's build that.
So we'll go sum L to L, and we'll do a little add here of max_row, but think of it this way.
If we do max_row, but we're trying to insert max_row into max_row, you're trying to insert the highest cell into the same cell it's not going to work, because it's going to try and override itself.
So we're going to do max_row minus one.
We want to go one row down from the max_row.
And then we have to throw in that bracket at the end.
Alright.
That should be it.
Let's go back across here, get rid of some white space.
Alright, let's save that and give it a go.
So far so good, I was always confident.
Open the Excel, and there we go, it's down here.
Now why is that?
We know it's because there's some white space or something in one of these cells here, and our max_row is 705.
So what it's done is it's actually done the max_row minus one from our code, max_row here, minus one, and that's made our last section here of the range to be L704.
So now if this spreadsheet grows, max_row let's say grows up to be 710, max_row will be 710 but our sum will point to L2 to L709.
And we have a nice little, oh let's cancel this, whatever.
And I assume I've broken that now, look at that.
I've absolutely broken it.
So let's pretend I didn't do that.
And let's open that file again.
And by doing this we now have this nice little figure there.
And that's pretty much it.
That's how you add a sum, some sort of a function, or whatever you want.
|
|
|
show
|
6:57 |
And that's pretty much the basics of openpyxl.
So it's really cool, it's really interesting and you can see how with a little bit of work you can start to automate adding data to specific cells or specific columns.
Really it's all just about knowing the column numbers, isn't it?
So let's go over everything we've learned for the past couple of days.
Alright, so first and foremost, there's the Excel workbook that we're playing with.
By now you probably hate it as do I.
I don't blame you.
So we pretty much dealt with the L column here where we were looking at the profit.
Okay, we did touch on the country column just to show how to list out everything in a specific column.
Alright, so how do we start?
Well, we import it, openpyxl, load_workbook.
Okay, that's pretty much all we needed really.
And we use load workbook to load in our workbook.
Nice and easy, so far and we assign that to the variable WB and we can then call .sheetnames.
And that allows us to print all of the worksheets in the workbook remembering that your worksheets they're sort of tabbed spreadsheets that at along the bottom of your Excel workbook.
Okay.
Now, the little gotcha.
Workbook.active, the active assigns the last active worksheets.
So the last worksheet that had an edit saved to it.
Okay, that is what active does.
So that is something that can catch you out if you're not careful.
The safer bet is to just assign the actual spreadsheet name.
The actual worksheet name.
So, we used Finances 2017.
We assign that to the other actual worksheet Two Variable, ws2.
Okay?
Same sort of thing.
This time we're specifying a specific cell.
Okay?
So we chose C9, ws1, C9, and then we wanted the value of that cell.
Okay, if we got rid of value and we just click that we'd get just the object, okay?
So this is how we got value.
And finally, on that day we did go through putting all of this together into a four loop, okay?
And what this did was it went over that list L, we took the column L, and we made it a list and we iterated over it with every row that we had and we went all the way to 101.
So, pretty much, 100 cells, we looked at and then we built the cell number here, and then took that cell number and added the value, so it was a dollar value.
We added all of that together and threw it in the profit total variable.
Okay?
And then printed that out.
So that's a nice little use case of openpyxl.
Then we talked about how to actually specify the maximum row because we don't always want to hard code a cell in there as the higher end of our range.
So that's where max_row comes in handy.
Okay?
So it gets the number of the maximum row that is used even if you have blank rows, some of them maybe active because they have a space in there or they had data, or that was selected when it was saved.
And that will result in max_row being whatever that cell was.
Okay?
Now we put that in place in the range, okay.
As a range argument and therefore, we were able to go from cell two all the way to the last row, and then print that out and this column B was our country column and that allowed us to printout all of the countries that were used in that specific column, all 701 of them or something like that.
Alright, now, moving on.
We then did something similar but we were dealing with the actual sum, the actual Excel function that we can put in there, the formula.
Okay?
So we wanted to hard code in cell L703, The Excel sum formula or function.
Okay?
And we specified L2 to L701, sum it up, throw it into that cell there.
And then we saved it.
Super important.
Have to save it.
And just remember, the issue that we had was that we tried to save it while the document was open, in Excel itself.
And it won't do that, okay?
It won't save, you'll get an error code.
Now to implement max_row into this sum, we then did something similar, okay?
We just rebuilt this entire line here, but substituted the actual cells, with the max_row command.
Alright.
So we put in max_row here, to get our cell that we wanted to put the actual data into at the end of it.
Then, in order for the calculation to work so there would be no sort of conflicts, we then took max_row minus one, so we wanted the max_row but this, the cell above it and that should get us the last dollar value and then there would be no overrides and no sort of conflict, okay?
So there we go at the minus one to prevent clashes with calculations and then we saved it again.
Now obviously, this is not fool proof.
This is just working for this specific spreadsheet.
You'd obviously have to do those checks in detail for yours.
Okay, now it's your turn.
So what can you do with this?
Well, I think and I pretty well used use case, something that's obvious, would be to monitor a spreadsheet.
So a lot of places might use Spreadsheets for things like say, rosters or financial tracking or your budget, so you could potentially use a script to monitor a certain cell or to add data in as you go, just to come up with with something intuitive, something interesting to do.
I think a budget is a really good example or some sort of a rostering system.
So have a play with openpyxl, see what you can insert and add and edit and whatever to an Excel spreadsheet and do that for Day 3.
Just how.
|
|
|
|
22:24 |
|
|
show
|
1:07 |
Welcome back to the 100 Days Of Python.
Wow, Day 73, you're making great progress.
The coming 3 days I will be your guide, to teach you how to use Selenium in Python to automate some cool tasks.
After some basics, we dive straight into a practical example, where I will show you how you can use Selenium to login to a website.
In this case, Packt, where I got some E-books piled up that we will grab with Selenium, making them downloadable from the Command line.
That's already pretty cool, but then we will look at a second application.
We log into the PyBites banner app, which is a Flask app, we simulate using the forum manually by posting the variables straight to the server.
And it comes back with a banner, all in a automated way.
And that's pretty powerful.
But if you need, like, to make 200 banners, a tool like Selenium can save you a lot of time.
So this will be a very practical lesson, a lot of code, and will be a lot of fun.
And at the end of it, I will have some practical exercises, so you get your hands dirty with Selenium.
Let's dive straight in.
|
|
|
show
|
2:04 |
Alright, o get started, you need to install Selenium.
So I suggest you make a virtual environment.
So I made a selenium subdirectory.
And I'm using Anaconda.
So I have a special alias to do this.
If you're on a typical Python 3 installation, you probably use something like this.
Which is fine, right?
It's not working for me.
So, I'm using...
all right.
That makes my venv, and let's enable it.
I have an alias for that.
Because I'm working with virtual environments all the time.
And deactivate is under tabs.
and activate is not.
So, that that, There's nothing installed.
So now I'm doing pip install selenium.
And that should be all we need.
No dependencies, just a clean install one package.
All right, one other thing though is, before I was using PhantomJS.
But using Selenium again after awhile, I got this Selenium support for PhantomJS has been deprecated error.
So I downloaded this Chrome driver.
And the only thing you have to do is put that in your path.
So here you download the binary.
So with that driver downloaded, I can extract that somewhere that's under my path.
And if that directory's not in your path, you can put it there by doing in your batch rc just for now here on the command line.
export path = whatever is in path already.
Appending home/bin.
Now I'll do a which Chrome driver, you see it's in my path.
That's all you need so that Selenium can work with a headless browser.
And with that, you should be all set up.
|
|
|
show
|
1:11 |
Let's look at the Selenium hello world example.
And let's look quickly what happens when I run this.
And I have to move the browser into my recording area.
I put the PyCon into the search box, hits return, looks at the results and makes an assertion.
Now how cool is that, that it just opens a browser, does all this stuff automatically?
And when you're dealing with web pages you probably want to inspect them so you can do that here, and you can look at the developer tools and here you see that input has a name of queue, so that's Selenium here is finding.
Sending PyCon, hitting return and no results found should not be in the driver page source.
So here to back to the results.
Yes there are results for PyCon obviously.
And the talk a lot about automating tasks, but one of the most common use cases is actually to automate your testing, go through your dev sites, filling out forms, looking and returns and automate that as part of your functional testing.
So that's the hello world example of Selenium.
|
|
|
show
|
6:48 |
All right, let the fun start.
Let's look at a more practical example.
You're probably familiar with packtpub.com.
They have a daily free eBook I've been collecting the last months, and I got a bunch of eBooks on my account, but my account obviously is behind a login.
So let's write a script to log in to Packt.
Reach out to my account details.
Go to my eBooks, this link here and make a list of all the books it finds here.
Then, we retrieve the book titles and URLs, so, let's get coding.
First of all, I don't want to store any password and login into my script, so we need to load them from the environment.
One way you can do that in Python is with import os, os.environ get and let's say we call it packt_user and Packt_password.
We store them in user and password.
And you see, I already set them in the environment.
I will show you how to do that next, so let's go back to the terminal and make sure you have your virtual environment deactivated.
And go into venn/bin/activate.
And go to the end and do an export of packt_user and export packt_password.
And if you want to follow along, make those the values of your login, save that.
Activate the virtual environment again, and I'm using this alias, and now, you should have them in your environment variables.
And it means they will be accessible to your script.
All right with the user and password set, let's log in to the site.
So this is the login site and let's initialize a driver.
And let's get the page, then on the page, let's find the actual login form which we can do with find_element_by_id.
And first I looked at the page source to see how the user and password fields are named.
And they have them named as edit name, and you want to send the keys, basically sending data into that form input fields, user.
Here we do the same for password, and the password field is named pass, and here we want to send it our password, and importantly we want to make sure we hit enter after that last value, so by running Selenium it opens the browser and goes to the login page, and there's my email and my password, and click enter.
Look at that it logged into my account.
How cool is that?
Now we're logged into the page and move on to find my eBooks.
As we saw there is a link on the page, My eBooks, so we just need to find that link and click it.
Before running that cell let me show you where we are now and what that page looks after clicking.
Now, we are in account details.
Click the cell.
Now we're in my eBooks.
How cool is that?
I'm navigating this side through Selenium.
Let's move on and extract the books.
I'm going to use find_elements again, but now by class names because I saw that the books are in a class product-line and that's in elements.
Right, couple of Selenium web elements, cool.
I can write a dictionary comprehension to actually I extract the nid, N-I-D, kind of the identifier, practice using and the title.
I'm going to store that in books.
I'm using the get_attribute, nid as key, and title as value.
for e in elements.
Look at that all the books of my account.
Good I think we're done now, so let's close the driver, and that actually closed the browser.
Alright, so and boom.
You cannot see it, but that closed my Chrome Browser I had open.
Now that we have the data in a structure, I can just write a little bit of code to get the book.
And to keep the focus on Selenium, I'm just going to copy that code in.
We have to download URL which I extracted from HTML.
We have that id and the format of the book we want.
Possible formats are PDF, EPUB, and MOBI.
We write a function called get_books, grabbing my books for a string and checks if the book format is correct and then it just looks through the titles.
Does a regular expression match on the title and it gives me the title and URL.
The next step would then be to actually download the book to my desktop, but that's out of the scope of this lesson.
Let's try it out.
As just a regular expression I can get a regular expression like searches.
I want all the MOBI files for Python Data Books.
Nice.
I want the books for machine learning and I want the format of PDF.
It should also work in uppercase.
There you go.
A little useful script.
I don't spend too much time on them here because I want to really focus on Selenium, but the point is that once Selenium loaded your data into a structure or you can dump it to your database table or whatever then it's just easy to write a function to work with that data.
|
|
|
show
|
6:58 |
All right, I got another cool project to show you Selenium in action.
A while ago we made a banner generator with Pillow and Flask.
And you can read about that in this blog post.
And, the thing was, as we were making banners repeatedly, we just made a little Flask app, we enter some data, and it generates a banner.
What if you can automate that using Selenium?
So, again, it's pretty similar as last time.
We need to look into the site.
Well this one is actually cooler because we are going to provide data in a form.
So we're actually going to submit this form doing a post request with some data, and then it will return our banner.
Let's get that working.
Similar as last time, you need your login to be loaded from the environment.
You don't want to hardcode that in your script.
So, in this case, already done that.
So, I got my user and my password.
I'm keeping secret here see the last video how you load those into your environment, putting them into your virtual environment's activation script.
At this notebook I'm not going to do much validation, but you could add something like this.
Class, no login.
Extends exception.
Pass exception.
And then, if user is None, or password is None, raise a no login...
exception, and tell the user to set...
in your end.
Right, so that's a little extra if it would be like a script you're going to run.
But let's focus on Selenium again.
Here's the site.
It's an app we host on the Heroku app and the route to the login page.
Again we need to initialize web driver, Chrome.
We get to the login page and, again, this is pretty similar as last time.
We need to look at the HTML.
Let's actually do that.
Right, so we want to right-click here and go to inspect.
There you see that this is an input field.
And, the name is username.
And the name of the second field is password.
And those are the fields you want to specify for Selenium to go find.
So, try, find, element...
by id...
username...
and we want to send it my user...
string.
And the same for password with the difference that we need to send our password and hit enter.
Return.
Running this opens the browser.
It logs in and that's it.
Next up, needing a little helper to create a title.
And if it's not core Selenium, I'm going to just paste it in.
In this exercise I want to make a PyBites news banner and they're typically of the format news, year, week.
And to get a week, I use isocalendar.
So, basically what this does is, it gets me news and then the current year and the current week.
The same for the variables.
I'm going to copy them in.
The news option corresponds to the dropdown.
So here we have a dropdown of different types of logos or banner types.
So we have special, news, article and challenge.
And we want the news one, so we have to specify that in the script.
So the news option is pybites-news.
That's the literal option of that select box.
I defined the background image that will show up on the banner and we're going to call the banner from PyBites import news to enter digest and we pass in the year and the week.
Which is nice.
We have strings that you can just embed your variables.
And now the actual Selenium coding.
Driver.
find_element_by_id.
Going to find a name, oh that's this guy.
We're going to send the get title which is the function that this is actually stored at.
Just pass it around.
That's better.
Then I'm going to find...
element...
by xpath.
I'm going to copy this over.
It's a bit tricky.
That's something I needed to work with select options.
So go find the select box called image URL one.
And again, you can use the web tools to see what the actual HTML looks like.
So the select box is image on the score URL one.
Go grab that one and take the option with the text news option and click it.
So an input field is easier, but a select box is actually two actions, right.
You have to find it and click on the right option to get that value, to get it selected.
Compare that to, again, another input element where I can just say...
send keys.
It's just way easier, right?
And I send the banner text.
So I'm sending that here.
And finally, I want to set the background image to that beautiful snake we saw and that field is called image_url2.
I'm going to send that to keys background image.
As it's the final one, I'm going to hit enter.
Alright, seems I didn't have year and week in the global scope, so let's define those quickly here.
And look at that, the banner got created.
Let's show that once more.
It logged in.
Put all the data in the form and submitted it.
And it created this banner all automatically.
And let's not forget to close the driver when we're done.
And that closed my window.
Okay, how cool is that, right?
A banner completely automated with Selenium.
And I hope this gave you a taste of what you can do with Selenium and let's review next what we've learned.
|
|
|
show
|
1:54 |
Right, let's review what we've learned so far.
The most basic example of Selenium, the hello world, so to say.
You create a driver object.
You go to Python.org.
You find the search field, named queue.
You populated the data and we submit it by hitting return.
We saw that Selenium actually opens your browser.
You see it doing it in real time which is pretty cool.
And here we make assertions based on the page source that changed after the action.
Now we're going to do a more fun and practical example, scraping my Packt account which you see here in the logged in state.
We retrieve the login URL and loaded user and password from the environment variables and send them to the login form.
We submitted the form by hitting enter.
Then we found the My eBooks link and clicked it to actually go to the my eBooks site you see at the left.
We identified the HTML that contains the books and did some parsing to get all the titles and their ids.
And this is pretty cool to further extend to make a download app or whatever.
And the second app was the PyBites banner generator which we fully automated using Selenium.
Again, we logged in with the credentials.
We found the corresponding HTML.
In this case, we had to populate the form to send data to the server.
And finally we closed the driver.
This led to an automated banner.
Awesome because, imagine you have to create like 200 for some campaign.
Well, with Selenium, it becomes very easy.
And now it's your turn.
Keep calm and code in Python.
|
|
|
show
|
1:16 |
Welcome back.
In this second and third day, it's time to get more practice with Python Selenium.
Notice that Selenium is a super important tool often used in addition to functional testing.
I've not really explained that or demonstrated that so far, but you're going to just play directly with it because I have a nice code challenge for you.
First, take a quick look at this documentation section: Using Selenium to Write Tests.
Then head straight to our Code Challenge 32.
This is our first Django app we did.
So, we made a little scraper of Planet Python, and made a app to keep track of what we were sharing on Twitter.
That's basically a listing of articles where we can say we shared 'em or we skipped 'em.
Very simple, but it has a login.
So, it's a nice app to do some testing on.
So, you'll be asked to log in, look at articles, look at various states the articles are in.
Look at the HTML of the page, etc.
And the whole write-up is here.
And I think it's a great exercise to practice more with Selenium.
And that's it.
Try to do that one today, or even the third day if you lack time.
And, I'll see you tomorrow.
|
|
|
show
|
1:06 |
Welcome back.
This is the third day of the Python Selenium lesson.
I hope the exercise of yesterday to test our little Django app was not too hard.
If you're still working on it, no problem.
I think it's a good workout so then just use this third day to complete that.
If you're done or you're bored, you want something else, we looked at two core examples in this lesson, Packt and automated banner generation.
Maybe you want to try those, build them out, or maybe even better scratch your own itch.
What are some of your boring stuff that you can automate and write tools for?
Maybe you have a log in you want to automate to your favorite site or social media, retrieve some data, or maybe even post some data.
The options are endless and the best you can do is practice some more because it's the practice with the new technology that makes you a master and it's also the most fun.
So enjoy and don't forget to share your work.
Use the #100DaysOfcode and feel free to include @talkpython or @PyBites in your tweets because we would love to see what you come up with.
Good luck and have fun.
|
|
|
|
23:35 |
|
|
show
|
0:43 |
Good day guys, this is Julian Sequeira again and welcome to Day 76, 77, and 78.
In this three part segment, we are going to be building a Flask app.
For those of you who may have taken other courses, this is one of my favorite themes.
So, I'm really excited to be teaching you this one.
The basics here, we are going to just build a really simple Flask app but we're going to use Jinja2 templates straight off the bat.
We're not just going to deal with the basics.
And then we're going to deal with dictionaries and how to print those variables, how to print that data straight into a Jinja2 template that way your actual website has some functionality.
So, let's get right into it and start coding.
|
|
|
show
|
1:56 |
This is the ReadMe for the course, for the Python Flask introduction.
This is going to guide you through the next 3 days, so obviously we have the videos coming, but there are some little things you should know before you get cracking, so looking at these days here, the first thing you're actually going to do is set up your environment and then create your first Flask app, okay?
It's quite simple.
You'll probably complete these very quickly, but there are a few concepts that you should know, so just follow along with the videos and then play around with your Flask app.
What I'd like you to do on the first day is start thinking about potential CLI scripts, maybe apps that you've already written for the command line, and then see how you can Flaskify them, turn them into Flask apps.
Just have a think about that one.
For the second day, what I'd like you to do is go through the videos, and you're going to be working through dictionary data, how to pass that data from your Flask app into your Jinja template.
This is very, very critical, so it's a good day to dedicate just to that, alright?
And play around with that, see what else you can do with it.
If you want to dive into the more advanced functionality, you can, with databases and whatnot.
But really, that is your Day 3, so freestyle, go nuts.
The CLI app that you would've thought about on day one, actually try applying Flask to it.
Try that on Day 3 and maybe throw in the database thing that you probably played around with on Day 2.
So see what other cool advanced techniques you can discover and learn with Flask, and see what you can implement on existing apps.
That's your Day 3.
And with that, just pop on over to the next video.
|
|
|
show
|
1:55 |
Alrighty, before we start any of the programming we need to do a little bit of set up, okay?
You can have a look at the, what you see on the screen here, and you'll see that I've got a bit of a folder hierarchy set up.
Now Flask, in order to operate, it needs the route directory.
Now we're sticking really basic here, okay?
What you need to do is you'll have an, I want you to create two files, first and foremost.
Wherever you're creating your Flask app, I've created it in this directory here.
I want you to create an app.py file, so that's this one here, app.py, and a data file, that's for the next video.
All right, and then also create a templates folder, like this one here, and inside create a file called index.html.
You can use whatever editor you want to create these files, just go ahead and create them, and leave them empty, all right?
When you're done, it should look something like this.
And the one thing we're missing is we haven't actually installed Flask, so let's install that now using pip install.
Actually, what have I forgotten?
I've forgotten my virtual environment.
So shame on me, shame on me.
So, Python -m venv venv I'm just creating a virtual environment called venv.
And there it is there.
Now we can activate that, activate, and now it's running.
Now we can install Flask.
pip install flask, installs everything it needs, including those lovely Jinja2 templates, and there we go.
As I mentioned the Jinja2 templates, that is what this directory is for.
So technically yes, this is a HTML file, but it's going to behave like a Jinja2 template when we get to it.
All right, move on to the next video and let's get cracking.
|
|
|
show
|
6:30 |
Okay with the files created, app.py, data.py, and index.html let's get started.
Now the first thing we need to do as with any application is pretty much import any of the modules that we're going to use.
And in this case it's Flask.
Now Flask has so much to it that, you know, it's not really that Pythonic to import everything.
So we're going to tell our application what we're importing here.
And specifically we want to import Flask itself, you know, go figure and we want to install the render template.
Now this is what allows Flask, your flask app.py file to communicate and work with your index.html Jinja2 template.
All right, now we need to actually create our application, our Flask application object.
Now everything that runs in your Flask app is running pretty much underneath this app that you are specifying here.
Now this name here can be whatever you want, you know, so I'm just using app 'cause it's pretty self explanatory.
Now, we're going to use this name dunder to say it's this file, it's this app that's going to be assigned to this variable here, to this object here all right.
Next up, and we're almost done actually believe it or not, we have to specify a function, okay, just ignore that decorator for one second, just one second.
And all right, so this is our index function.
Now I've named it index because, it's going to be the function that operates the route directory of our website.
The forward slash of our website, the home page of our website.
However you want to phrase that.
Now the app.route decorator, what this does is it assigns this path, this route according to Flask terminology.
It assigns this to this function so when you access this page, this is the function that's going to run.
Okay, so now you're starting to visualize how everything ties together, all right.
Now what we need to do is we need to return something to send to that page and how we're going to do that, well we're going to return.
Now if we wanted to make this super simple, really basic, we could do something like this.
All right, hello world, now what this is going to do is this is going to ignore that index.html file because if you, as with anything, we haven't specified index.html anywhere in this Flask code, in this Python code.
So how does this application.py file, app.py, how does it know how to talk to that index.html file?
Well right now it doesn't.
All that's going to happen when you run this is it's going to print hello world in the top left hand corner of your page and that's it.
We don't want to be that boring, well, it's going to be that boring but in a different way.
So what we're going to do is we're going to actually tell our Flask application that when you get to the route directory of your website, you're going to load index.html.
So now we, anything that this page presents the HTML is going to be in that index.html template, all right.
You can imagine what we're going to put in there.
So now the one last thing that we are missing is the line of code that actually tells our program to run.
app.run().
Oh come on, got to get that right.
This app is this.
You can see this variable being referenced multiple times now.
Everything is linked together via this object here.
All right.
So app.run() if you don't have that, if you comment it out, it's not going to work.
Your website's not going to run when this file is invoked, okay.
So all that's going to happen now when we run the website is we're going to hit the route page it's going to load that HTML file, and that's it.
Nothing will, you'll actually get a blank page because we haven't specified what to run, all right.
So here's our index.html file that we've created.
I've opened it up in Notepad++ and all we're going to do is put some really basic HTML in there.
So never fear if you've never worked with HTML.
Let's get this really, really basic.
Going to open the body tag, I'm going to throw a paragraph tag in there and we're going to say, "Hello planet." Yeah, let's, let's be slightly different, all right.
And close the body tag and we're good as gold.
Now let's actually try and run the app.
To run it all you actually have to do is hop into your command prompt, or whatever you're using, and just from your app.py file just like any other Python script, Python app.py.
Bang, now this line here tells you the default IP address that Flask uses for your website.
So it's launched the web server and it's going to respond on local host 127.0.0.1, port 5000 all right.
Now that we have port 5000 ready, we'll bring up this that, here's one I prepared earlier and we're going to hit enter and that's it.
How simple is that?
So if you think about it, we've just got just a handful of lines of code.
So you've got a couple of lines in the HTML file, a Jinja2 template, and this and that is your Flask website.
So what I'd like you to do now is have a play with this.
Just play around with it, that's your day.
Follow along with the video, run your very first Flask website, and see how you go.
On the next video, we're going to deal with some actual data.
Very exciting.
|
|
|
show
|
9:47 |
Okay, now we've got our site, let's make it interesting.
Let's deal with some actual data.
So, earlier I got you to create a data.py file.
That would be this one here.
It's nice and empty.
So, this is where we're going to create our data.
As you can imagine, with most applications, you're not going to have the data inside one file.
Everything's going to be spread out.
So, let's put the data in one file here, and we're going to call it fav_beer because that's what I wish I was drinking right now.
So, what's my favorite beer?
Let's run it through.
So, I'm just creating a dictionary here, a dict, that has a name as the key, and the type of beer, or the name of the beer, as the value.
So, I'm just going to populate this with five entries and show you that.
So, here comes some magic.
And we are back.
Take a look at that.
So, I've populated this quick dictionary here.
Going to save the data.py file, and then we're going to call it in our Flask app.
We're going to import it, okay?
So, what do we run here to import it?
We're going to go from, woops, clicked in the wrong spot.
We're going to run from data, the data file, we're going to import that actual dict, all right?
So, you can, deer.
I don't like deer, I like beer.
So, you can imagine if you had multiple variables, or dictionaries, or lists in that file, you would import them here, all right?
So, from data import fav_beer.
Now, how do pass that dictionary off to the Jinja2 template?
Alright, we're going to do that in this rendered template, 'cause we're returning, we're returning that variable.
We're going to return this dictionary to the template, we're passing it off, handing it off, all right?
If you could've seen my hand gestures just now, it would've been hilarious.
So, fav_beer.
But is that right?
Not quite.
With Flask, you've got a bit of a special way of specifying these variables, all right?
So what we're doing is, at this point here, we've said fav_beer=fav_beer, right?
Now, what we're doing is we're assigning the fav_beer dictionary to the fav_beer object that is going over to the template, okay?
That's just how it works.
I know it looks odd, and I know it probably is a little bit confusing, but that's how it works.
You can't just say, you can't delete this and just have the one object going across.
You have to tell it, okay, I'm assigning this object, this data, this dictionary to the actual Flask object that's going to be accessible from the Jinja2 template, all right?
So, that's actually nice and easy.
That's all we have to actually edit in our Flask app.
Then most of this is actually done in the index file.
So, let's bring up Notepad again, where we've got this.
Now, I'm going to do a bit of magic here again, because I don't want you to see me have to type all of this stuff out.
All right, so let's just add in a whole bunch of extra HTML stuff to make the page a little nicer.
Let me do that now, and fade to black.
And we're back.
So, look at this, I've thrown in a head tag, I've thrown in some extra lines for style sheets, okay?
I did not want to have to deal with CSS myself, so I've gone to bootstrap and grabbed all of their yummy style sheet stuff, all right?
We've thrown in title, favorite beer tracker, and we've got our body tag.
I've done some in-line CSS here, just to add a margin on the left of 50 pixels, got a H1 tag header in there.
Now, if we run this, let's just see how it looks without any actual Python code running here.
So, we'll quickly go back here, run Python app.py, kicks off the server, normal 127.
Bring up my browser, load that, and bang, favorite beers.
We've got that little margin here, got the H1 tag, and we've got the title up there.
Now, how are we going to do this?
How are we going to present that dictionary worth of data?
We have a key, we have a value.
Well, you can think, you're probably going to want a table of some sort, some sort of a spreadsheet.
We'll go with a table, that sounds nicer.
Now, to run a table tag, we run, we'll type this sort of thing in there.
Now, I'm just going to quickly copy and paste this specific bootstrap tag, which will make our table look really nice.
That way, I don't embarrass myself.
All right, chuck that in there.
Now, we're going to create the table row.
Now, you know, for this you do need some basic HTML, but you know, just head to W3 schools, or what have you, and you'll have yourself up and running in no time.
So, we're going to have a table header called name.
I'm going to have a table header called beer, or beverage.
We'll go with "beer of choice," I think that works better.
All right, close off the table row.
Now, how are we going to do this?
You think to yourself, we've got a dictionary that could potentially grow.
If this was some sort of a production thing, it's going to grow, so we can't manually specify every single line one by one.
This is where the Python code comes in.
Now, we're going to run a for loop, just like, if you could imagine, for a script on the command line, you're going to run a for loop to print out all of the keys and values of that dictionary.
We're going to do that now, but we're going to do it with a table wrapped around it.
So, no matter what data gets added to our dictionary, this table will grow every time the page is launched, so that's pretty cool, right?
So, to run Python code within the Jinja2 template, there's a certain format, and that's the left curly brace with a percent sign.
If you see that opening on one of these Jinja templates, that denotes you're about to execute some code.
So, for name and beer.
You could write for k,v, whatever you want to do.
Remember, these are arbitrary.
So, for name, beer in fav_beer.items.
That's how we open the dictionary to access the keys and values, and then we close that off.
Now what are we going to do?
Well, every time you pass through this loop, you're going to create a table row, and in that table row, you're going to create one cell, so to speak, and the first one is going to be titled "name." So what this is this is a substitute flag for the Jinja2 templates.
So, anything that goes in here within these two brackets has to be a variable.
So, we're going to put in whatever the key is, name.
So again, if you put the letter k there as you normally would, you'd put k in here.
So, the name from that name key in our dictionary is going to pop into this cell here, all right?
So, TD and the next one is going to be our beer, all right?
And that's it.
So now, no matter how many people you add to your beer tracker table, or dictionary, I should say, this table will grow every time you reload the page, all right?
So, let's close this off, and now, we can close off the for loop.
Now, this is very important.
If you do not close off the for loop, your Python code will fail.
It will tell you that there was no closure of the actual for loop.
And last but not least, we close our table.
And that, my friends, is it.
Now let's launch it.
So, to do that, we make sure we save, make sure everything's saved, go back into app.py, and we rerun the script, and there you go, it's run the web server, load up the website, bang, look at that.
We have this nice, cool table.
Julian likes White Rabbit Dark Ale.
Mm, yummy.
Bob, I'm guessing, likes some sort of light beer, I assume, 'cause that's Bob, right?
Mike B.
From Oregon, well, Oregano beer, Oregano beer?
I have no idea.
And Cornelius and Dan, who happen to be friend of mine at work, like these beers.
So, that's it.
That was dealing with data, with a dictionary, and passing it to Jinja2 templates to create yourself a little bit of a front end.
So, this is really cool.
This is now where you can start seeing your own application.
|
|
|
show
|
2:44 |
Alright.
Let's quickly cover off everything we've learned and leave it to you, So, a basic Flask app, that's pretty much what we did.
Okay?
We did add some data in there, which is what made it a little more fun and approachable and usable.
So the first thing we had to do is import Flask and render_template, as well as the dictionary information.
The render_template we will get to.
We then declared the Flask app object and importantly, we added that app.route decorator to the index function and that allowed us to get to the URL of route and execute this code, and then we returned the dictionary to this index HTML, using render_template.
That was very important for us to talk to the Jinja template and finally we ran the app with app.run().
Remember, you need that line.
Don't forget it or your app is not going to run.
As for the Jinja template, the HTML, I've narrowed in on just the important parts here.
Alright, we create the table using our normal HTML and css, whatever it is you might use, and then we execute the Python code.
Alright, so we've got our for loop there, to pass through, to iterate through the dictionary and the items so keys and values, and remember, super important, your curly brace with the percentage sign that denotes the code that will be executed.
We then use these substitution brackets, these double curly brackets on either side and that's how we print or display the data in this key and this value within this for loop, remembering that every pass of this for loop is going to create this table row with the data.
Alright, and finally, just as important, you have to close the for loop.
You have to end it using this syntax, endfor.
And when we run it on 127.0.0.1 local host, port 5000, this is what we got, really, really awesome stuff.
Okay?
And now it is your turn.
Take everything you've learned and try to make your own app.
Try and make your own custom app based on some sort of a dictionary or list or whatever you can think of and enjoy that for day three and move on to the next video.
|
|
|
|
32:10 |
|
|
show
|
1:03 |
Welcome to SQLite 3 Databases.
I'm Julian Sequeira and I'll be walking you through possibly one of the most fun and satisfying libraries you'll deal with on your Python journey.
I say that because at this point you'll be looking at persistent data, more so than just a simple text file or what have you.
SQLite 3 Databases allow you to actually use your SQL knowledge to give you self-persistent databases.
It's as simple as that.
It's exactly what you expect if you've ever dealt with databases before and it's really, really simple.
So these three days you're going to be creating your first SQLite 3 database and then you'll be learning how to inject data into a...
Print the data out and I've also included a couple of really cool scripts that you should help you automate some of your SQL journeys and also it should help you, help guide you through your SQLite 3 learning.
So enjoy and get cracking.
|
|
|
show
|
2:08 |
All right, here's how we're going to break down these 3 Days on SQLite3 Databases.
So to start off with you're going to install SQLite db browser.
All right watch the video on that, get it done.
Then you're going to create your first database, or your first sqlite three database, anyway.
And that's going to quickly be followed by a script that generates a database for you.
So I'm going to demonstrate that for you, and it's actually quite useful so, enjoy that one.
For Day 2, what I'd like you to start doing is inserting data into the address book.
Okay this is the address book database that you were going to create in Day 1.
So Day 2 is, so Day 1 is going to be create the database Day 2 is going to be insert data into the database, okay?
And it's then going to quickly be followed up with extracting that data, so pulling the data out with select.
Okay, all that's explained in the videos.
Now, Day three, what you're going to do is apply everything you've learned into your own project.
Okay, so by the end of Day 2 you'll have created the address book and you'd be able to pull data out and insert data into it as you wish.
So now, try and replicate that with something else you can think of.
Okay copy as much as you want.
Remember the purpose here is to just practice with the code and once you have that down if you still have time for Day three, figure out how to edit the data in the database, okay.
So a quick one here is we are inserting and extracting the data, we're not editing it.
Okay we don't cover that in the video, so that's a nice little stretch goal for you.
So do your googling and play around with it and see if you can edit the data, that's your challenge for Day three.
And that's it, so those are really the basics of sqlite three, move on to the first video and enjoy the next couple of Days.
|
|
|
show
|
1:13 |
Let's get started.
The first thing I need you to do is open up your browser and head to sqlitebrowser.org.
It's this website here.
And this is for a database browser for SQLite.
It's a sort of GUI, a graphical user interface, that allows you to see the contents of your database.
And this is important because sometimes when you're checking things on the command line, it's quite difficult to figure out.
You get that visual representation of the columns and how everything looks like in the table.
Looking at this screenshot here, this is a Mac screenshot.
You can see there's your table here called Total Members.
There's the different columns and so on.
Now, we're going to use this a bit later on, but this is pretty much the only setup step you're going to need to do.
So go ahead and download it for your operating system of choice.
I'm using Windows, obviously, and my one, once installed, looks like this.
Okay, no database is actually loaded into it.
We can use the open database button here to load one in once we actually have it.
But for now, just get it installed.
That's sqlitebrowser.org.
|
|
|
show
|
7:13 |
Okay, blank slate, here we go.
The first thing you need to do is create a Python file called simpledb.py.
That's this file here in your project directory that you're going to use for this video.
So you see I've got simpledb.py.
Next up, we're going to start our virtual environment, so Python -m venv venv Now we're not actually going to be installing any third party modules or anything crazy so, I suppose technically the virtual environment isn't necessary but, for me, I always do it no matter how little the project is.
So we'll activate that, venv\scripts\activate and now we're safe.
Now what we can do is we will actually launch the Python shell just so that we're using it in here.
There we go, Python 3.6.
Now technically what we're about to do here is we're about to use commands that we could sort of run in this virtual shell here.
But I'd like to actually run these commands in a script just to show you how it works in a different sort of way.
So just bear with me.
The first thing we're going to do is create a database.
It's the first day of SQLite 3, so let's create a database.
We have to do that to work with one, right?
What we will do is we'll just throw this in the top, and we'll import sqlite3.
That's it, that's pretty much all we need to do to create our database.
It's all we're actually importing.
Now, I want you to visualize this.
Don't just read what I'm going to be typing here and what you'll be following along, I'm going to use the full form words just so that it makes sense.
Alright?
We're going to create a connection object and that object is going to store our actual connection to the database.
Think of the database as, you know, some sort of a, something you have to tap into, right?
And in order to do that you need to create a connection to it just like you connect to the internet or what have you.
So we're going to connect using the SQLite3.connect command and this is now where we specify the name of our database.
So let's, for this exercise, let's create an address book.
Address book with your name, your phone number, your address, maybe.
And let's call it addressbook.db.
There's our database.
Now what this command does is sqlite3.connect addressbook that is actually going to create this database if it doesn't exist.
If this database did exist, it would just connect us to it.
Which is really cool in that if it doesn't exist it thinks "Well, hey, you just want me to create it, "so I'll create it." And we're going to store this connection, this connection to this database, in the connection object.
Now, in order to parse the database, P-A-R-S-E, in order to parse the database, we need to have a cursor.
So just like this cursor here allows us to move through text and say Microsoft Word document, or what have you, we need this cursor for the database.
And using this cursor we can execute commands.
We can send commands to the database to do certain things such as select information, overwrite information, create things, hint hint.
But we need to store that inside another variable.
Generally the rule of thumb is to just call this cursor c, and that cursor is part of connection.
So part of our actual SQLite 3 connection.
So, connection.cursor.
c =, or c is assigned connection.cursor.
Now, as I hinted, we want to execute commands.
So c.execute.
Now in the brackets here, what are we actually executing?
This is where you actually start to use your SQL commands.
We're going to put those within a few of these, 'cause it's going to be multi-line.
And the first SQL command is create.
Because, what are we doing?
We're creating a table.
And now, this next word we're going to type in is going to be the name of your table.
So within our address book database, we have a table named, let's call it details because I have no imagination.
Now, we have a table named details.
That's what this command is creating.
Now what do we want to be in that table?
Well, I can imagine in my address book I might have a name.
So creating, pretty much we're creating a column here named "name" in our table.
And that name, what kind of information is going into that name?
What type of information is going into that name column?
Well, it's going to be text.
Same with the address.
We want an address column.
And that's also going to be text.
But our phone number, while that could be text let's just shake things up a little.
That's going to be an int, an integer.
So that's it.
Or so you think.
But then last thing as you know from some of you other Python work so far is that you actually need to close your connection.
Now, to do that, as you'd expect, connection.close.
Nice and straightforward.
And that is so simple.
So as I mentioned before, all of this, all of these commands that we're typing in here, all of this Python code, it's actually stuff you can run on your Python shell, in your Python shell, I should say.
But we'll put it in a script.
That way, we can just run the script from the command line.
We'll go directory here, let's see, there's our simple db.py, and let's run Python simpledb.py.
And look how quickly that returned.
I hope it actually did something.
Now we should have a database called addressbook.db.
Now this database is completely empty because all we've done is create a table with name, address, and phone number, but no data.
So let's open up SQLite database field, the application you installed, and let's have a look at that.
|
|
|
show
|
0:47 |
So we'll bring up the program here.
I've got mine open already.
Control + O will actually open up our open dialogue, and there is our address book database.
So let's open that up.
You can get a bit of information here, although this isn't the most detailed view, but straight away, you can see there's one table within this database, with the name of details, and it's got these three columns.
So let's actually go to browse data.
This looks more like what you sort of want to see when you visualize your database.
There's the table name, there's our name column, address column, and our phone number column.
In the next video, I'm going to show you how to set this up automatically.
|
|
|
show
|
4:28 |
So for this video, I just wanted to show you a cool little script that you can create to sort of generate your own database files.
Just for testing purposes, right?
'Cause that's one of the great things about SQLite3.
It's super lightweight, and you can use it for testing.
So just create a new file.
All right, and, I'd like you to pretty much use the file, I mean, you could edit whichever way you wish, of course.
But you'll find this file in the course materials.
So don't feel like you have to copy everything I'm typing here, in fact, I'm going to use some of my black magic to make it appear on the screen.
So, I'm going to explain this text to you in just a minute.
But what we will do is, let's save the file as so, create this Python file for yourself.
generate_db.py, all right?
Now, here comes the magic.
Okay, so I know this looks daunting.
So, just don't panic, if you don't know what you're looking at here.
I'll explain things in a simple way, but, I'm going to try and skip over the stuff that isn't really SQLite3 relative, but just bear with me.
Okay.
So we're creating a context manager here.
We're creating a generator.
And that uses a with statement, well that's one way.
It uses a with statement.
And it'll have a function in there with this decorator.
And you can read this stuff up.
We'll link to that in the course notes.
And it will yield something.
In this case, it's going to yield that cursor.
That we use here.
So you've got your connection.cursor, right?
Well, we have that here.
We've just abbreviated it down to con.
Which is generally a standard, right?
So, the first thing that this script if going to do is it's going to prompt you for a name.
So when you run it, it's going to say, well, what's the name of your database?
What would you like to name your database file, all right?
And, you enter in a name.
It returns the name.
And your context manager, this with statement, will create the database using that name.
All right, so runs create_db which is here.
And create_db when invoked is going to set up your connection cursor, all right?
It's going to yield that cursor line right here, with create_db() as cursor so it returns, it yields the cursor into here.
And then now, your width statement, runscursor.execute.
Okay, so this is just a generator, very simple generator.
And then it goes cursor.execute, and it creates a table called test table.
With three columns.
Sorry, four columns.
Column one, two, three and four.
Three as text, and one as int.
And when it's done, it prints.
The database has been created.
This is just a simple, string formatting.
And, again, substitutes the name in, you can see that here as well.
And that's it, that's literally all this script does.
Now, as you can tell, this is hard coded.
And this is why I said this is great for testing.
And this is something I use.
And I will just quickly pop in here and change this if I have to, but for the most part, three text columns and an integer column is more than enough for me.
And I've used this on multiple occasions.
Just to create a really quick, simple SQLite3 database.
Without having to go through, and create it myself manually using these connection commands, all right?
So let's save this file.
And, with that out of the way.
We will run, let's just make sure it's in here.
Python generate_db.py What would you like to name your test DB file?
Well, let's just call it Julian.
Julian.db has been created.
There we go.
Right down there.
Open up our database browser, again.
Let's close this database.
Open up Julian.
And there we go.
We've got test table, with one, two, three, four columns.
It is a very useful script.
You can edit it to something that's much more, there we go.
You can edit it to something that's much more appropriate for you, and for your testing purposes.
But it's a really cool one just to keep handy just in case.
|
|
|
show
|
2:48 |
Time to finally input some data into that address book database, okay.
So I've just opened up a Python shell within that same directory, and the first thing we'd need to do is import sqlite3.
Alright, we need to do that every time we invoke the shell.
Next, we need to open that connection to the database.
So, we'll do that, same style as before.
Connection=SQLite3.connect addressbook.db Make sure you get the name of the database correct, because again it will just generate another database if you don't connect exactly to the same name as you're trying to, okay.
Next, we need to actually create that cursor that allows us to interact with the database.
So, c=connection.cursor And now we get to execute the code.
So, execute, what are we inserting, well what are we doing, rather, we're inserting data into our details table within the address book database okay, and this is all SQL now.
So the values that we're putting in there, now visualize this from left to right column zero and onwards.
Column zero was name, column one was address, and column two was the phone number.
So, the first column is going to be, my name.
The second column is going to be my address.
I promise this is correct.
And, my last column is going to be my phone number.
Don't call me after 9:00.
And, once we're done, we close off the actual execute, the SQL.
And bang we get that nice little return message.
Now, that would normally be if you were, sort of, using that in a script within a With statement or whatnot but, we're doing this all manually so we actually need to commit our session here.
So, connection.commit, now it's actually saved to the database.
Alright, so let's close, connection.close.
Alright, let's bring up our database, now I already have this open within SQLite browser, so lets refresh here using these little funky arrows.
And there's our data.
Let's expand that out so you can see it.
Now, we've got Julian 123 Fake St.
and my phone number, alright.
And that's it, that's how we pop data into there one line at a time, in a very manual method.
|
|
|
show
|
6:22 |
So what just saw in the last video, inserting data line by line, on this Python shell, within this Python shell, is actually quite tedious, right?
Imagine trying to enter lots and lots of data.
Well, you're not going to do it that way.
That was just for demonstrations.
So, what I've done is I have actually written a simple populate_db.py Python file, which again is in the materials for this course, and what it does it actually prompts you to enter the data as it is required, and you can run it as many times as you want.
It actually keeps looping through until you quit out of it.
So, let's take a look at that file here.
Now, let's create it.
You're again going to use some magic here.
You can just copy the file from the actual repo, otherwise, just feel free to pause and tuck this in if you're crazy.
alright.
Let's create the file here.
Let's save the file as pop, woops, populate_db.py Alright, here comes the magic.
Alright, let's take a look at that.
Now, this is nowhere near as complex as the generator one we did before.
So, first things first, as soon as you click on this or run this script, it's going to run the enter_details function, okay, and the inter details function simply starts a while loop and while true, which is always true, right?
Running the script is true.
So while true, it creates an info list, an empty one, right?
We need to set this here because we are going to add to it, in a second.
Now, it actually runs three inputs and this is where it prompts you to enter the data that you want in the database.
So, name=, or name is input, enter a name.
So, when you enter a name, this prompt is assigned to the name variable.
Same with address, same with phone number.
Nice and simple.
Now, for I, we are going to run a for loop for I, in name, address, number.
That's the three variables.
So, it's going to iterate over them.
We want to append I, so append the name for I, so, for name let's just break it down.
So, for name in name here, we are going to append the data within the name to the info list.
Okay, so by running this for loop is where we are populating the info list with these three variables.
Simple as that.
Now, you remember this from the generator before?
We have a with statement, okay, so it's opening the connection, right, and within this width statement it is running connections on cursor, and then it's executing this SQL here.
Now, this is the important part.
So, we are inserting into our details table these three values, but we are not actually.
These are actually wild cards, right, so these are substituted just like you would with a stream, okay, using in the print statement, but with substituting the contents of info.
So this is very manual.
Just think of it that way.
What if info wasn't filled with three name, address, number, three list items?
What if it wasn't?
Well, this wouldn't work.
So this was written specifically for our address book table, details table, because we know it has three columns: one, two, three; and we are going from left to right, name, address book, phone number.
So, if again, if this info was any other way, this would mess up.
Likewise, if someone wrote an address into enter name, and a name in enter address, you're going to end up putting an address into the name column and the name into the address column.
So, just bare in mind those limitations, but the reality is inserting the info list populated with name, address, and number into your database and then it simply prints data inserted to database.
Then, it asks you if you want to stop.
So, if you hit q, in any case, it's going to break out of the script.
Otherwise, it's just going to continue on and go back to the top and ask you the same three questions.
So, let's save this file.
Lets exit out of our shell and let's run it Python populate_db.py So, enter a name.
Let's just give us some white space there.
Now, the name is going to be Bob.
What's Bob's address?
Somewhere over the rainbow.
Isn't that lovely?
And a phone number.
Let's go backwards.
Alright, that's Bob's phone number.
Data inserted to database.
Hit q to quit.
Ooh, there we go.
We go back to the start.
So let's enter name, Mike.
Where does Mike live?
The US of A.
And his phone number?
As per every US phone number I see on TV 555, something else, let's go with 3226.
Data inserted to database.
Alright.
We'll hit q to quit and we get out of the script.
Done.
Alright, and it's safely closed and everything because the SQLite connection was wrapped in that with statement.
Refresh our database table and there we have the new data.
So you can take something like this script, put it into some sort of automation, and then you'll be able to add people, or users, or whatever to your database.
Imagine this in a Flask script.
Pretty cool.
Alright well, enjoy that and.
|
|
|
show
|
2:25 |
All right, now that we have our lovely table with Mike, Bob, and myself in it, and our very realistic addresses, let's actually print some of that data out.
So we're going to do that within the Python shell.
Again, import sqlite3, getting tedious by now.
So, we will run our connection, con equals sqlite3.connect.
addressbook.db.
'Kay, c = con.cursor to get our cursor.
Now to print the actual data within the database, we need to put this into a for loop, okay?
Just bear with me, because we're going to iterate over these three rows, okay?
So, the way we do that, is we go for row in c.execute.
We're going to select data.
Now what data were we going to select?
We're going to select everything from our details table, all right, so for row in c.execute.
Select all from details.
What next?
Well, once it's got the row, we want to print the row.
And that's it.
And there are our three lines.
You've got these, the formatting's a bit off, it's actually taking that data, or the literal, the tuple for that, for that row, you know?
So it doesn't look that great.
So to actually make that look a little bit better, let's just bring that back up to save me some time.
We can actually choose which column to view, so we can go print row...
Zero.
Julian, Bob, Mike.
And once we have this sort of information, you can start to pop a few strings together, you know, start making sentences from these, these sorts of database pulls.
So let's do one really quickly here.
And there we go.
So Julian lives at 123 Fake Street, blah blah blah, and his phone number X, okay?
And that's the sort of manipulation we can do by pulling the data out of the database.
|
|
|
show
|
3:43 |
Okay, done and done.
Let's look over everything we've covered in the past couple of days before you move onto the third day.
So the first thing you had to do was install the SQLite browser, and this little application just lets you load up your database files so you could see everything that was stored in your database in a nice GUI environment.
Now then, the next thing we did was we created a simple database, so I've outlined, I've highlighted the important things you need to keep in mind here.
So first thing, you begin by importing sqlite3 as you'd expect.
Then we connected to the database using the sqlite3.connect, okay?
And if the database that you specify between the brackets doesn't exist, it creates the database for you, very important to remember.
So if you make a typo there, it's going to create a new database rather than connect to the existing one.
Alright, then we actually take the cursor that allows you to talk to your database.
So you've connected to it.
Now you have to be able to type into it, and you use a cursor for that, and you assign that to the variable c, which just makes it a bit easier to type further on within your application.
Alright, then we execute the SQL commands, and this is true for any SQL command that you want to run, not just to create one.
In this specific instance, we created a table with two text columns and one integer column, alright?
And then we always close the connection when we're done.
Very important to remember to close it, 'cause if you don't, then the database may still be in use and may prevent other connections and potentially cause corruption, so we'll always close it when we're done.
Next one, we wanted to add data to the database.
So again we connected to the database using the connect command, and we loaded the cursor into the c variable.
Alright, and more SQL syntax.
This time we're inserting the data into the database and we were inserting a couple of values there.
We were doing two text values.
That was the name and the address columns, and then the integer column of the phone number.
And then we can close the connection.
Now the more Pythonic way to do this is to use a with statement, okay?
And this will allow you to run your cursor and your execute commands, but then it will actually close it by itself.
It'll close it for you, it'll auto-close once the commands have finished running, once the with statement has completed, okay?
So in this instance, it inserts the contents of the list using the wildcards of the three question marks, and you saw that in our slightly automated script for this.
And that's it, so now it's your turn for Day 3.
Go ahead and implement your own database.
Try to come up with something interesting, and see what other abilities you can try and run.
So for example, maybe try editing the data inside the database, so we inserted and we selected the data, but now maybe try and actually edit the data.
I think that's a great challenge for you.
So enjoy, that's SQLite databases, and keep calm and code in Python.
|
|
|
|
27:30 |
|
|
show
|
0:59 |
Welcome back to the 100 Days of Python, Day 82, data visualization with Plotly.
Coming three days, I will be your guide teaching you how you can make beautiful plots in Python using this library.
We're going to take some data from our PyBites blog and I will show you how to first get that data in the right shape so it's easy to just hand it off to Plotly and make some cool graphs that show some insights about what the blog is about, and hopefully that will inspire you to then roll your own, be it with Plotly, or another awesome library, which I will mention, which is Bokeh, and yes, this will be a lot of fun.
It's one of my favorite topics, and having data visualization skills goes a long way.
I mean, there's a lot of data out there, even more now with big data, but if you can show it in a nice way, it's way more powerful.
So, let's dive straight in and learn some new skills.
|
|
|
show
|
2:17 |
As usual, I have a Jupyter notebook prepared for this lesson and first, let's actually head over to the terminal to install the external modules we're going to use.
I'm going to create a directory.
cd into it.
I was explaining before I use a virtual venv with my Python path set to my Anaconda installation.
I'm using Anaconda because it comes with all the data science libraries and Jupyter notebook and all that.
If you're not using Anaconda, you can make a virtual environment just by using the standard module in Python, like this but I'm using this to make it all work with my environment.
Right.
Then I need to enable it.
I have an as for that as well because I'm using virtual environments for anything because I always want to isolate my dependencies.
So, now I'm in the virtual environment and you see a nice indication in my prompt.
As expected there's nothing installed and it's exactly what we want because we want to have all of our stuff in this namespace.
I'm going to pip install feedparser serve to parse our blog feed and plotly to do the graphical work.
That's all now in our virtual environment, so, we can get started.
So, I'm heading back to my notebook and let's import the modules we're going to use.
Right, by the way, one thing I have the virtual environment here enabled that's probably not what happens by default for you.
So, what I did to get the virtual environment inside my notebook, was to pip install ipykernel so then you run this self install script and the name should be your virtual environment.
So, in my case, that's venv and after we started the notebook then I have an option here to select my virtual environment.
So, I put the link here in notebook if you want to work from a similar set up as I have, you should go through this link.
That's it for set up, in the next video, we're going to use feeds bars to pull data from our PyBites blog.
|
|
|
show
|
5:53 |
Let's use feedparser to get the RSS feed of our blog.
And I'm not going to do the live feed because I want you to see the same results if you go through this exercise.
So, I'm going to paste in the actual copy I made.
That said, if you do want the live data, then just go to our blog, pybit.es, or PyBites.
Go to 'view page source' and search for RSS, and we have two feeds: all.atom and all.rss.
I'm using the latter.
The nice thing about feedparser is that you can just call ".parse" and it does a lot of stuff behind it.
Let's see what it does.
Okay, so entries.
Blog feed, my variable.
And let's look at what "entries" has.
And it gives me a lot, so let's look at the first one.
Actually, if you want to pretty-print this, just do from pprint import pprint, and I usually give it an alias.
And now it's spaced out a bit better.
Look at that, what feedparser did behind the scene.
It took that RSS feed and put it in a comprehensible data structure.
Although this is a nice format, there is still some work to do.
For example, the publish date is a string.
But we also have publish parse, but it's at a time, a struc time.
Now, the most convenient way to work with dates is to use datetime.
So, let's write a helper to convert to a datetime.
And I call it just that.
It takes a date string.
A date string here has some time zone stuff, plus zero one.
So, the first thing is to strip that off.
Just put it here so we can see it while I'm writing this.
Date string.
I can split it on plus and take the first element.
We can see this live.
And you cannot see this, but there's still a pending space here, so it's best to always strip spaces that are not really needed.
So, you can see here that it disappeared.
And then, we do a datetime conversion.
And we can do that by strptime.
It takes a string, and the only tricky thing is that you have to give it the format of the date string.
This case, it's a week day, a day, a string month, so like a three-char.
month, Jan., Feb., March, four digits here, uppercase Y, hour, minute, seconds, and let's see what they'll give me.
Okay, the nice thing about a datetime is that it actually prints us a string.
So it's a bit tricky.
And if I look at what the datetime actually is, it's the datetime.
And that's cool because datetime makes it then very easy to work with dates.
For example, let's just return this.
So, I'm getting a datetime back.
What's cool about this is you can now do calculations with datetimes.
So, let's make sure that timedelta also here.
What if I want to...
So, this is the seventh of January.
But if I want to add like three days, right, I could do datetime + timedelta(days=3) And look at that.
I just added three days.
I mean, you don't even want to imagine doing that on strings, right?
It's just not done, and...
no.
It's totally no way to go.
So, when you're working with dates, have it in a datetime format.
Have it in a standardized way that you can easily do calculations with it.
And, actually, for this exercise I just want to have the datetime.year.
That's another advantage you see here.
Ones I have the datetime, I can just pull out different elements from that, right?
So here, I want the year and the month, and I can just access that attribute wise.
So, now I just get a string.
We will use this later to plot the data.
The second helper I need is a get category.
Takes a link.
So, it takes a link, and it extracts the category out of that.
And we have these known categories, code challenge, new, special, and guest.
So, that's the dictionary.
The default.
should be an article.
And here I use a bit of regular expressions to pull the category out of the link.
A raw string, any characters.
A literal .es/ one or more lower-case letters.
+ says one or more, and anything after that.
Now the parentheses will capture this one or more letters into a match, and I can access that in the second argument by the \1.
And I'm doing that on link.
And then, I can just do a nice get on the dictionary, which will look for that category.
So it matches code challenge Twitter, special or guest, if it finds it's cool.
If not, get will return None.
And it then goes to the or, which returns default.
So this will always return something relevant, right?
Or, I find the key in the dictionary.
If not, I will return default.
And that's it.
That's the pre-work we are going to do to important helpers.
Next up, we will go through the feed data, putting it into some useful data structures.
And with that second part of the preparation done, the plotting should be easy.
|
|
|
show
|
4:28 |
So that was some prework, but I have not spoke about yet is what are we going to plot.
And there are three graphs I want to make.
First, I want to make a bar chart of our posting activity, what months did we put more content out, and what months less.
Secondly, I want a pie chart of breakdown of our categories, so each blog post has one category associated, and that will show us what we blog about most.
Similarly, that also is true for tags, tags give an indication what we blog about.
But we use more tags than categories.
One blog post can be a ten tags, so it's a bit more granular.
So it still will be another angle, or another inside into our data.
Next up, there are three exercises to get the data into a format that I can easily make those three graphs.
So first of all, I want to have the published entries.
So I'm going to use Counter, to count all the entries by year, month.
And here's where the helper comes in, because we're going to use a list comprehension, we've dealt with in, I believe Day 16, and we can say pub dates, and make a list comprehension.
And, I can just say for entry in entries, and entries is our complete RSS feed broken down into nice entries by feedparser.
And we saw an entry here, laid out.
So I'm going to look over these entries and for every entry, here's the helper, I'm going to convert to datetime, entry, and I'll take the published fields and what's funny, I'm actually going to prepare to those two, using the dictionary way.
But I should actually be able to do a dot notation which is much nicer.
I put that into convert to datetime, and convert to datetime, it's actually not 100 percent accurate.
It's more like, I mean that was the initial intent, but let's actually call it date, year, month.
Because that's actually what it's returning, right?
So we should make our functions descriptive.
And, yeah let's give the first five to see if I'm going in the right direction.
And I am.
And the nice thing about Counter as we've seen in day four in the collections module lesson, is that I can give it a list of items, and it just does a count.
So if I want to have posts by month, so counter can just get this pub dates list, and look what happens.
Wow.
Boom.
I mean I didn't have to keep track of, well we saw that in the previous lesson right, they can hide it in a manual loophole for all the items, keep in account and etc.
But this is all done, understand the library.
Secondly, we need to break down the categories.
So, similar as list comprehension, we're going to look over the entries.
But instead of getting your month, I'm going to use the other helper we defined and just get category.
And I'm going to do that on the link.
And those are not pub dates, those are categories.
Again, counter is your best friend.
Tags is almost the same, so I'm going to just copy it over.
Tags, that is actually a bit more complex.
Let me go from start, so for entry and entries, and here I have an exceptional case for a nested for list comprehension.
For each entry, loop through the tag.
And each tie has a term, let's lower case that to not have to deal with upper and lower case.
So for each entry, because one entry has a list of tags, I'm looping through this list of tags, and I'm taking out the term.
That's what I'm basically doing.
I lower case that tag, so we have all the tags, for all the entries.
And again, I can use a counter to get that all counted up.
Let's give most common a limitation of 20, and let's print the first five.
And obviously five then is at the top.
Right, that was a lot of preparation but the good news, is that the data is now in a structure that we can easily make plots.
|
|
|
show
|
2:22 |
There's still one extra step to take.
As you see the data now, it's in dictionaries or list of tuples.
And usually for a graph, you want to have two dimensions, right?
You want to have an X and a Y axis.
So it's better to have two lists.
One is the keys, and one is the values.
When I was preparing this notebook, I saw a great tip from Raymond Hettinger to use the zip, with star arguments, transposing to the data.
So this is exactly the kind of data we have.
We have a list of tuples.
And here, he's using a zip with a star on that data structure.
And he gets to transpose the data.
And I'm going to use that too.
Make our list of tuples, in an axis of keys, and a Y axis of values.
So let's write a transpose list of tuples, and takes data.
And it's a little bit of type checking I had to do.
Because data can come in as a list of tuples.
But it can also be a date.
So, if it's date, then I make us as list of tuples.
I'm just making sure that all the data we're going to transpose is of the same structure.
So dictionary should be a list of tuples.
And then I'm going to use Hettinger's trick to do transposed, list, zip, *data.
And I'm going to return the new data.
Let's see this connection.
How cool.
So here we got the X axis, and here got the Y axis.
And this is kind of format you want, to make it easy to plot.
Before going in to plot, one final thing, and you want probably read up the beginner documentation, plotly can be used in offline and online mode.
And for this tutorial, we are going to use it in offline mode.
And there's a special switch to use this in my notebook.
I can set that all with one line of code.
So I do plotly offline init.
Notebook mode, connected equals true.
And with that done, we can start plotting in the next video.
|
|
|
show
|
3:11 |
There is some prework necessary to get to plotting, but we can now do it.
Let's start by transposing the post by month in X and Y axis.
Then it becomes pretty easy.
You can just type data equals a list, bar, taking, X equals X, Y equals Y.
You can then say plotly offline, you have to specify the mode, iplot, data, and you can give it a file name.
Look at that.
Even has numbers if you hover over the months.
It also posted when I was preparing to a URL so you can access those here.
That's a nice feature of plotly that you can make your work easily accessible.
Let's move on to the breakdown of the blog categories.
The code is very similar actually.
I'm going to use my transpose helper.
X and Y now make a bit better naming labels and values.
Again I use the go object but this time I calls with pie and I give it labels equals labels and values equals values.
Then we call plotly again, offline mode, iplot, put the pie object in the list and give it a file name.
Look at that.
Challenges is our big thing, you probably know by now but we do as many articles, relatively.
We have news and some special and guests.
Thirdly, the comment tags, similar code and to transpose list of tuples, and here I have to take the top tags as we find before.
Tags equals go, again I do a pie chart and I could be using other types of graph but I find a pie chart being adequate for this type of data.
I also want to keep it simple.
So, in the coming days you can explore the library further yourself.
Similarly, has to have labels and values defined.
Plotly, offline, iplot, and it's important to put this in a list, filename, just going to say tags for now.
Cool, right?
Python learning Twitter Code Challenges.
Of course similar to the categories but here you see also, when we get to a bit more granular level you get into Flask and Django.
It's true that we write quite a bit about those.
There's even some machine learning, etc.
|
|
|
show
|
1:54 |
And, a quick video on some extra pointers Plotly is cool but there are others.
Matplotlib probably the best known.
You can do awesome stuff with that as well and we have a notebook here integrated on our blog as showing some more examples.
We like Bokeh, and we even had a code challenge and there were some submissions historical exchange rates for BitCoin using Bokeh, integrated in Flask.
By the way that was the challenge, to integrate it into Flask.
Weather data, look at how nice that looks.
Life expectancies in countries, very cool.
Versus Australia, so that's Bokeh.
And actually the Bokeh side is very well, I mean look at this, this is awesome, simple text is up high.
Look at these visualizations that's amazing.
Bokeh has really great documentation and user guide so definitely check it out.
Then we have Seaborn as well, and we had a guest post here looking at Marvel data which was a code challenge we did and this uses Panda in combination with Seaborn and again this is a very nice library.
Look at these visualizations, very nice.
And one other example, this was one I did.
Analyzing Brexit data with pandas uses matplotlib it integrates very nicely with pandas so it's a very powerful combination.
One cool thing is scatter plots on demographics.
And that hopefully gives you some extra inspiration to start using data visualizations yourself.
|
|
|
show
|
3:29 |
Let's review what we've learned so far.
Adding the RSS data, you really want to use feedparser to get the RSS data.
We pip install that as well as Plotly to do the data visualization.
Then we imported the modules and I used feedparser to parse the RSS feed.
Which you can see one line of code and it wraps this in a nice data structure.
Which you can even access with a dot notation.
Then we prepare to data.
We wrote two helpers.
One to convert the date string into datetime object.
I made a little detour explaining a bit why you would want to use datetime when you want to calculate the dates.
But in this example, it was merely to extract year and month to have a consistent value for our graphs.
Then we extracted the categories from the blog links making them another helper.
Using a regular expression to extract the category.
If it's in the dictionary, we return it, otherwise return to default set to article.
Next we converted the data so far to usable structures.
All the graphs have counting in common and that's where counter is your best friend.
You can see we generated a big list of all the publication dates and we can just put them into counter which makes this nice, frequency counter.
We prepare all three graphs.
This was the first one.
The second one were the categories and the third one were the tags.
You can already see that this starts to paint a picture of what our PyBites blog is about.
The final trick we needed was transposing the data, making X and Y axis.
I used a nice trick from Raymond Hettinger to use*data in combination with zip to make a date-like object or a list of tuples.
Transposing the data to X and Y axis' which made it way more easy to plot.
Then I extenuate Plotly object, giving it the offline mode and calling the innate notebook mode method to make it work inside my Jupyter notebook.
Then the three plots.
Post for months frequency with all the prep data done, a small amount of code with a nice graph.
Here you see the activity per month and number of entries in the blog.
Secondly, the common blog categories.
We went and made a pie chart, which makes a nice visualization what kind of categories our blog posts are.
You can see that challenging articles trumped the other categories.
For common blog tags, it's kind of similar as categories but it's a bit more granular.
There you can also see that we blogged quite a bit about Flask and Django, github code automations, but this is a way nicer way to demonstrate it in any presentation.
Check out other libraries, Bokeh, this is from Panda's in combination with Matplotlib, a very powerful combination.
This is a print screen from the Seaborn library.
As mentioned before, Matplotlib is also a very robust library and there might be many others but mostly I use Panda's and some Bokeh.
I decided to use Plotly for this lesson as it's simple to use and has nice graphs.
Now it's your turn, keep calm and code in Python.
|
|
|
show
|
1:56 |
Welcome back to the second day of the data visualization lesson and after the first day of theory and practical examples, it's now time to roll your own and now it's going to be fun be because you will be experimenting with data and give it a nice representation.
If we head over to our code challenges platform, there are a few challenges I have in mind that will fit this purpose.
We have a few data challenges and we're going to show you Marvel and PyBites first here in data.
Here are some data sets you can use in these challenges.
And for example for the Marvel data, I came up with this quick graph of comic book characters introduced every year.
And I used Bokeh for this and that's just one example of a graph you can make of that data.
We did a code challenge about analyzing our data and you're free to choose if that's Twitter data or Github or anything PyBites related and then make a data visualization of that data.
Another challenge is Bokeh integrating its chart into Flask.
I think that's a cool challenge because not only do you have to make the data visualization but also you have to integrate it into a web app which makes it much easier to share it out.
Here are some data sets you can use.
For the rest, you're just free to make a nice visualization and don't forget to pull request your work.
So if you want to follow along with the code challenge platform, you can fork and clone our repo and make a branch and all the instructions are in here.
When you're done you can open up a pull request via our platform.
So that's that for challenges.
Now get your hands dirty and tomorrow I will check in again with you to give you some more pointers and see how it's going.
|
|
|
show
|
1:01 |
Welcome back to the third and final day of data visualization.
I hope you are making great progress.
And let me just share you one more pointer.
Randy Olson sends out very cool Tweets about data visualization.
And here's his Twitter account.
And it's chuck-full of awesome visualizations.
So that's probably somebody, if you like data visualization, who you want to follow.
And you can also look at the data of his hashtag on Twitter.
Look at that, carots, very cool.
Right, so, apart from that, keep on coding.
Keep on using these cool libraries that I've shown you in this lesson.
And don't forget to share your work.
You can use the hashtag #100DaysOfCode and feel free to mention Talk Python and PyBites in your Tweets.
Good luck and have fun.
|
|
|
|
1:02:30 |
|
|
show
|
0:46 |
Hello and welcome to Day 85, Michael here again.
We're going to build a really cool interactive web application.
And we're going to do it the easy way.
You've already seen Flask, and Flask is super powerful, and super flexible.
In fact, we're going to come back to Flask again, maybe one or two more times in this course still, but I want to show you an alternative way to build web apps, and especially if you think to yourself, I'm not a web developer, I'm not super good with CSS, I'm not great with HTML, layout doesn't work for me, I can't put together the web pieces, these tables are crazy, I'm not great with databases.
All of these things?
I'm going to show you a way to build quite a wide spectrum of apps in a super easy and accessible way that you can be up and running, literally in a day or two.
|
|
|
show
|
2:20 |
The title of this chapter is Full Stack Web Apps Made Easy.
So, what the heck is Full Stack anyway?
You may have heard this term.
It's definitely floating around there as a buzzword out in the industry, but let's try to put some structure to it so you really know what I'm talking about.
Now, let's look at the pieces involved in a standard Web App.
We got our browser, we have some kind of cloud hosting, there's really some sort of server, maybe it's a virtual machine or set of virtual machines we manage, and there's typically a database.
A request comes in, goes over to the server, goes off to the internet; somehow finds its way magically through the magic of the internet to our server, our server talks to the database, and so on.
For most deployments, most applications you build, what do you need to know?
It's actually incredibly daunting, I mean you're taking 100 Days Of Python here, but there's a lot of languages and technologies involved.
We have tried to help with this, but still, let's see.
On the server side, we got to know Python, we have to know HTML and CSS, some kind of templating like Jinja2 or Chameleon, some web framework like Flask or Pyramid, a data access layer like SQLAlchemy or MongoEngine or something like this.
The actual infrastructure, typically that's Linux, and if you aren't in Linux, probably you got to configure the front-end web server, which is NGINX.
You also got to configure the app server which runs your code itself, which is uWSGI or Gunicorn, or something like that.
There's just like, "That is just the server!
Do we forget about the database?" Nope.
There's more stuff that goes over here; you got to know the server that is the database, SQLite or MySQL or something like that.
Got to know the query language, the SQL query language.
In practice, you got to know migrations, how do we evolve your database?
Are we done?
No, We still got the front-end code.
Over here, we've got Javascript, HTML, CSS, Bootstrap, a front-end Javascript framework like AngularJS.
This is an insane amount of stuff to know, and this is why building web apps is both really fun but also really challenging because you don't just learn the one thing and then go build the app; it's all these technologies put together.
Once you master them, this is a super fun way to build applications, but it can be really daunting.
Whatever it is, it's not quick to get started.
We're going to see that what we're using for this set of three days takes many of these things and makes them nearly trivial or automatic or just puts them behind the scenes for us.
|
|
|
show
|
1:00 |
Let's take a look at the app that we're going to build.
The app is called HighPoint, kind of like SharePoint but with Python.
So it's just this knockoff off on a really simple document management application.
But you'll see that it's quite involved.
So here on our homepage, we've got a couple operations.
You go view all the documents or create a new document.
Here's the most recent ones.
You can click and see the details.
So when it was created, all the info about it, and so on.
You go over to all the documents and you could filter.
For example, one of these has the word atoms in it, that one.
Another one has grass-fed request for example.
So really nice and again you can see the details.
And then finally you want to add a new document, you come down here, you pick a category, create it, you have validation, all this kind of stuff.
So we're going to build this in a really short amount of time.
And then put it on the internet with a full deployment.
How about that?
Hopefully you're looking forward to it.
It's a cool technology and it's going to be a lot of fun.
|
|
|
show
|
0:54 |
Now that you've seen the application that we're going to build, our SharePoint document management knock-off thing, you might be thinking there's no way we'll be able to build that in like 30 minutes or whatever this is going to take.
Well, it turns out, if we use this thing called Anvil, we can.
So Anvil is this new product that came out that lets you write Python code for everything that you do, and it's really this cool visual designer and application builder for Python web applications with both the service side and client side component.
Now there's a free version of Anvil that you can get, and it has some restrictions.
And so I was a little bit hesitant to use it for this course because for it to really take full advantage of it, you have to pay for it.
But on the other hand, it's so powerful.
I think a lot of you will really appreciate what you can do with it and might actually find it super useful and not mind paying the small bit that you pay anyway.
|
|
|
show
|
2:41 |
Before we start building our application with Anvil, lets look at the building blocks, all the pieces, the little Lego bricks that we have to put together because they're really easy to fit together and use.
So, let's do a quick survey.
Probably the first thing you'll notice is forms.
And forms are the HTML pages and components.
You have a nice visual designer with a set of components you can drag over and visually line up and click on them and set their properties and so on.
So, that's really nice.
There's also a code behind thing that goes with them that you can run some code as part of interacting with the form.
Now, some code doesn't belong within the UI, it belongs elsewhere.
Maybe it's shared across forms or it just doesn't really belong there and so, that would be in this client module section.
So here you can create these Python modules that you write arbitrary Python code that can be called from within the forms, can interact with each other and so on.
So, it's kind of a nice way to separate stuff out there.
We'll also have server modules.
So, this client code in the form code behind actually runs on the client side.
Think about that for a minute.
Python code running a client side.
That means in the browser, so it actually converts to JavaScript and runs there.
Sometimes you need code to run on the server to interact with your database in certain ways or to work with secrets, or validate stuff that nobody can mess with.
So, that's server modules.
And there's nice integration here.
And of course you need data, a database.
So there's this concept of data tables which is really nice and easy and integrated.
On top of these four things we have services.
So, things like user management, storing users with passwords and registration and stuff like that.
Secrets like API keys you don't want to put in your code but still make accessible to your web app.
And Google and Facebook APIs, so if you want to get to say like Google Drive, for example.
Stripe if you want to accept payments.
And finally, this thing called uplink.
Now, uplink, we talked about a thing called uplink, a Python package for services but this is not that.
Put these entirely out of your mind they're totally unrelated.
This is just the same name they have here as the thing that we played with earlier.
The idea is, if you would like your web application to reach out and get inside some other thing and interact with it you can do this thing called uplink.
Here's an example.
Suppose I have a Raspberry Pi that's running some Python code that controls my house.
Inside that Raspberry Pi, I don't want to have a service that things integrate with but I would, somehow, like my web application to initiate a call into that Raspberry Pi.
Like, let's say to turn on the lights or open the garage door by clicking a button on my web app.
Uplink would make that happen.
So, really, really cool.
We're not going to use it at all.
We're not going to use any of these services for what we're doing but we are going to work with the top four items for sure.
|
|
|
show
|
2:09 |
Alright, are you ready to get started?
It's time to build something now that you've seen what we're going to build, and some of the building blocks, let's go over to Anvil.
Now, I suggest you go to talkpython.fm/anvil to get started, I'm working with the guys there and maybe I'll be able to get you some kind of discount if you do decide to sign up based on this.
I'll put more details in the readme in the your turn, but be sure to go there this way, talkpython.fm/anvil.
Here's their site, you want to just log in, you'll probably want to sign up.
Now, it should take me right there, I think I've logged in in this browser session already.
Now, I find when I'm working with Anvil that I really just want to go over here and get the web application to go away and just get it full screen, because everything's going to happen inside here.
Here's my HighPoint trial test thing that we were just playing with.
You can actually go down here and click on this, and get to some of their interactive tutorials if you want to look through them, that's pretty cool.
They've got a lot of helpful little videos and walkthroughs, things like that, so really pretty nice support to get you started.
But we're just going to create a new application.
I can see we have three basic looks, and this one looks a lot like the app we just build, didn't it, so we're going to go with the material design app.
And once you pick material design, you need to pick your layout, there's a lot of options, just blank or custom, or single page, we're going to go with what's called a card-based layout with a sidebar.
So here we are in our application.
We only have this one view right now, but if you click app browser, you see we can have more than one form, we have our modules, server modules, the services, and things like that.
Okay, so I'm going to put this away for now, but that's the way we get started.
And what we do is we just go over here and we way, I would like a label over here, for example, on the title.
Or I'd like a button to be right there.
And we're going to drag the stuff around, arrange it, and then we can flip over to the code side, so here's the code that runs when our form is shown.
So we're going to hook the events from these components and they'll call functions back on that code that we just saw there.
|
|
|
show
|
2:28 |
Alright, here we are.
Let's begin, this is going to be our home_form.
Let's begin by renaming this thing, that's not amazing so we can come over here and we can rename it to home_form is what I'm going to call it.
Since my resolution is so small, I'm going to hide this thing back.
I typically work with that open but for recording I made my resolution really small which means I'll try to compact things.
Alright, so let's go over here and put a title.
And we're going to give this a name, so in code we refer to these things as you know, whatever their name is here.
Label1 is not super helpful, is it?
So let's call this label title.
And let's set it's default text as HighPoint Home, something like that.
Alright, so what we want to do is we want to take some links, some hyper links and put them over here.
So we're going to have three of them and let's just set the properties.
Give them a name.
It's going to be link home, it's text is going to be HOME all caps.
This is going to be all_docs and this is going to be add_doc for creating a new document.
Now, one thing you may have picked up on in our little demo app was there were some cool icons here and Anvil is integrated with what's called font awesome which I love it, font awesome is so cool.
I use it.
You've seen plenty of these fonts in the player that you're working with right now I'm sure.
So we can come over here and say I'd like to have a home icon, actually this is the ad so let's have a plus.
And it's a little plus that appears over here, let's do it for docs.
Now if you're going to make a knock off on SharePoint obviously you've got to use word, right?
So we've got a word icon down there and for home let's go over here and add an icon and type home.
That looks nice, right there.
Okay, so we've defined our UI, we've got these pieces here.
Now the next thing to do is to actually add the contents.
Now the way our navigation is going to work is we're actually going to load up this one page and we're not going to navigate away at all as far as the browser is concerned.
So this is kind of what you'd consider a single page application which has a lot of benefits, means every time you interact with this stuff it doesn't necessarily go back to the server.
Once the thing is downloaded, it runs really really fast which is a great way to run Anvil apps.
|
|
|
show
|
2:06 |
Now notice, if we were creating a top level item, this might be good, maybe this, but for stuff that's nested inside other forms, then this blank panel is probably what we want.
Give it a name.
add_doc_form.
So this is going to be the one we'll see for when we add a document.
Now for each one of these, I'm going to put a title on them, but I'll skip over in the next set, so you don't necessarily need to see how to put a title every time.
So we're going to put this over here, and let's just put a nice little title, called this label subtitle.
Make it a line center, make it bold, make the font size 28 points, and the text will be add a new document.
That's not going to change so we don't need to do any code, but we want to be able to see what form do we have active.
So, we'll have this here.
Next up, we're going to add a doc_details_form.
So once you click on a particular one, we'll get that.
We want a place where we can filter and see all the documents.
So let's create an all_documents_form.
Now you might think we're done.
We have our home_form, we have the ability to add a doc, go to doc_details and see all of them.
However, we also want to put something here.
And the way the interaction's going to work, its better of what goes into this section, even on the home page, is encapsulated as one of these little sub-documents.
So, let's add one more here.
And for lack of a better name, I'm going to use home_details_form here.
And there we have it.
We have all the forms and they have a little bit of information on each one of them.
The next thing we need to do is actually make this navigation work.
|
|
|
show
|
4:20 |
So we have our cool little app here, we've got our various forms, and we've got a navigation.
Let's go ahead and actually run this, we've not run it yet.
So, what happens when you run it?
Well it actually just kicks off, I think, a docker image on the Anvil servers.
So let's click this and get started.
Oh, before we do, let's give it a name.
I'm going to call this HighPoint-100days.
Now we can hit run.
Now notice it's running right here, this little helper thing up at the top, and then press stop and get back.
But anything below this, this is our app, this is what people will see.
You can even expand and collapse the little side thing.
But if we click on these notice, not so much is happening, right?
Our forms are not showing.
But still, look, our app is running.
And if we wanted to see it on other browsers or on our phone or something you can even go over here.
But we're not going to that yet, we're just going to hit stop.
Now remember, don't close your browser, you're not going back to an editor, you just want to hit stop, you're already here.
So how do we link these things together?
Well, this is where this goes from kind of interesting to really different and interesting.
Watch what happens when I hit code here.
We've already seen that we have our code in the background, okay, and let's open our app browser for a minute.
So what we need to do is import these other forms, in Python, so here's how it goes.
From add_doc_form, import add_dock_form.
So this is the standard way you get access to these other forms.
You're going to need this for all the various sub forms here.
All right, so we have them all imported, now what?
So we're going to write a little bit of code here, that when the page loads, after init components, when the page loads we want to show the home details form.
So notice we have a content panel here, and what we're going to do, is we're going to put instances of these forms into the content panel, and that's the thing contained in the middle.
So we'll say self, notice the nice Intellisense, cotentpanel.items, not items, what you want to say clear, like that.
So, in case something was here, we want to get it out, and we're going to do this every time we navigate, but also at the beginning basically.
Say self.contentpanel.addcomponent, and we're going to create, we want to create a home details form like that.
And that's going to do it.
All right, now let's run this and see if it works.
Boom!
Look at that.
HighPoint Home.
Now none of this is working, so let's go link those three things up and replicate it for the various operations we have here.
So we go back to design, and we just double click home, and notice link home clicked, and here's a function.
Go back to design, do it for all docs, do it for add_doc.
So notice, here are the various things that we can do.
We can go home, and let's actually, do this over here.
Call self.link, clicked, home, like so.
Do the same thing with the other little forms for the various other pieces.
So what have we got here?
The all_docs.
And this would be add_doc.
Okay, great, it's almost finished.
Let's run it and see where we are.
Notice up here our title, HighPoint Home, HighPoint Home, and we click here, we get all documents, add a new document, but notice this is not changing.
This is subtitle, but this is label title.
Let's fix that.
Now one thing that's cool, is notice over here on the right.
These are all the stuff, things we can work with, and if you expand it, it shows you you can set the icon, text, etc., etc.
So what we want to do is set the text here.
So we'll set it home there.
This one let's say All Documents.
And this one be Add a document.
How cool!
Look at that.
Very, very nice, I love how this is coming together.
So, I think our navigation is basically done.
The next thing that we got to do, is let's focus on adding a document.
Because it's not super interesting to show the documents, until we have the ability to add them.
So we're going to focus on adding a document next.
|
|
|
show
|
2:08 |
Alright, our next goal is going to work on, to be working on this add_doc_form here.
So what we want to do is we want to be able to drop in some pieces, so we're going to come over and add a little sublabel, and this is going to control, this is going to basically be the label in our form.
We don't really program against it, so we don't need to set the name, but this'll be document name.
And let's make it a little more standout, make it bold.
Okay.
And then, we're going to have a text area where they can type.
Notice I can drop it in these different locations.
I'll drop it right here.
We can tighten that up by dragging that bit over.
Now this one, let's give this a name, such as, like, textbox_doc_name.
And let's give it a placeholder document_name like that.
I'll do exactly the same thing for the rest of the elements.
Okay, so I've done a little draggy droppy magic, and gotten this far.
We have a document name, we have a category, and this is going to be a dropdown, we'll fill that up.
This is going to be a text area, and we should go ahead and give this a placeholder so people see and document this little placeholder, which'll only be there until they type text, and we have this button, create document.
Let's do a little more work on this.
We want this to align to the right over here.
We want an icon.
Little plus sign, and let's change the color here.
Go with this blue, which I just grabbed off somewhere on my screen, and let's make this, you can type hex here if you want.
Three F's for white.
Okay, so there's our create document.
Let's go ahead and run this, see how it works.
Again, we can click around.
And now we can add a new document.
It says document name, the name, look how cool that is, it's got nice little bootstrap forms, nothing in our dropdown yet, contents here.
Nothing happens when we click, but that's going to be what we do next, is we're going to make this interactive and do a little validation.
|
|
|
show
|
4:44 |
We have our ad new document form here, and it's working pretty well in terms of UI, but it has no responsiveness, nothing happens right?
So let's go to the code side and add that.
First thing that we want to do is we want to populate this combo box here.
Now you can go type in the items, if this was like a set of things you knew, like what color of items you want?
we only have three colors, type it in here.
Or what month of the year?
that doesn't change just type it here.
But, when we're working with things that are going to change, like categories out of our database, we want to do that in code.
So, let's write some categories.
Now, for just until we get to the database part, I'm going to just type them out here.
Let's suppose we have four categories that we're ultimately going to store in the database that can change and grow.
Then we'd able to do things like go to the database and say show me all the documents that have science, that are tagged with science or something to that effect.
So we'll go over here, and we'll go to self.dropdown.items I want to set that to two things.
What we need to do is give it a tuple, for everything in the categories, we want to give it a thing to show, and then the actual value.
So I actually want to have two things, I want it to start out selected with just nothing.
So let's say something like this.
So, this is what's going to appear, the words select the category with the value of None, so we can test that they're selected nothing.
And in here, we're going to create a c, c maybe we'd use ID or something, for now we're just going to use this.
For c categories, I'll test that.
Select a category, oh yeah that's sweet.
Okay, so this is good.
Now the next interesting thing really has to do when we click on this button.
I'm going to click on button six, so if I just double click right here, it's going to add that code.
Let's tighten that up a little.
It's going to call this function.
So we either want to save the thing and maybe navigate away, or if there's missing data, like they haven't given it a name, they can't save it right?
So let's do a little validation bit here.
Now let me just type this out and then I'll talk you through it.
Alright, so we're going to do a quick validation.
And the way we get the values, out of say the text box, is just the dot text properties.
And we're also going to strip that down, make sure they didn't just put white space.
For the drop down, it's selected value right, that's the second element right here.
Either the text of the category or nothing.
And if they haven't typed anything into this textarea, a multiline text box, then we're going to say you can't create empty documents.
So let's go over here, we don't have to pass anything along, because these are all part of this object here.
Now if there are errors, more than one, we want to show them all.
So we'll say if errors, and then what do we do here?
Let's add a label where we can put an error, maybe give it a nice color.
We can use a little divider here like this.
Here we go, made it a little bold, put it in the center, give it a nice red color, say this is an error.
Now when it runs, before there's errors, we don't want that to show up right?
We don't see this is an error.
So let's go and have that removed.
Also, I put a divider, but for the sake of size, let's do this.
So at the beginning, we're going to come over here and just say clear this out.
But if for some reason there is an error, we want to set this.
And let's actually do a cool little trick here.
We'll say join on the error.
So when they get a list of errors, and then we're going to separate them with new lines, which preserve themselves from when this ges to the web.
So let's try this, try our validation.
So if I just hit go, we should get three errors.
Bam, look at that.
Document name is required, document category is required, and cannot create empty documents.
Let's pick science.
Now just the name is required.
The name, now some details have to be provided.
Now that almost worked, didn't it?
Actually, there's no more errors, we just need to call this at the beginning every time.
So let's go over here, and zero that out every time we validate, or we could maybe do it here, take your pick.
Or do it else, whatever.
I'll leave it like this.
Now once I fill this out, boom, it's gone.
That would've created the document if we had implemented.
|
|
|
show
|
2:32 |
Our add document form is taking us through the steps here, it loads up looking nice.
We click the button and it validates and then down here we'd have to write to do create document to do go to home or something to that affect.
Well let's talk about these, go home is easy we'll figure that out in a minute.
Create document, that means we need a database and we've talked about SQLAlchemy, we've talked about SQLite and all of those probably didn't feel super super easy.
So let's see how it is over here.
Alright this is probably that full stack made easy thing I talked about.
So we go over here to services, expand that out and go to data tables.
So create a datable service and take it back out if we don't like it and we're going to add a table.
Let's create a new table.
Let's call this categories, lower case.
And then you define a schema, this is just going to have a text column called name and it's just going to be text.
We could add another column like id and so on but I think name is actually enough.
Let's go over here and have another table called documents.
So these are, the documents that our little document web app manages.
Let's give this also a name.
Give them a date time called created.
Let's give them a text column called content.
We could even add, like, a numerical thing for like views, how many times they've been viewed or downloaded.
And now, do this last one that gets pretty interesting.
Go over here and add link to categories one or many rows.
How's that?
Call this category.
Isn't that awesome?
So this is your foreign key relationship back over there, that's automatically taken care of for us.
So this is pretty much ready to go, let's go and check this part out.
Let's just add a couple things like science science news press release documentation.
So there's a few items.
Now check this out here, permissions.
Do you want your server code to be able to get to them?
Which is pretty safe.
Or even your client side JavaScript which your Python code becomes to get access to them.
This is not super safe.
People can mess with the JavaScript in your browser when they view the page and potentially, especially if this is edit, mess with it.
So we're going to say only this, only server modules.
Okay so server modules can talk to this and we can talk to those server modules that operate on our behalf.
We have no documents yet but we have our categories.
|
|
|
show
|
3:26 |
We have our data and we know we can get to it from the server modules, but not the forms cause we want to make sure that's safe.
How do we write a server module?
Let's go and add one.
So it's called server_module1.
Not a super name.
Let's give it something better.
Let's call it data_layer or something like that.
Now check this out over here.
It says okay we are going to import some server and data stuff.
And all you really have to do is just create any function that is callable, has parameters, and return something and we can call it.
So for example to say hello, how would we get to that?
Let's go to our home form really quick.
And let's just in this lib we'll say print.
anvil.server.call Now look what just happened here.
It takes a string, the server name, but Anvils integrated to know what server methods are available and is helping us right here.
So say, say hello.
And then I could put my name, which if you look back here it accepts a name.
It should say, "Hello there." So that'll be the input in return 42 as it should.
So let's run that.
See some output.
Server is yellow.
Client is clear or white.
It says, "Hello Michael 42." How awesome is that?
Alright that is an incredibly simple way to have a service.
Put that on there, done.
Then already host a service, host a client, connects them, done.
So we don't want this.
We want code that talks to our database.
We put that here and I'll talk you through it.
So we're going to come over here and we're going to talk to our app tables and we say dot.
You see we have our 2 databases that we created.
Our 2 data tables and the data table service we created, and we can go to them and we can say, "Search" and we can even do an order by.
And I'm going to convert that to a list and then we'll turn it back.
Over here I'm going to do something similar for categories.
And categories we're doing by name so it's alphabetical.
Also can find individual documents by name.
Instead of doing a search, you can do a get.
So here we're doing a where the name is equal to what we pass.
So we're going to leave 4 categories.
Okay so these 4 functions are now available to our code.
Let's try to add them into our add_doc_form.
So up here, we got our categories.
Let's go over here and say, "Categories", call them all_categories.
We're going to go anvil.server.call Now look.
All categories takes no parameters.
Now these are going to return rows which are dictionaries which have things and so what I really want is categories is going to be c, it's going to be one of the rows.
And it's going to be named, remember we had that in there, for c in raw_cats.
So now we have Docs, Science, News, and Social, but remember we put like press releases and stuff.
Let's see what we get now.
Oh, whoops, I got to take that out, don't I?
It's really cool how you can click that to get back.
Alright that was just test run, forgot about that.
Let's go to add a document, and look at that.
That's now out of our database.
How slick is this?
Okay super, super cool.
One of the challenges there, this is going to keep reloading it if I do this, and do this.
Hitting the database again.
Turns out this is probably not going to change that often, so we'll be able to do something slightly better, but this is really really cool.
Add the name.
Add some stuff here.
Hit create.
And then we should be able to call one more function on that server.
|
|
|
show
|
2:53 |
All right, looks like our categories are working, so we can delete that bit.
Now, here we have the To-Do, Create a Document.
What we need to do because the security we put on our document, our database, we need to put over here.
Let's get rid of this output so we have more room...
...to our data layer and add one more function, and just for time's sake, I'll paste this in, it's really simple.
So we're going to call Add a Document, and it's going to take a Category Name, a Contents, and a Views.
We also have that created which we're going to generate on the server, and a little print of what we're going to do.
And then we'll come over here, and we'll call Category by Name, give it a category name 'cause when you have these linked tables, you can't just put a value that would determine their relationship, you actually have to put the row, so we're going to get the row back, and then set the relationship this way.
And we have...
Make sure we have this right here...
Name, Created, Content, Views, and Category.
So this needs to be Name, Content, Views, Created, and Category.
It looks good.
So we're just going to go and create this.
Now, all we have to do is call this Add Doc here.
There it is.
And what does it take?
It's going to take- Look at that, it's pretty awesome to show this- it takes the document name, Name, Category, Contents, and Views, and let's just put zero for views when we create it.
So Name, something like that, So this selected value here, that's just going to be the name, and that's what we'll use in our look-up on the server site, and the Content.
Something as well.
All right, so that should do it.
Let's see if this works.
So this is going to be some documentation.
All right, let's see if this works.
Create Document, ha-ha, datetime and Data Layer.
Yes, yes.
Import datetime.
So close, let's try again.
Alright, let's try it with this.
Boom.
Look at that.
On the server it says it's creating the new document.
Does that really mean it was created?
Let's go to the database.
Oh my goodness!
There it is.
Look!
That's it.
And we linked it over to the documentation.
Now even the categories.
That's so super awesome.
Love it.
|
|
|
show
|
4:52 |
It's great the we created this document but the experience wasn't super, like it didn't tell us the thing was created, we put a bunch of code right into our form, things like that.
So let's clean this up a little bit and let's begin by going over here and creating a new module.
I'll call this...
I'll just call this utilities.
Now over here we right code, this runs on the client-side and it's going to do...
This basically lets us put these methods wherever we need.
So one the things we're going to need to do, this will take a moment before it's obvious why, but we need to, when we're over here When we want to go home, we need the home form, which we don't have access to, to basically run this code again, okay?
How do we do that?
Well what we can do is we can come over here and say, import utilities We can go the utilities and say, home_form = self so that we can always get back to it from within code over here.
So we'll have a home_form as None but of course it will be set soon the application starts.
And let's just add a method, "Go home".
How do we do that?
We say, home_form.
Now it doesn't know what this is.
We want to call this function here.
Like that.
That's all we got to do, super easy right?
We just wanted to call this function go here from wherever.
So we need this import utilities over in our add_doc_form as well.
And let's go over here and we can just say, .go_home We've already created the document but let's take some of this code and make a little simpler.
Let's go over here and say, utilities.create.
And let's pass that in there, okay?
So we basically need to call this function over in this utilities.create_doc, but there's a reason I want to do this.
You'll see in just a second that it makes sense to try to put these together.
So it's find this.
Remove that one simple call over here.
Like that.
And it's going to accomplish the same thing, but we also would like to have one more function.
refresh_data Now what I want to store is I want to store the docs as a list and the categories as a list.
And when we call this, I'd like to write that code that we had over here again.
Remember I said I didn't like this?
Let's take this code and get rid of it and put it over here as well.
So here we're going to go to the server and we'll also do this for the documents.
If you had a ton of documents that's not a good idea, but since we only have a few we'll go like this.
Okay, so we're going to set the categories and the documents and that means over here we can just go...
We've got our list, let's say utilities not categories.
Now how do we know this is refreshed?
Let's call it once when the app starts up and that's all we're going to do.
Alright so that should refresh the data and then any of the sub-forms will have access to the utilities dot categories or documents.
And here we'll call create_document and then we'll call go_home.
And within create_document, final thing, the reason it's nice to have this here is we can call refresh_data again and make sure that whenever the data is modified, we automatically get it updated but otherwise, it just stays like it is.
Let's go and test this, that it's still working.
Apparently spelling is hard.
Alright, what happens when I click this?
It's going to go to the utilities client-side module, call the create_document.
On the server it's going to create and insert the document, it'll come back and then it'll call Refresh so if for some reason the categories, definitely the documents will have changed, we'll get those new ones.
And then it's going to go to the home form, call go_home, it should reload this and it will all work.
Let's try it.
Boom!
On the server we created this new document, now we're home.
We can add more of course.
I think it's about time to do the other ones where we can actually see the documents right?
|
|
|
show
|
6:55 |
Let's go mess with the old documents, recall what we had before we had a little filter thing, and I'll go ahead and put the text of it up here.
This isn't going to do anything yet, but we'll have our little filter there, and let's put a spacer.
And then what we need is, we want a list of all of the documents.
How do you do that?
So far we've set like the text value and so on, so what we need for the next thing is actually called a linear panel or a repeating panel, we'll go for repeating panel.
Now, there's an item template that we've got created right here, and I don't like that name, so let me rename this to doc_list_item_template.
If you go down here, we'll see that we have the doc_list_item_template, right there, sorry.
And let's set the name to docs, like that.
Now, if we actually want to edit that item template, we can double click here or just go there, we'll double click there and it says what items would you like to display?
Right on the table, how about documents.
And that means there'll be a little item property for each one that comes through here.
Alright, so within this, how do you want to show it?
Well, let's go do some more stuff, let's set into this thing, we're going to put the title, make that bold and go left.
Put another one right there, that's when it's created, and then let's put a link in here, so you can click the link to say navigate over and edit it, and this is going to be details.
Alright, make that smaller at that side, that created we can make it a little smaller, leave some room for the title, which is going to be the main thing.
This is pretty interesting, but how do I get the data wired into this?
Now, we get a little data binding here, check that bad boy out right there.
Self.item of what?
Well, that is the scheme of our database.
How cool is that?
Okay, this should be name, and that's looking good.
Oops, I don't want this one.
Self.name and the created, we're going to set that up a little bit different, but let's just see what we can do to make this work.
Come into code here, go to our utilities, remember it's already loaded the data so we shouldn't have to download anything, this is all a single paid app, it's amazing.
So all we have to do is say self.repeating_panel.items = utility.docs.
Let's see if this works.
Alright, moment of truth, wow, it doesn't look like much, but that is out of our database right there.
Super, super cool.
Let's work on our created date right here.
Now, if you look over here at the bindings, I could try to add a binding, and I could have created, but I really wanted something like, kind of complicated for how I do this, like stuff that's happening here.
So, instead of doing it this way, let's remove that, and let's actually go and write some code for our doc template.
Right, so we come over here, and this little item thing has been set, actually, I believe it's not set yet.
We got to be a little careful when the thing is shown, or the doc list is shown, then the item has been set, so we come down here and say self dot label, created dot text, and then we want to use this nice little expression here, where we say item.created, this is the document, that's it's created field, actually, sorry, we got to do it like this.
Created, and then store format for the friendly month, then the day, then the year, let's try that.
Try all the docs, there you go, March fourth, that's today, that's when I created these things.
Super, super cool, I mean we could make those fonts a little bit bigger.
Last thing is what happens when we click this?
Right now, nothing.
So, inside our template, when we double click on these details, something is going to happen.
What we want to do is, again tell the home form to navigate somewhere, so what we're going to do is we're going to write one more function here, kind of like the go_home.
And we'll tell the home_form to do this thing we're calling go_details, and what is that?
Well it's going to show this details form.
We haven't put that in place yet, because it's not a top level navigation item you can do, but we'll write it now.
It's almost the same, going to add the doc_details_form.
Let's pass the doc along, and to kind of keep with the pattern when you do this binding or something is associated with it, it's typically item, so I'm going to say item equals this.
Alright, in our doc_details_form, let's just do something like this, print self.item name, just to make sure that we got the name here, so, like that, let's see if the details now work.
It doesn't, what are we missing?
Let me check.
Why didn't it work?
Well, it doesn't take a genius to figure that out does it, look at this, forgot to call it, alright, so let's do our import again.
Go to details and pass the document that they clicked.
Remember, the one I clicked was self.item, that's the thing that's bound to this particular row of our repeating table, so self.item, pass that along.
Click it, what happens?
Run demo ReadMe, oh we didn't pass enough, what's happening here?
I forgot to put the self parameter.
Okay, one more time.
Ready, let's go see the demo ReadMe.
Boom, we loaded the document demo ReadMe, want to try the other, live doc, loaded live doc.
Yes, it's working.
So we pretty much have our app all in place, the last thing we need to do is sort of replicate this view over here on the home, as well as filter the documents.
So what I'm going to do is, I'm going to go add a bunch of documents so we have things to work with, and then, we'll finish out these last two small pieces.
|
|
|
show
|
1:32 |
Now, off scenes, behind the scenes, I've put a bunch more content into our little document server.
And when we run it our all forms shows all the documents, but I'd kind of like, at the front here, or home, I like the recent, like the most three recent ones.
So let's put the little thing like this, so it'll show the recent documents there.
Now, we're going to do again one of these repeating panels.
Now check this out, let's go down here, and say, you know what, use this template that we already had, right there.
Notice how it's like this.
All we have to do is put a different sent of documents, and we'll have this thing totally written.
How awesome is that?
Let's do this.
Like, a few seconds this page will be implemented.
Self.repeating_panel1.
Don't love the name, but for now I'm going to go with it.
Items is utilities.docs.
And let's just say, we'll just take the top three, use this twice, try that.
That is incredible, isn't it?
With literally one minute I wrote this page, because I was able to reuse these components, both in code and draggy droppy style, and how awesome.
Look, if I click on it, it even takes me to the one that we clicked on.
So this is super cool.
We got our all documents view with all of 'em, and our home view, there.
And then, the last thing we want to do in this part is to basically let us search within here, if I type things like science, or I type week, I want this to filter down.
Let's do that now.
|
|
|
show
|
3:04 |
Now what we want to do is go to our all_documents_form.
Which is hiding.
Let's make some room here.
And when you type in this thing, which is called TextBox Filter, we want this to change.
So, we need to hook the change event down here.
Check this out.
Change event.
And what we want to do is we want to basically set the south.repeating_items equal to filtered_docs.
We don't have this written yet.
We're going to write that.
And what we're going to do is I'm going to have a function that'll take a document and turn it into text.
So, if I have this function, and I give it one of these documents and it just says convert into a string.
I can do a string search on that.
So, let's write this filtered documents leveraging this little bit of code here.
Here we go.
So, what we're going to do is going to go to our TextBox Filter.
Grab the text.
And if they're not searching for anything, we're going to return all the docs.
We're going to return all the documents.
Otherwise, we're going to create a list of documents that if we converted to text and then lower case it, and we do a find on the txt here, then, then we're going to get it.
I guess we want to also say txt = txt.lower().
Like that.
In case you type something upper case that wouldn't work well right there.
Would it?
So, we' re just going to go through and say literally as a string, does that piece of text you typed in the filter, does it appear in the document?
And then we're going to give that back right there.
Whew.
Okay, and let's see if our filtering works.
So, here's our home.
It's got all the documents.
Some of these, like the space photos and Higgs, these are in the science category.
They have things like exotic materials.
This one is logging.
So, this is logbook.
Let's just look where we talked about logbook.
Oh, filtered docs.
What did I do wrong here?
Ah, self.
Self, self, self.filtered_docs.
So, let's try this again.
How about logbook.
Oh my goodness.
Is that cool or what?
What about the ones that have to do with science?
Oh, I think the ones that have to do with science might not be coming in there quite right.
This part right here, we have to get the name out.
Okay.
One more time.
'Cause the category is actually a row.
Right?
So, now let's try our science.
Those are the ones with that tag.
And about the ones with documentation.
Those.
What about the ones have to do with datetime.
Which is what we talked about in Day 1.
datetime.
How about the word the?
That appears a lot.
How about RSS?
Feedparser?
See how incredibly easy that is?
Watch how quick it is to go back and forth between all of these.
Because we've downloaded this, we're not hitting the server again.
It's just all running off of that cash thing.
Right there.
Super cool.
So, we can come over and just search for RSS.
Bam, find it.
Go pull out the details.
I guess the last thing for us to do is put the details page in here.
|
|
|
show
|
2:48 |
Alright, let's fix up this document details page.
I did a little draggy, droppy magic to put title category and labels.
Labels and then another label to have their text that will programmatically set in the contents here as well.
There's no point in you seeing me drag that over, you would have done that a bunch.
So let's just go over here, and go like this.
Talk equals self.item.
In fact, I think we could probably go over here and do a data binding if we really want.
This could be name.
This we're going to set in codes, we're going to take that away.
This one we also, I think need to set in code.
This one we could add a data binding of contents.
We'll just run it and see how we're doing.
Click on one, boom.
How awesome is that?
There it is.
Okay, so really, really close.
We got to set those two cause we don't want to transfer them over directly.
Maybe we could do the created category, but we'll just do it in code.
Category is going to be doc of category.
From the category we'll get the name.
Oh, don't forget that's text.
Text, text, text.
The text here we're going to set that to what we had in our item template.
Like that.
And, it'll be consistent I guess we'll say doc.
Okay, that should do it.
Maybe one thing really quick here.
Let's take this away, make this font a little bit bigger.
Same thing for the title, make it a little bit bigger.
Alright, let's run it.
Let's see, are we done?
Let's try the feed parser.
Wow that is cool, isn't it?
So document details here probably got to line that up a little, but we got this, here's your nice date.
It's under the documentation category, and then, there it is.
Let's go find another.
Let's go find the Higgs one.
There's the Higgs with a little bit of science stuff, has the crystals and it's under science.
These are the things we search for and it showed up over here.
Like Higgs.
Pretty amazing.
Let's go check out the day one read me.
There's the stuff about day times.
Okay, so our application is pretty much done.
I'm going to call it done.
This is really nice.
Of course, there's a lot more we can do.
We probably want to save this version, and I'll call this final version.
You know I actually I have a really cool version history, that you can publish and roll back versions, all sorts of cool stuff, even clone it with git which I'll do and put into the repository for you guys to look at so you can look at the code but you'll have to come back to Anvil to actually use it.
|
|
|
show
|
1:55 |
Well, our app is basically working.
Let's publish it.
Let's make it so you can get to it.
'Cause right now, when you click run, there's no URL I can go to.
Now, I probably won't publish this and leave it live for you.
Maybe I will, we'll see.
You can check the URL when I get there, but notice right now there's publish this app while it's running, and we can either copy this private link, or I could share it via public link.
If I do this let's call this.
That seems decent, right?
How about that?
You could use your own custom domain, but I'm not going to do that.
I'm going to just hit OK.
Now, if we close this, and we go open something else, actually let's just open this in a private window.
Go to Anvil app.net.
What do we get?
We get our app, up and running, on the Internet!
It is now hosted as a web server, as a back end, all of the stuff, super cool.
So we go over all docs, pull this up, we can search, everything is working.
It's really fun, right?
Obviously so are those.
We can even add a final document.
And where are we going to put this?
Let's put it under press releases.
The amazing app is now alive.
Pair document, boom, takes us home right there at the top, a final document.
The most recent one.
And we click on it, there's the details.
It was a little more than half-an-hour, but not terribly long.
I mean we've built a non-trivial application, and published it to the Internet in a pretty short amount of time.
So, hopefully this application platform is inspiring to you.
I don't know if it makes sense for all of your apps, but for certain types of apps it's really, really a cool one.
That's Anvil and full stack web apps made easy.
|
|
|
show
|
2:55 |
Let's review some of the core concepts around Anvil.
We saw that we start be defining these forms.
We drag the components over, we set their properties, their names, their bindings, all that kinds of stuff.
Here's our add document UI and we also have the code, so on the flip side we could look at the code behind in the form and hook into the events for like the button click or link click or page load or this thing shown all sorts of cool tuff.
And this Python code is actually converted into Javascript and runs on the client side.
So all the code you write here doesn't ever touch your server at all.
It's just, we write it in Python but it actually runs locally which is actually really amazing and takes a lot of the load off your server.
One thing we wanted to do was navigate between sub forms, so to load a different sub form but effectively in this case navigate the home_details_form.
We go to the content panel and clear out whatever happens to be there and then we add a new instance of the sub form that we want to show.
Sometimes it's parameterless like this one, other times like our document details we actually passed in the particular document that was selected and then it showed the details of that.
It's a really really nice way to navigate between these.
Of course you're going to likely need a database.
You can go to the data table service and create these tables and fill them up with data.
It's really easy, you can even link between them.
Don't forget to set the permissions, in this example it's no access from Javascript but on the server side there is access.
To do that server side code, we're going to write a server module and make it callable back on the client so here we created all docs method and we added a callable decorator, we just write whatever code we want and return it and this magically finds its way back linked in with all sorts of auto complete in various places back on the client side code.
Speaking of client side code, here's a little bit of our refresh data we just say anvil.server.call and we type in the name and then we put in the perimeters if they're more after that.
Now we just work with the documents, right?
So it's just a list of dictionary's, off we go.
Once you get your app built, you want to put it on the internet.
It's so amazing.
So you can click publish and it pulls up either a little trial link, you want to try the mobile version on your phone or I clicked share via public link.
We also saw that there's version history which is really nice, you can clone that with git but what's relevant here is you can click publish at the different save points.
So you name these like to present, that's one I named and if for some reason you make a new change you don't like it just go click publish and instantly roll it back to an old version.
Really awesome, right there.
Finally, if you want to get the whole story, the back story on Anvil, I had Meredydd Luff on Talk Python on Episode 138 and we talk about all the internal workings of how this is built, how he makes all the pieces work together and it's pretty cool.
So if you enjoyed this and want to learn more, check out that episode of Talk Python.
|
|
|
show
|
1:49 |
Well, I'm sure it was fun to watch me build that app with Anvil, but now it's your turn to do some full stack web development the easy way.
As usual, we've broken this up into 3 days.
Let's start with day one.
Today you've watched quite a few videos, so there's just a few quick, simple things, just so you actually get your hands dirty a little bit everyday, right?
So today, the first thing you need to do is create a new account and register at Anvil.
So be sure to use that URL right there.
You can just click on GitHub.
It's talkpython.fm/anvil100, and that will get you 10% off.
If for some reason, you do want a subscription in the future.
If not, obviously, you don't have to buy anything.
You can build what we built with the free version.
Alright.
So come over here, log in, create your account.
Once you have your account, I thought today would be fun to maybe play with just a little bit of the UI, a little bit of the designer.
So you are going to create a new app, and you're going to choose "Material Design," and then it'll give you some suboptions.
Choose the sidebar style.
Then you saw, just like we did, add a few links to the sidebar define a few subforms, and make sure that you chose the blank, the simple one, for those.
And if for some reason, you literally just need one form, just use the form that you get right away, right there.
But it if you're building something more interesting like we did, you'll need some subforms.
And then just fill out the visual designer.
Just, you know, drag and drop this stuff over here till it looks this way.
Be sure to name the elements like label_title, label_created, textbox_search or textbox_filter, rather than label1, label2, label3.
textbox1, textbox2, textbox3.
That is a real recipe for some spaghetti code that's hard to understand.
So a little bit of care there but just define the UI for the app you have in mind.
You don't have to write any logic, nothing like that.
And you mine as well go and press "Run" just to see it come to life, 'cause that's pretty cool.
|
|
|
show
|
1:07 |
Day 2, on the second day it's all about data.
So what we're going to do is going to create a data table service, so just go to the services and say +, choose data tables, and then this thing down here will pop up like this.
Create as many tables as you need up here, define their schema, and you can even enter down here some starter data.
For example, if it's something that's kind of static or you just want a little data to start with.
That's great, remember no access from forms, access from the server modules.
Once you have that you're going to need a way to get that data down to your application so go ahead and add a server module and then define the functions that you're going to need to send the data down.
You can look in the demo code that I put in this repository in this particular day if you want to see how we did the queries there.
It's pretty easy because they basically have a commented section when you create a new server module that shows you both how to use it on the client and how to define it on the server, so just follow along what they have in the comments.
Once you've got that going, that's Day 2.
You might want to just call those functions from your main form as a little test just to see that they're working and then throw those away, but that's what you did today, it's all about the data.
|
|
|
show
|
1:06 |
Finally, we're going to round this whole section out by putting it all together.
You've built the UI, you've built the data access layer and storage, now, it's just a matter of making the UI come to life.
Is that form supposed to fill up with data when it loads?
Implement that.
Is the button supposed to do something when you click it?
Implement that.
Right, so, you'll double click on the designer, it'll flip you over to the code here and you just write the code that happens when you click the button, or when the thing loads, or whatever.
Just make your app come to life.
Fill the interaction pieces that you need, and you should be done.
So if this is something you really enjoyed building, and you think is kind of cool, you want to share, be sure to publish your app.
You can share with a private link but be aware if you change it ever so slightly, that private link will expire.
So it's very, very touchy.
You could come up with a public link here if you'd like.
So this is what we came up with, you can choose yours however you like.
All right, that's it.
I hope you enjoyed building this full stack web app the easy way.
Be sure to share it on Twitter and Facebook #100DaysOfCode, and @mention both Talk Python and PyBites so we can share in the glory of what you've created.
All right, get out there and build somethin' fun.
|
|
|
|
31:40 |
|
|
show
|
0:48 |
Good day everyone, welcome back.
This is Julian Sequeira and I'm going to be walking you through the next 3 days of creating a home inventory app.
This is designed to just sort of get you thinking about the whole app creation process, even though I know you've done it by now.
But also to get you using a few different things in Python.
So in this specific app we are going to use SQLite3 as the database.
But we're going to cover a little bit of generators.
And we're just going to do some basic Python to get you through creating your own sort of storage app that recalls data, takes input, and you can imagine what it's going to be like.
So, carryon through the next three days and let's see what we can come up with.
|
|
|
show
|
2:36 |
All right, for the next 3 days, creating this home inventory app, it's going to be a bit different to everything you've done so far and the reason is is that we're not actually going to live code the app line by line because that would just be pretty boring and might take you forever.
So, take a look at this.
This is the ReadMe.
What I'd like you to do for the first day, I should say, is watch 3 videos.
Watch them, one about the main menu, the SQLite3 database access, and then scrubbing malicious data.
Watch those 3.
That should take a significant amount of time, maybe 15 minutes or so, depending on how much time you have.
And, after that, start visualizing how you're going to form and write your own app.
So after taking all of those things into account, how are you going to do this yourself?
Feel free to copy along and copy exactly what we've got in the repo, but obviously it will be more beneficial if you write this yourself, taking guidance from what we have, okay?
Get coding if you have the time.
Remember, I know we're all short of time, so if you don't have the time, don't worry if you can't get coding today 'cause these videos can be a bit lengthy.
But go ahead and code if you can, all right?
Day 2, I'm going to walk you through an entire run-through of the app.
We're going to see how it functions, how everything works together to form the final product.
Alright?
And that's in the app demonstration video.
If you haven't already by this point, start coding up your own solution 'cause you've only got another day and a bit until you have to move onto the next lesson.
So, start coding your own app up.
Again, take guidance where you need to, all right?
And on the last day, there's another video for you to watch.
I'm not going to leave up to you just yet.
Watch the pitfalls and bugs issues, okay?
That video.
This is actually going to show you where the app fails, and there are quite a few points that fails because to make a fully functional, bug-free app can take a fair bit of time, and that's part of the learning process, okay?
I'm going to walk you through what fails, and if you can, go through and see what you can fix, okay?
They're all issues that you'll need to take into account in your own app, so this is a worthy exercise, okay?
And then if you're super quick, and you have even more time, we'll get it out of the command line.
See if you can give it a GUI or even a web interface, okay?
And those are your 3 days, a lot of watching, a lot of coding.
|
|
|
show
|
6:06 |
Okay, so the first thing we're going to look at is pretty much how you get started.
It's a bit daunting, looking at an empty page like this, isn't it?
The best way I find to start is to actually think about what you want your app to do, and make a menu for yourself.
And normally I would say storyboard it, you know, get an empty document, draw it out with a piece of paper and a pen, whatever.
But I think given this is a very basic app, I think this works quite simply, quite easily, to just create a menu.
Okay?
It's just going to be text based like an old CLI app that has 1, 2, 3, 4, 5 with your different options, okay?
So, without actually showing you the code, again I'm not going to show you the code until the end, but it is in the repo if you want to have a peek, of course.
I'm just going to create under a main menu function, let me just copy and paste it in, just going to create a list, okay?
Now this is a dictionary with the menu options in there, okay, and we're creating this with Add Room, Add Inventory, View Inventory List, Total Value, and Exit.
So these are the five things we want our app to do, okay, so the idea is when the app launches it's going to give you the option to add a room 'cause we're going to add a room to add inventory to.
So you got to think about it in that sort of a way, alright.
Sequentially, if you want to use this app, you're going to add the room first because by default we don't have a room to add anything to, okay?
Once we have a room, then we can actually add some inventory, and then once we have inventory in there against a room, then we can actually view it.
And then again, once we have everything in there we can see what the total value per room is, or the total value for the entire house so to speak, and then we can exit.
And that's what we're going to wrap our entire app around today and tomorrow and the day after.
Now, again, I'm not going to show you the entire app and walk you through every single function just yet, I'm just going to show you the more critical points, the more technical points, okay?
So to make this menu, I've decided to put it in a while loop.
I'm just going to copy and paste it in rather than make you watch me type it all out, there we go.
So we have a while loop here, while true, so this is always going to happen, this list is always going to come up on the screen, unless something else is happening, it's going to come back to this list.
So we know with the dictionary that unless you sort it first it's not always going to print in order from 1-2-3-4-5 when you iterate over it.
So what I've done here is I've said for the item and for the description in our sorted menu, okay the items in there but sorted, we're going to print the item and the description, we're going to print that and that.
And this little for loop here allows us to print this menu on screen, and it allows it to print it in order, that's what sorted is there for.
And then we take the user input, so if the user selects one we're going to call a function called Add Room, if they select two, we're going to do Add Inventory, I'll explain this in just a second, if they do three, View Inventory, four Calculate the Total, five sys.exit.
Now for sys.exit to work, we have to import sys and this sys.exit just exits out of the program, and if anything else is entered: invalid option, try again.
Now the Check Input function here that is being called by Add Inventory and View Inventory is a little function I wrote just to check whether the room exists.
So if you're going to add inventory, the first thing you need to know is what room you're adding the inventory to, right?
Well that's what this checks here.
So I'll quickly copy and paste that in again for you to have a look at.
Lets just pop down here.
Okay, so here's Check Input.
So the first thing we're doing is we're actually printing out a list of the rooms, so this is yet another function, don't worry you'll see it all in the final code, but it's essentially listing out the rooms that we have and it'll printed on the screen, which allows the user to see what room they want to select.
And then the user types in the room, gets converted to lower case, and then if the room, which is assigned to selection, if it does not exist in the list of rooms then you get the message: that room does not exist.
Else, we return the selection.
Don't worry about what scrub is, we'll cover that on another video.
And that's it, okay.
So then, once we have the room we add inventory to that room.
So all of these functions will be available in the final code, but what I'd like you to do is start thinking about how you would write these functions.
How would you write Add Room?
How would you write Add Inventory?
How would you write View Inventory?
Okay, and that's it for this one.
In the next video we're going to look at some more of the advanced calls in this program and just for now, again, think about how you would write these different.
|
|
|
show
|
4:37 |
As I've said before, we're using SQLite3 for our database for this app.
This here is how you actually open your connection to the app and to the database and then do something and close it off.
So we've got our connection.
We've covered this in SQLite3 before but I'll give you a quick run through.
We connect to the database, okay?
We create the cursor which allows us to actually write over the database.
We then execute some sort of code.
We commit it and then we close it.
Now as we know from our main menu, there are quite a few things that are going to need this connection, okay?
There's going to need, we need to add a room, we need to view the room, we need to calculate totals, we need to add inventory.
There's a lot of things there that will need this connection.
Including just listing out the names of the rooms, right?
So you can't really have this much code in a function every single time you need to connect to the database.
It's not Pythonic and it's just a waste of code, right?
So what I've done is for this app, I'll leave this up on the screen.
I've created a generator.
Let me paste it in here.
Alright, so this is called access_db, this function.
And it's wrapped in context manager, so in order to use it, you would have to from contextlib, import contextmanager Whoops.
contextmanager, okay?
And what this is allows us to do is it allows us to generate a cursor, okay?
So the first thing it's going to do, it's going to try.
It's going to connect to our database.
It then creates the cursor.
Again, we're using this lineup here, okay?
And then it's going to yield that cursor, okay?
And what does that mean?
It means it's going to pass back that cursor to whatever called this function, okay?
So it yields this cursor out.
Now, just a quick demonstration of what one of these functions looks like.
This is the list rooms function that we saw previously, okay?
Now what it does is it says with access_db as cursor, okay?
So it's calling our access database function here.
And it's assigning that as cursor, okay?
So when it yields cursor, whatever is yielded by this generator is assigned to cursor, okay?
So that way we're able to use this cursor here that's generated by this try statement.
We're able to use it here and so it's going to do cursor.execute and run our SQLite query.
And then once everything in this with statement is complete, we move back up here into this, into our generator, and we finish it off.
It's just finally, okay?
So this finally is dependent on this yield coming back, okay?
So this returns a cursor, this yields a cursor but this here, this function is generated doesn't complete until whatever was using this yielded cursor completes, okay?
So, yielded cursor into here.
Into this with statement.
This with statement uses the SQL.
Runs this quick for loop with this list to create it and then once it's closed off, we go back here.
We commit the change and then we close it.
And now you can see, we don't need to have this specific code, the connection, the cursor, the commit or the close.
We don't have to have that in every single function that calls or that needs to talk to our database.
All we really want from this database call, is the cursor.
This cursor is what's important and that's what will change from function to function.
So by putting all of the unnecessary duplicate code into its' own function up here, we're being more Pythonic and we're going to then only return what we need and the yield what we need to the functions that need to talk to the database.
Okay, so that's a quick, quick overview of how we're using a generator in this specific code base, in this app to talk to our SQLite3 database.
|
|
|
show
|
5:46 |
What we're looking at here is the add room function.
Now the reason I'm showing you this is because it was a bit tricky to get around this.
We want our users of this application to be able to add rooms and what that means is they're going to be adding tables to our database.
Each room is going to be a table and each room is going to be able to have certain items added to it.
A name and then a value.
You can see that here.
We've got our item, meaning the item we're adding to the room, which is text and then a value which is a real, as in pretty much a float.
A real dollar value, a real number value.
The catch is we want the user to be able to specify the name which means the user is essentially telling us what our table name is.
That in SQLite3 is actually not allowed.
It's not Pythonic and it's actually unsafe from a database standpoint because it allows people to inject malicious code into your database, into your execute command.
You can see here what we've done is just ignore this line here.
Input, what would you like?
What name would you like to give the room?
Let's say we gave the room the name Living Room or just Kitchen we'll go with Kitchen.
When the cursor executes to our SQLite database, it creates the table.
Normally, you would just type the table name in here within the quotes.
But we can't do that because we don't know what the user is going to specify.
We need to parse it.
The variable that the input was assigned to.
So, name, we need to parse name into SQLite 3.
That's what actually incorrect.
That's what actually unsafe.
By going name.lower and essentially injecting it into our SQLite 3 code here, we run the risk of actually injecting malicious code into our database, which could be very dangerous.
To get around this, SQLite recommends you use question mark substituting.
On investigation, you can't use that for the table name.
You can use it for the rest of the query.
You can use it after that when you're talking about data to add into the table, which you'll see we use later but you can't use it to actually specify the table name, which is very frustrating.
But the way to get around this and it's a bit of a hack job is to scrub the data that goes in.
So the user will add a name and we're going to scrub that name to remove anything that's malicious.
We're going to define anything as malicious as spaces, any non-alphanumeric characters.
Could be back slashes, could be apostrophes, could be a percentage sign, plusses, anything like that.
We're going to scrub all that out.
We have this simple one-liner here that does that for us.
So any name that gets parsed into scrub, so let's say we're going to scrub name, scrub of table name.
What we're going to go is we're going to return, this is all in one line, Bob would love this, and essentially what it's doing is for every character in this table name, if it is a alphanumeric number or an alphanumeric character, I should say then it's going to join it.
If not, it leaves it out.
So we could use this function here to then scrub any word we want and turn it into the safe format that our SQLite database will actually approve of.
So to demonstrate, let's run this up in the shell.
All right, so I've used a bit of magic and just copied and pasted it in there.
So now we can scrub anything we want.
So let's scrub this string here.
We'll go Julian-Bob, oops.
And it comes back as just JulianBob.
It gets rid of that dash.
So let's scrub an actual room and we'll go scrub Living Room.
You see, it gets rid of the space because all it's doing is just capturing the letters and the numbers and putting them together.
Let's try one more thing.
Mike99+.
Just mushed some rubbish in there and it strips out all the stuff that could potentially hurt us.
This is a nice little workaround to get around the SQLite3 restriction on table names and not being able to substitute them with variables.
So this is what I've put in there.
Hopefully, that'll help you out in the future, as well.
But that's just a quick explanation of the scrub.
|
|
|
show
|
5:01 |
And here's the final code here on the right.
We'll go through it very quickly, not in too much detail.
But essentially, start down the bottom.
We can see we launched our first launch first, okay?
And the reason we do this is this will generate the database for us on first launch.
So as soon as this is run, it tries to connect to the SQLite3 database, and then it just fails while the except scenerio here is to just exit out of the app with some error code X that can be expanded on later if you feel like it.
And this just ensures the we actually have a database file to talk to, inventory.db on the very first time that you launch this app.
Okay?
And then we pop back down and we're launching Main Menu here.
We're running the main menu.
And down here we've seen that before, these are all your different options, okay?
Now if you want to add room, we then go down here to Add Room.
And again, we've seen the Scrub, we're seen the Create the Table based on the user's input.
Done.
A room with the name has been added to the database, then we can run the inventory check, add inventory with the check input.
Okay, so we'll just do a quick Check Input here.
We've seen that again, it just checks to see if the name exists.
If it doesn't exist, it just returns.
Else it will scrub the selection.
It will use that scrub function again here.
It'll scrub it and it'll return it to Add Inventory.
We'll pop down to Add Inventory here.
Now the reason we want it scrubbed is because that selection that the person made is going to be used in our Execute command here into the database.
So as they enter the item, it will execute insert into the room that they use as specified.
Okay?
And then it will enter in the item values.
And it will then give them the option to keep entering items or to quit, which will take them back to the main menu.
Okay?
Back to the main menu.
View Inventory, similar sort of thing as Add Inventory.
Okay, the user selects a room.
And then it will actually go through and add up everything in that room.
So you can see we've got data[0] and data[1].
It will actually go and print out the total of data[1], one being the value from our SQLite database.
So we're selecting from, the room that the user specified, we're selecting everything from there, and then we're going to just add up the values, or those real values, and display it on screen.
The other function that we haven't touched on yet is Calc Total, which is pretty much going through every single room, okay?
It'll go through every room in the database, add up all the values, add it to the total, and then you'll get a total down the bottom.
Okay?
So that's pretty simple, right?
We've got everything covered there.
All right, let's actually run it and see how it works.
So this will create a new database file called inventory.db because I don't have one.
And then we'll add the room.
What name would you like to give the room?
Let's call it Kitchen.
Okay a room with the name Kitchen has been added to the db.
Let's add some inventory.
Okay, which room?
Okay let's choose Kitchen.
And what item do we want to add in?
Let's put in Fridge.
Monetary value of the fridge is let's say 900 bucks.
Okay, let's add something else.
Let's add the oven.
Let's say it's $1200.00.
Okay we'll hit q.
And now it can view the inventory list with three.
Which room, kitchen, and it came up saying we've got a fridge of 900 bucks, we have an oven of $1200.00, total value of $2100.00.
Okay, so we know that's the math there works.
All right, let's add another room quickly.
Let's call it the Study.
All right?
Let's add some inventory to the study.
Okay let's call it the Computer.
And let's say it's a value of $2500.00.
Okay we don't want to add anything else.
And now if we do View Inventory List, we can see both rooms.
We choose the Study, we can see the study just has a computer in it for $2500, total value of $2500.
Now if we want to see the total value of the entire house, we can click on number four.
Total value of all rooms is $4600.00.
And that's it.
Okay, that's pretty much
|
|
|
show
|
5:40 |
So while the app actually does work there are quite a few things that we've left out.
And I've done this on purpose because this is what I'd like you to work on for your Day 3.
If not, just work on to expanded just for fun.
You can do it after your 100 days is up, whatever you feel like.
Or maybe you can use it as an idea to factor it into your own inventory app.
This first thing is, is that we haven't actually captured incorrect input.
We have here.
So for example, if we're at the main menu we put the letter a.
We just get invalid option, try again.
Even if we do something like 11.
We know it's a number but it doesn't match any of these, so we get invalid option try again.
Now what happens if we add a room?
Now we know we have kitchen in there.
But if we add kitchen again, what happens?
Kitchen already exists.
So we need to be able to capture that.
What happens if someone wants to add multiple bedrooms but they just want to call it bedroom.
It's a silly scenario because can't think of anyone who'd do that but this is something that needs to be captured.
Rather than allowing an error to just suddenly pop up and then exit out of the app.
So there's one.
Adding multiple rooms can cause a problem.
So, see if you can figure out a way to capture that.
Now that we have that, let's see if we can add duplicate items.
So we'll add a knife for $20.
Let's try and add another knife for $20.
And that works.
So why does that work?
Well that actually works because SQLite has its own sort of tagging behind the scenes.
It tags each entry with its own id.
So you can have duplicates items below a table name.
You can't have duplicate table names though.
Now is that a problem?
For me i don't think it is a problem.
But if you wanted to capture that you could.
That's something to capture.
But what about this?
Let's say we want to add a microwave, but by accident instead of hitting $20 we hit 2o.
We've entered in a letter instead of a number.
What's going to happen?
It allowed it didn't it?
So it allowed the fact that we had a letter and a number in there.
Which is wrong, so if you actually pull up our SQLite database in SQLite viewer.
Which I have done here.
You can see we now have values but microwave is now accepted to O.
So what we'll do now by allowing this to happen, we've probably caused problems here.
So view inventory list, let's do kitchen.
There we go, it failed because it needs it formatted as a number not a string.
This is for the actual value calculation.
So it was able to print it all out.
Once it got to the actual calculation for the total value, didn't like it.
Same thing for actually printing out microwave and its value.
So that's something we screwed up and we'd actually, in that case we actually broken the application completely because we have no way in here to code a deletion.
Which again is something you could do.
So I'm going to go manually into the database here.
And we'll delete this record because it's going to cause us problems.
I'll demonstrate that again.
This time we'll add an item to the inventory.
We'll choose the room study.
Study.
And then let's add ourselves a chair.
And instead of actually entering a number at all.
Let's just use the word water.
And you can see it actually returned and we were able to add it successfully to the table.
So again, that's going to cause us issues and we'll have to delete it manually from the database.
We can also capture different errors to do with launching the app as we saw.
I've only got this sampler here but we can actually put some more scenarios in there if you wanted.
That's something you could work on.
And the last thing here is, check this out.
We just entered an empty room.
A room with name space has been added to the database.
That's a problem, so.
That's something we need to capture as well.
This is all stuff you can work towards.
If you get bored and if you want to work towards it.
But you can see that this is all stuff, if you're creating an app that you have to take into account.
And just one other thing as well that is rubbing me the wrong way.
Is this elif tree here.
I don't like that, I've done it just for demonstration purposes but essentially you would preferably throw all of these into a dictionary and make it a bit more Pythonic.
There's no need for it to be this large.
But either way, this is your little go to points to see if you can expand on this and improve it.
If you wish.
You might even just think about writing this app yourself in a way that you see fit.
And covering these problems as you build it.
So have fun.
|
|
|
show
|
1:06 |
Okay and that is it.
Hopefully by now you've got a nice fully functional home inventory app going and you learned something on the way, okay.
Especially with SQLite and with the generator and whatever other cool little ways you've managed to make this app your own.
I'm not going to bother going through any slides for the finale of this lesson set, just because we did go through quite a lot of content.
What I will do is, I will show you the ReadMe one more time, just so you know what you can do with this if you haven't done it already, is run yourself a GUI or a web interface.
I think that's the next logical step for this app because it would be a lot of fun to be able to bring up a website and enter in your entire room into one form and have it submitted to a database, okay.
So, this is your turn.
Obviously, go ahead and identify the pitfalls and the bugs as per that video and make them your own.
Solve them, resolve them.
See if you can turn it into something great other than just a CLI app.
And that's your home inventory app.
|
|
|
|
37:06 |
|
|
show
|
1:18 |
Are you ready to have some fun playing with the database?
Well, we're going to talk about an amazing technology called SQLAlchemy.
And this is probably the best way, and also, probably the most popular way to access relational databases.
Previously, you learned about SQLite, and SQLAlchemy will of course talk to SQLite, but it'll talk to all kinds of databases.
You can find it at SQLAlchemy.org.
It's an object relational mapper.
So when we saw SQLite before, you just created strings, and you said, "Create this table," or, "Select this from wherever." You would write in line SQL, and that was tied to SQLite.
Well, SQLAlchemy works in a much higher level.
What we're going to do is we're going to create classes, and we're going to model the database shape in our classes.
SQLAlchemy will actually even create the database from the classes, alright?
So this is really, really powerful.
We can point at almost any relational database, and then we work in these high level Python constructs, making it very, very easy for us to write the code.
We don't have to think in the SQL query language, we just think in Python, and it just works.
It's up to SQLAlchemy to convert that to the SQL query language.
It's really, really easy to get started.
It's extremely flexible and powerful.
And we're going to have a lot of fun building an app with it.
|
|
|
show
|
2:38 |
Let's get right into writing some code.
Now, if you look in the GitHub Repository, there's two sets of code here.
They look exactly the same right now but they're going to be very different at the end.
In this project, we're going to start from an existing application.
One that's already done and all we're going to do is add database access to it.
It's a bit of a trade off that happens to be more realistic, more entertaining, but slightly more complex by starting with something instead of entirely from scratch.
But we'll isolate the SQLAlchemy pieces really well.
So this one, this persistent RPS starter, this is going to stay in the starter state.
This one on the other hand, we're going to evolve to the final version.
Now before I open this in PyCharm, let me come over here and create a virtual environment.
And now on MAC OS we can drop it here, or on Windows or Linux, you say file, open .directory.
So let's go through and have a quick look at what we got here.
First, tell PyCharm to chill out on the virtual directory.
Start up the program.
So this is the thing that we're going to run.
Let's just go ahead and run it so you see what happens here, in fact, yeah just run it like this.
So we're going to play, you might've guessed from the RPS, Rock Paper Scissors.
And we're going to use a database to store all the players who have played the games, all the games that have been played, the roles, who has won, who has the highest score, we'll do reporting on that so we'll sort of show the high score screen by just doing a database query and order by times they won, things like that.
It starts out asking what your name is.
And then we're going to play not rock paper scissors, but we're going to play 15-way rock paper scissors.
So really fun, we have things like: the devil, and the dragon, and the sponge, and so on.
So let's start by throwing standard rock.
I need that a little higher so we can see what's going on here.
Oh!
I've been defeated.
I threw rock, but the computer threw water.
Apparently, water beats rock.
How about fire?
I'm defeated again, this is not going to be good.
I'll throw a snake.
The computer also threw the snake, so let's throw eight.
Paper.
They threw tree.
I'm not looking...
I don't think it's going to matter what I'll throw so let's throw a tree.
I threw a tree, they threw a scissors, I win, but the computer wins 3-1.
We had one tie, three wins for the computer, one for me.
Therefore, I lose.
So we're going to take this game, as you can see it lets you play but it doesn't show you a high score.
It has no history of the game.
If I run it again, it just entirely starts from scratch.
So we're going to go over here and we're going to upgrade this by using SQLAlchemy to make it remember.
|
|
|
show
|
2:17 |
So, you saw the game being played.
Let's look at the code that we're going to work with.
We're going to come here to our main method and programs.
This is where it all gets started.
So, we'll print out the header, we'll print the high scores.
Right now there are no high scores 'cause we have no memory of stuff.
So there's not going to be a whole lot happenin' there.
We're going to build up the roles and now, this is worth checking out.
Over here, in this battle CSV, we actually have the sort of win-lose table for rocks, guns, lightening and if it, you know, the lightening attacks the devil then apparently the devil beats, the devil beats lightening.
Alright, something to this effect.
We're going to use that, we're going to build up these roles and sort of indicate which thing can be which.
We're going to create a couple players and then, we're going to go to this game loop thing and say, "Run." So we have three parts of the game happening over there.
Notice here we're just pulling in this CSV file and we're allocating a row object, which we'll talk about in a second.
And here we're just putting in some more details to figure out what opponents this thing loses or wins to.
Here's a little header.
And here's the high scores.
So, let's go ahead and start by looking at this game service.
This is where much of the database access is going to happen.
So you can see all those little parts here basically become database queries or inserts or updates.
So, here we're going to go do a query and find all the roles.
Here we're going to find one for, a particular name.
So, Devil, for example.
Here we're going to record a move given by a particular player, a particular role, that was their move, the game id, whether that won the game, if it was the final game play.
what stage in...
you know, what step in that particular game.
Was it 1, 2, 3, 4 or 5?
As we saw, the 5 that we played with.
So, we're going to go.
Basically our job during this section is to use SQLAlchemy to fill out this section here.
And, over in the models we have things like a role, which has almost nothing on it right now.
This is like Devil or so on.
We have some moves.
And this is more interesting.
This is like a history.
So this is like, what role did they play by id, what game is this associated with, uhm, what position.
Right, this is what we're just looking at there.
So, we're going to convert these standard classes into classes that map to our database using SQLAlchemy.
So, I think that's a good place to start.
And, we'll do that next.
|
|
|
show
|
3:01 |
Now, the first thing we need to do to use SQLAlchemy is to create some classes that map to our database.
Now, these are classes, theoretically, we could read and write them to the database but there's a specific way in SQLAlchemy.
So, there's basically two steps that we have to follow.
The first one is to declare, create this base class that SQLAlchemy knows about.
So, we're going to declare a specific base class that SQLAlchemy knows about and then everything that derives from it is automatically going to be related to a database table.
And SQLAlchemy, by way of this derived aspects, will learn about those tables and those classes.
So, the first thing that we're going to do is going to look really, really lightweight.
It's going to look like, why did you create a separate file for this, but if you're going to do this nice partitioning or have, one move class in one file, one player class in it's own file, one role class in it's own file, and so on, it makes sense to go ahead and make one more, albeit, super small class, we're going to call this model base, like so.
And we're going to start just by importing SQLAlchemy.
Now, this is not going to go so well because we don't have SQLAlchemy installed.
So, let's go over here and actually make a requirements.txt file, and put sqlalchemy.
Now, this is not set up.
Notice over here we have our virtual environment if we do a pip list, there's only those few things here.
So, let's do a pip install --upgrade setuptools don't know why this is so old but it's like 10 versions out of date.
So, let's get it out of the way.
Now, we want, go ahead and let PyCharm install SQLAlchemy, and it's all good.
So, go back to our model base here, this is good.
And what we actually want, is we're going to say from sqlalchemy.ext.declarative we're going to import declarative_base.
Now, this is a function, which when called will create a class not an object, a class.
It's a little bit funky but here's how it works.
Instead of say it defining a class like this, and you put some kind of base class and details, we're going to let this function do it.
And we do it like this.
That's all there's to it, this whole file is now finished.
But anything that needs to become an entity that's stored in our database, it derives from this.
So, now we can come over here and say, hey role, you want to map to a database table?
We just import this, like so, and we're good.
Do the same for player.
And the move.
Now, PyCharm can go a little crazy here and say oh, you need to add this to your requirements.
No, no, I don't.
This thing right here, that is their requirements.
You can come over here and put this little statement to say, you know, this is not actually an external thing, calm down.
Okay, so we're halfway there.
Step one is to derive from this model base, on all the things we're going to map to the database.
Step two is going to be to define the columns.
|
|
|
show
|
4:56 |
Now, let's go ahead and define the columns that are going to be in our tables, and also, how they appear in the classes.
So, here we're defining the name property and in memory usually the thing that defines what specific item you have is just the address in memory.
Like, when you created the pointer to the thing, that is kind of it's id, but in the database world we typically need to set and id to a particular thing.
Let's say none for second and we're going to set the name to something else.
We can also control what table this gets mapped to.
So, if we do nothing it will just be added to role, like capitol 'R' role and I'm not a super fan of that.
So, let's say table name is going to be roles.
Plural, lower case, I kind of like that better.
Alright, so how do we tell SQLAlchemy, if this is an and id, and even a primary key, and auto incrementing, unique, and all that stuff?
Simple enough we say SQLAlchemy and we add that to the top and we say column capitol 'C', not lower case 'C'.
There's two for some reason and here we'll say what type of things SQLAlchemy.Integer.
We'll say primary key is True.
Auto increment, True.
Okay, so that's great.
That's going to get us started there and this is going to be a string, that's what we say, string.
Now, we might want to add some other features like this role is supposed to be the one and only dragon, or rock, or paper, or something.
So, we could come over here and say unique equals True, as well.
No creative uniqueness constraint for the database.
This go moved out of the way by it's own self, but that's okay.
If a role, it's going to have an id and a name and whenever I'm working with databases there's one other thing I really like to know.
Like, when was this record created?
Is this old, is this new?
It doesn't matter so much for the role, but for players and the history that's going to matter a lot.
Let's go ahead and add one here as well.
It's going to be a SQLAlchemy.DateTime.
This is pretty good, it doesn't have to be unique, but what we would like is to not have to bother to manually set this, but just have this happen automatically.
Saved role, the created time was when it was first created in the database.
So, we can come over here and set the default, simply some kind function, how about date time, and I'll have to import that .date.time.now.
Now, it's super critical you don't put these parentheses here.
You just put the functions here.
You put the parentheses, everything is going to be created when the program starts.
If you put a function it will be called every time something is inserted.
So, we want this kind of now and I'm going to copy this because we're going to use it actually, probably want both of these top ones here.
Perfect.
So, this role class, this role model is going to be mapped to the database is 100% done.
Let's quickly knock out the other two.
Now, the only other thing we're going to have here is the players name again.
So, this will be super easy.
It'll say novel is false.
This is a required value you have to give it to us.
Okay, we can also put that in our role while we're at it.
Here, you have to say the name.
So, again the player classes are pretty much ready to go.
Now, it turns out that this move is the most complicated and we're going to sort of stop short of some, maybe some full modeling here.
Just for the sake of keeping us time bounded here, but we're going to say the table is moves.
Then I'm going to put in a bunch of columns we're going to talk about.
So, like before we have the id of when it was created and now we have some sort of relationship thing.
So, what role is it associated with and what player is it associated with?
So, these are integers and it's going to be foreign keys back to the other thing.
Now, we could model these relationships, but like I said, this is a super quick intro to SQLAlchemy and not to deep dive into it.
There's a lot of complexity to those relationships.
So, we're just going to kind of keep them loose for the time being.
We'll have a string, which is like some sort of UUID type thing for the game.
So, we know when the game is played, which it is, this is the role, like this is the first round, second round, third round.
Who played that particular role, and is this the play that wins the game?
Alright, is this the final play that beaks this up.
You typically might say well, that's always going to be the fifth one.
Unless, there's some kind of tie and we tie, and tie, tie, and this keeps going.
Alright.
So, it can get slightly more complicated because of ties.
So, we need to know when the last, and when the particular play is the final one that is the winning play.
Okay.
So, with this we have our classes all defined.
We've got our role, our player, and then for historical reasons, we have our moves.
Of course they all derive from this model base, which is super simple to create.
Not obvious, but very, very simple to do and we did that in our model_base.py file.
|
|
|
show
|
6:24 |
Now SQLAlchemy is powerful because it can connect to any type of database that is relational.
Oracle, SQLServer, SQLite, MySQL, you name it.
But that means we have to tell SQLAlchemy where the database is, what is the connection string, how do we get to it?
So we're going to real quick things to get started here.
We're going to create a quick directory.
In here, we're going to do a little trick just to find this folder super, super easy.
Call this db folder.
We'll define one function, get_db_path.
And it's going to take a base file name and this'll be like rps.bin or something like that.
And from that, we need the full path.
So we're going to use a cool little trick here, using os.
And we'll say base folder is os.path.dirname of this particular file.
So what folder is this file located in?
It's in here, and we want our database to also be created in that same folder.
So we're just going to say return os.path.join, base folder, base file.
So not a whole lot going on here, but this is going to make it nice and easy for us to create, we're create just a SQLite file that's going to live here.
And we'll create a data access bit here.
And let's add a new part here, say, create this to be a session factory.
These are not the models that we're modeling the data on, these are the sort of connection, low level infrastructure type things.
So we're going to create the session factory thing and its job is going to be to create what's called a unit of work.
And SQLAlchemy, the way it works, is you create this session, you do queries, inserts, updates, deletes.
And you can either commit those changes or throw them away.
So the job of this is to set up the connection and create these sessions that we can do the rest of our work with.
So we're going to need a few things here.
We're going to need the ORM, this is the object relational mapper, this is really interesting.
We're going to need the db folder.
We're going to need our model base, we'll work with that.
Now there's one final thing that's a little bit weird but we're going to need it.
Now at this stage in the program's life cycle, it may not have interacted with these files, the move, the player and the role.
For what's about to happen, SQLAlchemy has to have seen and loaded into memory all of these things.
And if that hasn't happened yet, we're going to miss some things.
Like maybe one of the tables won't get created or something weird like that.
So we can make sure that this is not a problem here by just importing everything we need.
So move import, move player role.
Whew, so that's a lot of imports that we're going to need but we are all ready.
Now we're going to create a thing called a factory.
And it's going to be nothing in the beginning.
So we need to do is write a function that will get called one time and initialize everything.
So we'll say def.
It's going to work with this factory so we'll say global factory so it can change this from outside without, and overwrite it with a local variable bit.
We want to change this, one and only factory, there should be one of these in the entire process per database, not a bunch.
So let's use our little db folder thing to get the path, and let's call this rock_paper_scissors.bin.
Extension doesn't matter, just something I like to stick with, or actually let's change it to sqlite, how's that?
Even more clear what it's supposed to be.
And we can create our connections string, this you saw already, is going to be sqlite:///.
So this tells SQLAlchemy what kind of database it's talking to.
Is it SQLServer, is it SQLite, is it Oracle?
And then for SQLite the connection string is just the file name.
So this is nice and straightforward.
The next thing we're going to do, is we need what's called an engine.
This manages all the connections and the connection pooling and stuff like that.
And just like the factory, there's one of these per database connection.
So we say create_engine, and then all we have to do is give it the connection string.
And you can also, if you wanted to debug this, you could say echo equals True.
I'm going to say false, so we can see what's going on, but if you switch this to true, you'll see every command issued to the database by SQLAlchemy in SQL form.
So that's really nice.
Now the next thing we need to do is actually create the structure.
If the database doesn't exist, like right now, there's no database file here, we would like to have SQLAlchemy get it up and running and get everything connected.
So we can say model_base.metadata.create_all, and we'll have to give it the engine.
So this is going to run and actually look at all of these classes up here, and it's going to create the related tables that we told it about.
And finally, after all of that, we're ready to create our factory.
So we'll say sqlalchemy.orm.sessionmaker.
And the session needs to talk to the database.
So the way that happens is we bind the engine to the session factory, therefore all created sessions know how to get back to the database.
Whew, okay, and that is that.
The other thing we're going to need to do, just from making this work a little nicer, is we want to be able to safely create these sessions.
We could directly work with that but it's problematic.
What if we forget to call this, how do we check that, and so on.
So let's do a little create_session function here.
Instead of forcing other people to call that we can just check, do we need this to be called.
So we'll say global, we'll say if factory is none, like it hasn't been created yet, then we'll call global in it.
Otherwise, this is super easy.
We'll just say factory, and again, you call it, it's a session factory, when you call it, it creates a session.
Okay so, that's all we got to do.
The last thing I would like to do here well, maybe two things.
One is, PyCharm thinks we're not using these, but they're important that they're here, so let's go over here and say suppress that.
That's good.
Great, okay so no more complaints up there, everybody's happy.
The other thing to do, is when we import the session factory and hit dot, we'll see factory, we'll see create_session, and global in that, what I'd kind of like to do is make this not accessible from the outside so we can do that by refactoring it to a double underscore and then it'll be hidden by Python from the outside.
That's kind of a private variable for this module.
Our database is all configured, our models are built, now all we have left to do is just use this database access layer to actually create some history in our game.
|
|
|
show
|
7:34 |
Alright, we have everything set up and ready to go.
We can access the database all we want.
Now we just need to decide what do we want to do with the database?
So if you recall over here in program, there's this game service that's being used in a couple places.
Find or create a player.
Alright so one is going to be us, the other is the computer.
Down here, get the game count, get the all players.
Now this is really a nice design pattern because that means the only data access that's really happening in the entire program is in this one file.
If you have a really complicated app, maybe you create different types of these little data access layers service type things.
But, you isolate it into one place.
That means if you decide like, hey, I'd like to switch to some entirely different type of database or completely change this around to call web service is instead of to call data access layer direct database access.
It's one place that you change.
So, I strongly encourage you to create this kind of pattern that isolates all the database stuff into one place.
In order to make this work, we really just have to write the code to make these things go.
Let's start over here.
If we want to say get the history of a game, how do we do that?
Well, remember that session thing we talked about.
This is how it's going to start over and over and over again.
So we'll say session factory and we'll import this up at the top.
And down here we can say sessionfactory.create_session.
Notice that we do not have a factory.
Alright, there's no factory.
so we're just going to say create session.
And that's going to create this and at the end, we're going to do session.close.
If we had made changes, we would say commit.
But, we're not going to do that.
Okay so we've created our session and now we can create a query.
So I'll say the query is going to be session.query, and you give it some kind of type.
We're going to look for moves.
So what we'd want to get back is a list of moves.
So we want to come in here and say query of move and then we can do a bunch of things.
Orderby, filter, all, first and so on.
So we're going to say filter and the way you do this is you go to the class and you say what are we looking for?
Game id equals, do a double equals, not a single, equals this.
Now we can wrap that around and we want to do an order, orderby, and then want to say we want to orderby move, roll number.
Here we're going to say roll one, then roll two, then roll three within this particular game.
And then we want to return all of those as a list.
So we'll say .all, we'll say moves equals list of query.
And then we'll return the moves.
Now, you might say it's slightly less efficient to turn this into a list, instead of like return this back and iterate over it, and that would be cool.
However, this means that all the data access is done by line 21.
Then we close the session and we can just say forget about database access.
We are now back to just working with Python objects.
So, this is great.
Let's go ahead and write the rest of them.
To figure out how many wins a player has, we'll create a session again or create a query on the move.
I want to say, I want to find the move that is for this particular player and is a winning move.
This is the move that wins the game for that particular player.
If they lose the game, this never gets set.
So, that doesn't count.
So, this thing here will get us all the moves, then we can call .count instead of get the objects back, this'll just give us a number called wins, close the session and carry on.
Now for find and create a player, this one has sort of two modes, which is, makes it somewhat, more cumbersome.
But, what we're going to do is we're going to come in and create a session.
This is how it always begins.
Create a query for the player.
When I say I would've liked to find the player by name and this time just give me the first one.
Remember, the name is unique so this is one or zero we're getting back.
If we got one back we'd just close the session and say, "Here, this one already existed.".
But if we don't get one back, that means it's time to create a new player.
Right, we've never seen this player.
So, what we're going to do is create a player object, set the various values, the only one that doesn't have a default of any form is the name so it's kind of boring.
But, we just set the name.
We'd set all the things, if we're setting more.
And then the way it gets in the database, so we say session.add and then session.commit.
Now, if we were not using player again, the object, and we just wanted to create it and forget it, this should be fine.
We'd just be done.
However, once you call commit, all the properties of this object get stale.
And you have to like reset them and try to get them back.
Which is kind of, annoying.
So, what we're going to do is just get a new object back from the database and this one, will not, this one will not be stale.
Right, the commit flag won't tell that we got to re-read that data.
So, sort of refresh this object after it's in the database and send it back.
Getting all the players, actually this is the easiest query we're going to write.
All we have to do is go to the session, create a query player and say all, hit that with a list to read through it, close the session and now we have all players.
We might want to do an orderby, alright maybe order by name.
But, if you don't care about ordering, this is all it takes.
While we're at it, let's do all rolls.
This one's basically the same.
We're going to get all the rolls, and this time we actually do want to order them by name.
So they're alphabetical, that'll just make it easier to find in our UI.
Convert that to a list and return them.
It's all good.
Oh, except for I put that into the wrong spot, didn't I?
There, there's all our rolls.
Want to find a roll?
Here, we're just going to go through and say create a query based on roll, where the name is that and go first.
It's either going to give us one back or not, which we've indicated with a optional roll.
Rather than it's just a roll, it's a return value.
Now, for creating a roll, it's going to be very similar to what we did before.
I'm going to come down here, create a session, we're going to create a roll and this time I think we just got to say roll.name == name.
There's no more constructor initializer there.
Save it and re-refresh it so that it's not stale, and give it back, all good.
Only have one more left here and that's record roll.
This has probably got the most going on in terms of data.
So we'll come down here and we'll set all these properties.
And we're going to create a session, create the moves, here we set all the things we care about that don't have default values.
Again out of the session, commit, close.
We don't even return it back.
We don't care about getting the record of the move, we're just going to say put it in the database, I'll ask for it back some other time.
Now that defines all of our functions.
Let's see if we run it, if it'll even work.
First of all, before I run this, look over here.
If I do a quick refresh, sync.
We now, that I already ran it, just this second actually created this rockpaperscissors.sqlite.
And notice that it's a database icon.
That's not because of the extension, that's because PyCharm looked at it and said, "I understand what that is.".
So, we're going to be able to work with that in a second.
Let's see if our game just runs.
We may have to go fix it up.
Michael, here's all our rolls, I'm going to throw some water, and I'm going to throw some fire, just keep him off guard there, maybe some more fire.
how 'about we throw down a tree and let's see if we can hit him with some scissors.
4 to 1, dominated.
That's pretty cool, let's run it again.
Look at this.
Now here's our player history.
In a historical perspective, Michael's won one time and the computer's won no times.
Let's throw Jennifer in here, see how she does, 2.
She's going to throw some air, lots of air, who wouldn't want to throw a sponge in there?
Maybe a little wolf action.
Boom, Jennifer also wins.
Now if you run it again you'll see Michael and Jennifer won, the computer zero.
How cool is that?
And this is in our little database.
Let's look at that a little bit deeper.
|
|
|
show
|
0:55 |
For the grand finale, let's just play one more game, full-screen, not stuck inside of PyCharm there.
So we'll come over here, you can see I have my virtual environment activated, so I'll say Python program, and in here, we're already reading from that database.
I've got Michael's wins once, Jennifer wins once, and computer.
Now, if I say Michael, it's going to go and find that same player again, and I'll just play some dragon, some dragon, a little bit of lightning.
Am I doing, doing alright, I won that last round.
Let me try a little snake, and we'll finish it off with some fire, five to zero, amazing.
Alright, now if I run it again, you'll see, now I have two wins, Jennifer has one win, computer getting crushed this time.
This is the game I built, and you can see it wasn't totally easy to build up those relational classes and so on, but it really wasn't that hard.
And we built our little separate database service, our game service, code, so all of our data access is contained within just that little set of files.
|
|
|
show
|
1:25 |
Before we put the wraps on our game, let's have a quick look inside the database.
Julian already talked about DB Browser for SQlite, runs on all the platforms this little thing.
This is quite cool and if this is what you want to use I totally recommend it.
It looks quite nice.
I'm a fan of PyCharm and PyCharm also already has tools for this.
So if you go over to database, and you hit the + and say data source.
Now if we pick Sqlite serial, you'll have to make sure if it doesn't say driver, there's a little button to say download the driver here.
So if you don't do that, this is not going to work.
But once that is done, I'm going to drag from here to there, you can actually see what is in our database.
Go to schema, to main, hit our moves players rolls.
Roll moves is most interesting, let's look there.
Here you can see it's all the various pieces.
These orange things mean these have indexes.
Here's the actual details.
I can even come over here, jump to the console and say select star from, move to where, and you get all sorts of details.
Like let's say player id equals one, that's probably me.
Then there's all the moves that I made since I entered first into the game.
Pretty sure my id is one, we can check that.
Anyway here's how we query it, and you can see all the different games that this has been running in and so on.
So this is really nice when caveat this only works in PyCharm professional.
If you have PyCharm community well you're going to need to use something else right.
The database access stuff is not part of that so I'd check out that DB browser for Sqlite.
|
|
|
show
|
3:18 |
Let's quickly review some of the concepts that we learned.
We saw everything started with our model base and we got that by calling declarative base that gave us a type back which then we could use to derive from.
So we get this base class, and then we derive all of our various entities from it.
In this particular example when we're looking at an online record store with albums, tracks, purchases, users, and so on.
We'd create an album, track, and purchase all deriving from our SQLAlchemy base that we create.
When we want to model one of these classes, we want to use the class to model some data.
We set the dunder table name, pick out the various columns we need.
So here we have a primary key auto-incrementing id.
We have a name, year, price.
We saw that we can put uniqueness constraints.
We can put indexes to make queries on that data or ordering by that data super, super fast.
And we can even set up relationships.
But like I said, we're not going into relationships.
We've already spent a lot of time on discussing SQLAlchemy.
It's time for you to jump in and write some code.
Once we've modeled all of the classes, then we need to actually create the database connection and make sure the database is in sync with what we define the classes to be.
Here we're going to create a connection string which is just a sqlite:///.
Put it in a file.
We'll create an engine based on that connection string.
We're going to create, go to the metadata for the SQLAlchemy base and call create all.
Pass at the engine so it knows how to do that.
Then finally we're going to create a session factory by calling the session maker, giving it the engine.
We'll being using that for our unit of work for all the queries and transactions and so on throughout the rest of our app.
If we want to create a query and pull back a single record, here we'd create the session.
We say, "query of the type".
So we're going to query the account table, say, "filter emails this.filter".
Password hash is that.
Now this double filter is basically an and.
So, here we're doing a query where the email is what we specify, and the passwordhash is what we specify.
Or we're going to get nothing.
And then, we can just get one back.
So we can either say one or first and then we're going to return the account that we got back here.
What does that look like in the database?
It's select star from account where account email is some parameter, and account.passwordhash at some other parameter.
And the params happen to be my Gmail address, and some random text I threw in there.
Finally, you might be familiar with the SQL query language but not SQLAlchemy.
And wonder how do these things map over?
So equals, simple that's a double equal.
Not equal, that's also kind of simple.
Not equal goes in the middle here, and then it gets a little interesting.
If you want to do a like query that's like a substring, I want all the names that contain the substring ed.
That's a .like('%ed%).
So the percents are like wild cards, can match anything.
Long as ed is in there somewhere we'll get that as a match.
N, so I want all the users whose name is either Ed, Wendy, or Jack.
You and put the little tilde in front of this whole thing and say, not in.
You can say null is None.
And is just multiple filters.
Or is a little more complex, but there's an or operator that let's you pass a tuple along.
Or actually just multiple parameters and that will turn those all into an or.
So you can see the link for all of these and there's more as well over at the SQLAlchemy website.
Alright so that's SQLAlchemy.
I hope you really enjoy it.
It's really a great way to build professional, data driven applications.
|
|
|
show
|
0:55 |
Now you've seen SQLAlchemy in action, it's your turn to put it in action on whatever you want to build.
So, jump over here to the GitHub repository and check out the SQLAlchemy section.
What we're going to start with is, we're going to pick some application that you've already built.
You're most of the way through this class, so you should have a lot of apps.
You can pick one of the games.
You can pick another application.
It doesn't really matter.
And you're going to add database persistence to it.
And you're going to add the ability to use that to run reports, or keep sessions going across runs of the program.
Something to that effect.
So we're going to start out on the first day by just really picking out an application, and then creating a virtual environment and installing SQLAlchemy.
We'll get this all set up.
If you get a program that can import SQLAlchemy and run, then you're pretty much ready.
Today was mostly about just watching the videos and learning.
So this is just to give you something to start with the next day.
|
|
|
show
|
1:45 |
On Day 2, you're going to focus on building out the database models and the database structure.
So, recall from the presentation, that what you need to do is use some kind of base class that comes from SQLAlchemy, and have all of your models derive from that.
So, here's the example we had for our move, in our game, and it derived from model base, we controlled the table, by putting table name in there.
This is optional, but I like to do it.
And then we just defined all the columns.
Has integers, or has date times or strings, and then be sure to give it a primary key, and auto-increment if that's an integer, nice and easy.
And then you're going to need to actually go and create the database, using your base model there.
And create a session factory for use later.
Alright, so if you run this code, already, you should actually have some kind of database file, and whatever you call it here, you'll have down here.
And then, you can either look at it, if you're using Pycharm Pro, in Pycharm Pro, or you can use a DB Browser for SQLite.
Either way, this is going to get your database structure all up and running.
Final warning, or final note here: Beware, you cannot modify existing tables, so for example, this move, if I decided I also wanted some other value here, like the opponent's role, or you know, whatever, if I want to change this, at all, once I run this bit here, it's fixed, can't change it.
SQLAlchemy will just ignore it, and it probably will crash when you try to work with it, who knows.
So, if you want to do that, you need to use what's called migrations, or for this little example, the easiest way would be to just delete the database file, and start over and it will create it, new.
But in production, migrations, or some kind of database script to do the change, is what's required.
|
|
|
show
|
0:40 |
Final day of SQLAlchemy, you've got your app selected, got it running, you've modeled your classes and created your database structure.
Now you just need to work with your data.
So you're going to insert some records, save some data and insert it, and then somewhere do a query.
Do a session.query of the type of query you want, and just look back at the example.
We should have a variety of types of queries.
You should be able to make one of those adaptable to what you're doing.
So just use this database, put some data in it, and make your application more awesome from it.
All right, I hope enjoyed SQLAlchemy.
It's really a wonderful way to work with databases, one of the more popular and flexible ones at that.
|
|
|
|
23:34 |
|
|
show
|
2:50 |
Hello again, it's Michael.
And we're getting really near the end of your 100 day journey.
And I think this topic is going to be a really nice one to round out some of the work that you've already done.
We're going to talk about building GUI applications.
That's right.
Windows applications, not terminal applications.
You're going to work cross-platform just like Python, in fact, we're going to take it a step farther, we're even going to bundle these up so nobody will even know you wrote them in Python.
Right, you give them an .exe, or .app, or Linux binary, and they can just run it.
It's going to be amazing.
Here is the simple application that we're going to build.
Now, we're going to start pretty simple.
We're not going to build super complicated applications, but we're going to use a framework that basically takes CLI, command line argument apps, and converts those into what we would have in some sort of GUI here.
So, what might have been a command line argument, the search term, or the mode, are now UI elements.
One you can see is free form text, one is a dropdown.
Really, really nice framework.
The framework we are going to use to build this is something called Gooey: G-O-O-E-Y.
You know, it's a play on the spelling phonetics of GUIs, I'm sure.
But it turns almost any Python command-line program into a full GUI application in just, maybe not one line of code, but just a couple lines of code.
Really, really simple and easy.
So, the bang for the buck on this one is amazing.
It's really nice to have a GUI application and yet it's really, actually not much work, if you're willing to accept a simple UI.
So, Gooey, we're going to do that.
We talked about packaging Python applications.
It's one thing to have a script that shows a window, it's an entire another thing to give a simple, single application to a non-technical person who may or may not have Python installed, who may or may not have the right version or any of the dependencies installed.
Just give them one thing that they can run.
Like on Mac, it'd be great if they could just have like a movie search app they could double-click and it would run.
Or on Windows, a movie search app they could double click this .exe.
There's nothing more to it.
It's literally just this .exe file, you do that and you run it.
Or even, over here on Ubuntu.
Give them the movie search app, they double click it, it runs.
Don't have to set up Python, it doesn't even have to be installed on the machine.
Just like any other fully packaged application, it's ready to go.
For this, we're going to use something called PyInstaller.
So, there's sort of two parts to this whole section.
We're going to one, build the GUI application.
Two, an additional step to add this sort of packaged element in this distributable version to it.
It's really fun.
I really hope you enjoy it and we're going to get started right now.
|
|
|
show
|
2:49 |
All right, let's jump right into writing some code.
Now we're going to start with some already existing code.
In fact, you've seen the application we're going to write already, just in an entirely different form.
Remember way back when, for the movie search app, where we consumed JSON APIs?
So this would be the 'set of days' base that we worked with the JSON APIs.
We're going to take that application, which was definitely just a terminal, text based interactive application, and we're going to turn that into a Gooey app.
So here you can see I've made basically a copy of those and I've changed it just a little bit.
We're going to open this in PyCharm, but before we do, let's just go over here and set up a virtual environment, like so, and we'll just all it venv and we'll just drop this folder onto PyCharm.
Now, while it's loading, notice over here, I have this starter search app in the file.
So this is the starter code.
I'm going to leave it exactly as what you're about to see.
I'm going to take this one and evolve it into the final version.
Alright, so let's go over here and get started.
So I'll add the root, look over here, and we'll pip install -r requirements.txt because we have a couple of things that we need for that application.
Namely, we really needed requests, right there.
Later we're going to add more to this, but for now it's requests.
These files are red because they're not yet staged in Git, which we'll do shortly.
Now I've changed this just a little tiny bit.
I've gone over here and I've added the ability-- Originally what we could only do was find by keyword, now we can also find by director and we can find by IMDB code.
So let's try to run this.
So here's the command line addition.
So let's search by director, I'll say Cameron, so Avatar, that kind of stuff.
There we go, Almost Famous, Jerry Maguire, Avatar, so our search is working, and this is finding all the ones that James Cameron directed.
Okay, so this is working just fine, and notice, right now we can pass it, or we can select at the moment in this input mode, We can select whether or not it's a director, or it's the IMDB code, or when we started to fall through.
The last case is just a generic search here.
So we're going to do a couple of things.
The first thing we're going to look at is we're going to see how do we make this a Gooey application?
And then we'll package it all up.
So we're not going to change the functionality of this application hardly at all.
In fact, we're going to more or less just leave it like it is, but instead of getting the inputs from the user via these input statements here, we're going to get them from a beautiful Gooey.
|
|
|
show
|
2:15 |
Now, before we actually add Gooey, let's just change this around a little bit so that we can have a cleaner separation of where we get our data versus where we run it.
Notice we're asking for the mode here, and then based on the mode we're doing these three things.
I'm going to come over here and make a new function, put that down on the bottom, and call this get_parameters, or get_params, something like that.
We're going to do the same thing here.
We're just going to keep it the same.
Instead of doing the search, we're just going to return which thing it is that we want to do.
We're going to return the mode.
Let's say, yeah, return mode from director.
We're not going actually going to do the search.
We're going to return the mode and the code.
And finally, down here we're going to say return mode and keyword.
We can come over here and say we're going to come over here and say mode and value with the comma there.
Sorry, your equals get_params.
These two values that come back are going to go here.
I guess we could even put this little part down here, this little print statement.
It belongs together.
Instead of doing this, if the mode is that, we're going to say we're going to pass the value over here.
Instead of doing this, we already asked that question.
It stored a value.
Instead of doing this, we're going to go over here and say value.
Let's just see if this runs.
All right, I want to search by a director, Cameron.
Seems that works.
Let's try one more.
I want to search by keyword, capital.
Try again.
Keyword, capital.
There we go.
You spell it right, it works really well.
Okay, so this is working.
It's nice because we just have this one function, and we get these two values back.
It's this point where we can plug in our Gooey stuff.
All we have to do to create our Gooey is to add a decorator right here, and then basically tell Gooey, G-O-O-E-Y, what the parameters it's supposed to ask for are, and how to describe them to the user.
Like is this a drop down with a list?
Is it a text input?
Things like that.
|
|
|
show
|
5:25 |
Now we're ready to incorporate Gooey.
So, first thing we have to do is install it.
Over here, we can say pip install gooey.
Now, this works fine on Windows and Mac, I've found there's a little bit of a problem with Linux.
I'll show you that in a second.
But notice that it's depending on wxPython Phoenix, which is a brand new version of wxPython, a cross platform GUI thing, very nice.
The G-U-I version, and then Gooey is built upon that.
So while that's installing, let's look over here.
I've noticed that there's a problem installing this, and I couldn't get it to work, so if you run these two sets of commands on Ubuntu, at least if you're using Ubuntu, I haven't tried it on anything else, they should get everything set up and ready to go.
And then, you'll be able to work with wxPython and Gooey and so on.
Without this, I couldn't get it to install.
By the way, this takes a really long time, like ten minutes or something crazy like that, so just be aware.
Here's the link for it over here in the Phoenix release, the 465.
Okay, so this is all set up and ready to go, and the other thing that we want to do, just for completeness sake, is we want to make sure this gets put into the requirements file.
Partram will do that for us.
So let's say this: from gooey import GooeyParser.
We're going to need that to, actually, that's basically the thing that triggers the UI.
We need this other thing, Decorator, that will let us basically say run this method, and get the parameters from it.
So we'll come over and say Gooey, I'll say Program Name, this will be Movie Search App, and we'll set the description.
Search, talk, Python, Demo data for movies.
Remember, this is just the search, the movie search jacent API we've already played with.
Let's change this to the Gooey Edition here.
This is the first thing, we have to put this Decorator, and the other, let's go to this get params.
Now all of this stuff, we don't need this at all anymore.
What we're going to do is, we're going to create a thing called a parser.
That's going to be the GooeyParser.
Then, on the parser, we're going to add a couple of arguments.
This is super varied, you could have all kinds of flexibility here, but we want to do two things.
A basic search term, and well give it, we'll say help equals the search term, or keyword, something to that effect.
We want another one that's a little bit more complex.
So we'll come up here and say, dest=mode.
That's going to be the name of the parameter that comes out.
The widget, here's where it gets interesting, this is a dropdown.
Alright, there's a lot of different type of widgets, and our choices for our dropdown, tell PyCharm that's spelled correctly.
That's going to be by director, by IMDB code, you can just say director, IMDB code, and keyword.
Okay, so we got this and then all we need to do, actually, keep that for one more moment, we have to go over here and say args = parser.args parse args.
This actually is what triggers the UI.
And then in here, this is a dictionary that contains two values, search term and mode.
So we can just say return, we return first the bottom mode and then the value.
So args.get_mode, args.get_search_term.
this little bit of code right here, that should do it.
Let's go ahead and run this and see what happens.
So we got our new way of getting arguments through the UI.
we've got our Gooey, fingers crossed, run it.
Look at that.
How sweet is this?
See our search term right there, and this is our search term and our mode.
So the search term is going to be Cameron again, and this time, we're going to go down it.
Look, there's our director.
Oh, I already, I noticed something we did wrong.
This is not going to work so much here, unfortunately.
We need to change these to understand what those are.
So we could either return different values, like if the mode is director, make it D, or we could just put these back at the top.
I'll just change it up here.
This was not, I was just going to search under keyword, which is not what we wanted, alright?
So this and then else it's going to fall through, but let me just fix the comments.
You know, the comments that lie.
There we go, mode equals this.
Alright, try again.
Alright, now let's go and try to find those.
Ready?
Go.
Oh, well I guess you can see what an error looks like.
I think, actually we don't do get.
We just .mode.
It's just dynamic, it's not like a dictionary.
There you go.
One more time.
Go.
Boom.
Look at that.
How cool is this?
That we built this Gooey application right here?
Our program exited successfully, found ten movies.
These are the ones we just saw a little bit before.
We can re-run it and it will run again.
That doesn't mean a whole lot, it just searched the same thing.
Let's go over here and say we're now searching by keyword for capital.
Run it, and you'll see something interesting.
Notice, it put the data down here, kind of on top of it, so there's this kind of funky weird buildup, whereas if you run it again and again, you get like a history.
So this is kind of just like your terminal here, more or less.
But I think it's okay.
I mean, it's not going to win any design awards, but it's definitely better than handing out a command line application to somebody who's really not into command lines.
So, a great way to sort of make your Python application more general.
|
|
|
show
|
4:47 |
So, we've seen that we can run our app, and let's actually run it over here.
We could go to somebody and say, all right here's what you need to do to run our little program.
You have to create the virtual environment and then you have to activate the virtual environment.
They have to pip install the actual requirements.
Once that's all set up, you can Python your program, and whew, it runs, finally.
Okay, so that's not really the way you want to hand out a general application, is it?
You want to say, here, double click this.
It looks just like your Firefox, or your Word, or whatever application people are used to working with.
So, we're going to use a program, or a utility, called PyInstaller.
So, over here, the first thing have to do to use PyInstaller, is install it.
Now, PyInstaller works on all of the platforms, so that's really nice, and the easiest way to run it is to create a file called build.spec.
And if you go to the PyInstaller page, it'll say, here's an example one.
So we're going to do, basically, grab this.
I'm going to grab some text, basically, that I got from there, other than I put in the name, so you can see like right here, Movie Search App is the name.
But it does things like, don't you have the console, make it windowed, things like that.
And the other thing it needs is the Python path, so I'm going to say, which Python, with my virtual environment activated.
So in that case, we're going to use this great long one there, okay.
That should pretty much be it.
Go through, set the name of your application and things like this.
So once this is here, we can come over here, and we can, in our terminal, either one will do, we just say PyInstaller, let's do it over in this bigger one, 'cause you'll see all the stuff that comes out.
So again, the virtual environment is there, this build spec is here, so we'll say PyInstaller ...
So PyInstaller build.spec.
It's done.
It's completed successfully.
How awesome it that?
That took a moment, but let's go see what we have in here now.
Just minimize everything.
And now, in our final search app, we have a build folder, which is kind of a temporary working directory and it will be quicker if you rerun the PyInstaller based for that stuff is there.
But this is what we care about.
Look at this.
This one .app file, put it over here.
Now, what happens if I double click it?
Wait for a second.
And there's our UI.
Let's go search for something.
I'm going to search for "action," and this will be a general keyword.
Boom, there are eight movies, the action in it.
So, Last Action Hero, Looney Tunes: Back in Action, Civil Action, things like that.
How cool is that?
Now, you may notice this little thing back here, this terminal.
That is actually what I would call not cool, so I'm going to close that.
Now, if I go over to my Windows virtual machine, and I run the exact same process.
I pip install, I run the requirements, and then I pip install, PyInstaller, and I run PyInstaller build.spec, I will get a single .exe, and that single exe will run just like we saw.
But it has no command prompt.
It literally runs as just a Windows application.
If I do the same thing on the Linux after I get the funky stuff to install with Aptitude, then I run the PyInstaller, I get this to show the Gooey, no terminal.
For some reason, I think it's a minor bug with PyInstaller that this is shown, even when I'm in the command thing.
We told it not to, but still, the benefit of having a thing I can double click right here, and that Gooey comes up in Python, that is really sublime.
And the fact that this is all bundled up.
I literally just compressed this .app and I send it around.
There's no dependencies.
Even better.
So, I really hope you like this ability create a Gooey and then package it up for reuse, because I think that really broadens the reach of what you can do with Python.
Now, these are not super, super general applications that you've seen.
There are some nice examples.
If we go to the Gooey page and we scroll down here, scroll, scrolling, you see some nice examples, even at the bottom, I think there's some here.
Yeah, you can see tabbed groups, custom groups, sidebar navigation, all kinds of stuff going on here.
But what I want to show you is, if you go to the examples, there's actually a different repository with a bunch of different examples.
Success screen, error screen, flat versus column layout, all that kind of stuff.
So you can go over here and play around with those, just even like a dynamically generated one.
So, you can do a lot, but you can't build entirely general applications.
This is a quick way to turn command line apps into rich Gooey apps, and I think it does it really well.
|
|
|
show
|
1:24 |
Now you've seen how easy it is to create a GUI from a command line application.
Let's go and review the core concepts.
So it all starts with the Gooey library, so we're going to import GooeyParser, to get the, to actually show the UI and get the input, and then Gooey to indicate here's the method that runs, that triggers the Gooey application.
So we got to apply that decorator, the best place I found is right on the main method here, and we can give it things like the name, and the program description, and that actually shows up in the UI, then when we actually want to get the data, we did this is another method but you could just do it straight in line here We're going to configure the parser, create it at a argument, we saw that it can be simple text, or you know all sorts of widgets, that we can put in here and those are cool.
And then to actually show the UI we're going to parser.parsarcs, and then what comes back as Gooey args, we just say .whatever your called the variables .mode, .searchterm is the two that we used, of course you can have arbitrarily many, and you can make up those names, so so just make it consistent, and you're off to the races.
It's standard Python at this point.
You provide feedback for, sort of the rest of your app through just print statements, and those will land in that little text window in Gooey in the Gooey GUI so it's really nice.
Straightforward and simple.
If you just want a quick and simple GUI application, this is what you do!
|
|
|
show
|
1:58 |
Now comes the exciting part, you get to write some code and build a GUI in Python as well.
So here's the demos you've already seen from the videos.
And down here we have the various steps.
So a quick warning for Anaconda users, I've heard some people say that installing wxPython has been causing some compatibility issues with their install of Anaconda, actually I have no idea what they're really referring to, but just consider using a plain old Python 3 environment, or a separate virtual Conda environment.
Okay, today, Day N, we're going to start out and mostly it's just about watching the videos and learning the material you've already done.
So congratulations, you're basically done.
But let's take one little step along with, I guess you would call it code, we're going to create some files that contain code, anyway.
So create a new virtual environment, activate it, this is pretty standard at this point, nothing special here.
You're going to install Gooey and Cookiecutter.
And just go ahead and make a program file, because we're going to put some stuff in there, that's where all the code is going to go, just have one this time.
And just to make sure everything's hanging together, inside your program file, just import Gooey at the top, and maybe also import Cookiecutter and run it, and just see that it exits with code zero, no errors or anything like that.
This step here about pip install gooey and pip install cookiecutter, this is fine on Windows and macOS, but I did run into trouble trying to get that to work on Ubuntu.
So I had to run this set of prerequisites before I could even get it to install and build and so on.
So you want to make sure that you run these steps here if you're on Ubuntu.
This is going to trigger and install wxPython, which is what was causing the trouble, that takes a long time on Ubuntu for some reason.
I mean, like 10 minutes for that to just be on that one line.
But don't give up, eventually you'll get there and then you'll be golden.
|
|
|
show
|
1:03 |
The next day is you're going to actually build your GUI.
So the steps to make this happen are pretty straightforward.
They're just right here.
You're going to have a main method.
You're going to put an @gooey directive decorator on it.
Somewhere near the beginning we'll create a GooeyParser.
You've seen how to add the arguments.
At the end you call parser.parse_args.
Get that back, that'll give you your data.
You should have your UI running, right?
Remember, the goal is going to be to look through the applications that you've built and find one that's kind of fire and forget.
You give it some information and press go do that and it will.
So find an application that you built, that you like along these lines and convert it to a UI version of that same application.
Right, so through these steps here.
Here's an example of one I had that was a sort of project creation thing for Pearman Web Apps and it would take Cookiecutter and the various types of templates and ask you the questions but it does it visually right here so you're going to end up with something like this in the end.
|
|
|
show
|
1:03 |
Day 3, what you're going to do is you're going to package up your app, so you're going to install PyInstaller, and you're going to run this build.spec, so the way to get started with these is to just copy one, so here I've linked to the one that I used for my demos.
You can take this and just change it ever so slightly, so here's where I specify the name, here's where I specify the name of the sort of entry point, the main Python program we're going to run.
I think those are the only two things you need to change, right, so take this, put it there, and then just after you've installed PyInstaller, you're going to run this line a little bit later.
In distribution app name, you should have either an exe or a .app or, you name it.
Right, on Linux, you'll have a Linux binary that you can run.
Zip it up and run it.
I hope you really enjoyed this experience building simple, fire and forget, GUI applications in Python.
When you're done, as usual, share with the world all the fun and joy of what you've had building this thing, and I hope you have a great time and get to it.
|
|
|
|
1:01:31 |
|
|
show
|
3:41 |
Welcome to Day 97.
Michael again here with you and we're going to bring a bunch of things together that we've previously done and what I think is actually a really cool way of pushing and combining what you know.
So we're going to build an online game.
And it's going to be a multiplayer game, not multi-interactive real time game, but multiple players from multiple places log in and play this game online and you get things like high scores, who's won the most games, active players, things like that.
And what's really cool is you basically already know like 80% of what you need to do this.
The final bit we're going to put together here with a little bit of APIs and Flask.
Online games are fun, right?
Here's a cool one, Eve Online.
This is actually powered by Python on the backend in some really, really important ways and it's this MMO, massively multiplayer online game.
And I actually interviewed the guys from Eve over on Talk Python in Episode 52 if you want to learn about that.
That's all pretty interesting.
So we're going to build an online game.
Now, it's not as amazing as this, right?
This is incredibly cool, taking hundreds of people working on it for a really long time.
But let's see what we have and how we can piece it together.
So over here, on Days 13, 14, and 15, we talked about text games.
And the thing we actually built was a Dungeons & Dragons wizard game.
Remember that?
It was a long time ago, I know, but that was one of the first things we built.
It was really fun, we learned about classes and so on.
We also discussed this 15-way Rock Paper Scissors.
And we've come back to this 15-way Rock Paper Scissors several times so we're going to do that again today for the thing we're going to build together.
You don't necessarily have to build that one.
Actually you probably won't build that one yourself but that's the one we're going to build together.
What else do we have?
Well, we saw that we can consume structured APIs with Uplink, recall this?
We actually went to our movie search service and created this Uplink client to communicate with that and we're going to again use Uplink to build the client side, the playing the game side, the user side of this app.
Not the service side but consuming the service side stuff that we build.
So Uplink's coming back, that'll be fun.
On Day 76, Julian told us all about Flask and how simple and easy it is to get started.
We're going to take our Flask knowledge and use Flask as the web framework for hosting our application that is our game server.
It has the various operations that we need to use in order to make our client applications run.
Finally and really, really importantly, we have databases.
In order to scale out our server, make it survive reboots and all sorts of stuff, we need to save our data and have data integrity across the various requests and executions of our web server.
So we're going to use SQLAlchemy.
In fact we're going to use already the exact same model that we already added here.
So over in our demo recall we built our persistent Rock Paper Scissors.
So we're going to take our persistent Rock Paper Scissors and convert it to a server side version and use the database to keep that information going back and forth and then we're going to write a little client to use it, that way everybody plays on the same server, we have all the shared data about who's played what, what were the history high scores, things like that.
I hope you see that we have all the pieces with the exception of building just the API methods which turn out to be pretty simple in Flask if you're not trying to do too much.
It's going to be an ambitious 3 days but we can do it and it's going to be super rewarding.
So let's get started.
|
|
|
show
|
2:45 |
Now before we write some code and we're going to do some pretty interesting things, I think, in terms of organization and the way we put this all together but let's just think at a really high level, what operations does our website need to support?
So we'll talk about how to build these.
But let's just sit back and think about, if you can remember back to our 15-way persistent Rock Paper Scissors, pretty recent, we had a couple of things that were happening in that game.
Here's what I think we're going to need to do in order to move all the logic and persistence to the server and still let the client communicate with it.
So first of all, you're going to need to be able to register a user or get an existing user and I broke those apart you know, with a website, it just kind of seemed like you should either kind of login or register as two separate things.
You can put them separate or if you want to, you can combine them back like we had get or create user.
We want to start a new game, now this is really important because what we're going to do is we're going to create basically an id for the game and all subsequent operations will exchange that game id as part of who they are and how they're interacting so if you ask for, show me the history, who won, play a round, you're going to pass around this id that we get by starting a new game, we will show the rolls and let the user pick the rolls from an existing list.
Now we could just hard code the 15 rolls into the client but what if we want to someday upgrade it?
Maybe around St.
Paddy's Day, you could throw a leprechaun and you want to make that a feature of the game, you want to add it, it just automatically have everybody pick those up or you want to convert it to 25-way Rock Paper Scissors or something along those lines.
So we're going to get the rolls from the server so that we're always consistent with what the server expects.
We can ask, what is the game status?
Most importantly, is it over and who won and things like that but this will kind of give us the history and the status of whether it's over and so on and finally one of the critical parts is actually playing a round.
I want to roll the devil and see what happens, right.
We'll have a computer player on the other side and they'll randomly choose something and you'll see if they win, whether you win and so on.
But this is sort of the playing of the game and we'll just play the rounds until we find out that the game is over.
And finally, one of the fun things we had in the original game, the persistent one, was when it started it showed that the players with the top scores.
Of course, those were just the players on your machine that you happened to have played previously.
We're going to add a top scores operation so basically you get the global top scores and you can be ranked in the top ten, in the entire world in 15way Rock Paper Scissors demo app, wouldn't that be cool?
So you'll be able to see that here, as it comes along.
So these are the operations we're going to build in Flask.
|
|
|
show
|
3:06 |
Alright, so let's get our project ready and everything set up here.
So I'm over here in the GitHub repository and Day 97 to 99 in the demo app.
So, what I want to do is just create a virtual environment and then we'll do the rest from within PyCharm.
Okay, so we can just open this folder on Windows you would type "start." on Mac you type "open".
So here we have our empty app and we've done this many, many times throughout this course but this time is different.
We want to actually have two separate applications contained within this project.
Let's go and create a folder for the client and let's create a folder for the web.
Alright, so there's our client, there's our web, each one of these is going to have it's own set of requirements, so let's go ahead and add those.
Okay, this is a pretty good start.
So we have our set of requirements for a client and we have the set of requirements for the web.
And notice we have our virtual environment active here and if we ask what is installed, there's nothing, of course.
So we're going to entirely focus on the beginning.
Just on the web application, okay?
So we're going to close up this client here but before we do there's one really quick thing we should do.
When we have files over here, we kind of want to treat this as the whole project, right?
You might have a api.py and a program.py and the program might import api.
In order for that to work easily in PyCharm is what we need to mark this directory as the source's root, say this is kind of its own little area.
Same thing for web.
It's effectively adding that thing to the Python path and making that the working directory and things like that.
Okay, so, this is just the basic stuff that we've got going on here.
Alright, that's the web one.
We're going to tell the web one that we require Flask and SQLAlchemy.
Those are the things that we're going to need.
So, we'll go over here to web.
pip install -r requirements.txt install everything in that file.
And last thing, let's go ahead and add an app.py this is pretty standard in Flask and we'll just print Flask coming soon.
And let's go ahead and run this.
Yay, Flask is coming soon.
Let's get this run configuration set up for a few good things here.
So we'll go over here and say this is going to be the web app.
And we also want to have it restart because the web apps open a port, this one will be port 5000 and if you try to run a second one without closing this one it'll crash, so this will tell PyCharm obviously to do that correctly.
Alright, well, I think our structure is in place.
|
|
|
show
|
2:04 |
Alright, so this Flask is coming soon.
Flask is coming now, let's do it.
So we're going to import flask, and down here, remember, you have to create the Flask app.
And I'm going to use it like this, so we always see the full namespace of flask, just so it's really clear what's going on here.
And let's just build, like, a hello world, or welcome to our site, little view method here.
So let's call this index.
And you have to add the app.route decorator and in here we're just going to put forward slash.
So that's going to tell it what to do, and then we'll just say return hello world.
And just for good measure, just so we can keep track of this in the future, 'cause we're going to run into issues, let's add a not found 404 handler, and we'll just return the page was not found.
So that's great.
And then let's go down here and we'll actually have a main method, let's put that right at the top.
That's my style.
So we'll say app.run like so.
And let's even say debug=True.
That's going to be really nice for us, we'll see why in a bit.
And then we'll say down here, we'll do our little main convention, that is in Python, and we'll run the main method if that's the case.
Whew, okay, is it ready to run?
Let's run our web app and see.
Whoa, success.
We have something here.
Click on it.
Hello world, awesome, how about that.
What if we go to abc?
Page was not found.
Okay, so it looks like both the regular index and the not found stuff is working really well.
So this is cool, and just so you know, what this debug=True is it'll watch these files and see if you make a change and automatically reload it.
So let's go to hello world, three exclamation marks.
Go over here, if I refresh.
Automatically, I didn't have to do anything.
Because down here, you can see it detected a change in that file.
Restarting, debugger is active.
Beautiful.
Okay, so, this is all really good, we got our Flask up and running.
But this doesn't feel very much like a JSON API method, does it?
|
|
|
show
|
2:58 |
Alright so, this simple little bit of code is a pretty decent Flask application running in debug mode.
What's going to be important for us is not to return HTML, not really HTML, just text, but not really is it to return text and HTML for the browsers, but is instead to return JSON to communicate.
Remember, several times throughout this course, we've interacted with JSON APIs, we had the Movie Search app, we had searching talk Python.fm, we've worked with GitHub, we've worked with other things, and all that was consuming JSON APIs.
Now we need to build one.
So how does that work?
Turns out to be not too hard here.
So let's come over here and this will just be api/test.
And you got to make sure that you name this, let's just call this test api_test.
Like that.
Now if we call this, it's just going to return Hello world.
Or Hello Apytest.
Let's just see that that actually is working.
And we're going to use Postman over here.
So, if we go and just get a request, straight like that, we can look at the headers.
The content type is HTML and it's a 200.
What if we go to api/test?
Look we got a 200 again.
That's really cool.
Right now we're getting HTML and the body is just this.
So we have the routing working, and notice it automatically detected that change, that's super cool.
But, what we want to do is instead let's suppose we have some data.
So this'll be name is Michael.
Day, it's going to be 97.
What if we want to return this, like we could've gotten that from our database, for example, but we want to return this as JSON.
Super easy.
So we're going to return flask.jsonify(data).
Let's try that.
Now if we do a get.
Boom.
There's our raw JSON coming back and the type is application JSON.
So that's all it takes really to build these APIs.
Is we put in a route and then we have some data and we jsonify it.
The other aspect that we're going to need to work with is how do we work with whether this a HTTP GET or POST or PUT.
Because when you're working with the APIs remember, creational type things are done with POST and PUT.
Read only stuff is done with GET, and so on.
So you'll see, we can go over here and say method=GET, or POST, or PUT, or both.
We could actually handle GET and POST.
Like that.
This one's only going to be for GET.
Okay, so these are the building blocks that we need to build the seven operations that we've talked about.
The other stuff that we're going to need is the actual data, and the game play, and so on.
And we've already written that and we're just going to move that in, and copy some code over, and adapt it.
Because we've already spent a lot of time working with that code.
And then we're going to adapt it to methods just like this.
|
|
|
show
|
1:47 |
All right, it's time to move some existing code and data over here, just from our previous persistent Rock Paper Scissors.
Remember, one of the things that we used in the 15-way Rock Paper Scissors was we needed this CSV file to basically determine who wins and who loses for any combination of those 15-way battles.
Let's paste that over here.
We're going to have our CSV file that tells us that, and we'll also have this DB folder thing, we already saw that.
This just tells us easy way to get back to this location base and generate either read or writable files here.
We're going to put our SQLAlchemy data in there as well.
That has to do with reading the data in the games.
The other thing we had was lots of stuff around SQLAlchemy defining the models and saving and querying who played a game, does the player exist, all of that stuff.
We're just going to take that and drop it in here.
We're not really going to change that hardly at all.
But I'm going to make this folder called game_logic, and you can see we have our SQLAlchemy declarative base.
We have our move.
This literally is the same thing as before.
It's not changed at all.
We have our game decider, our GameService.
These are all basically the same.
I had to add just a couple of methods to GameService, but they're super trivial, like find a roll by id, and things like that.
Nothing important or new here, other than this only change really is that this game, it used to have all the loop logic and all that stuff, and now we need to really separate that.
That's going to go down into the client, but there's still a little bit of work that our game class is going to do.
We'll have this over here.
There we've moved in the code from our game previously.
Now our job is to integrate it into our web application.
|
|
|
show
|
4:24 |
When you saw me get started with Flask here, and I created a main method, and the main method we call run.
And then down here where if the, the main convention where I call main, you might have thought, "Well, why don't you just run down there?
Come on.
Like, what are you doing?" It turns out that in real web applications, there's tons of startup and configuration code.
Configuring the logger, configuring the database connections, etc., etc.
So I did this with that fact in mind.
So one of the things that we're going to need to do is we actually need to make sure that the starter data that they application is going to use exists.
All the rules have have been created in the database.
There's always going to need to be a computer, sort of opponent user, like a built-in user.
We are going to create that as just a standard user in the database with a special lookup and things like that.
So let's go over here, and maybe we can make this more obvious.
We can say...
"Run web app," and we can take this and put that down there.
And up here, we'll say, "Run web app" as the last thing, but let's call another one, let's say, "Build starter data." And we'll define Builder Starter Data.
Well, what goes in here?
Well, we can go to our game decider.
Go up here and say, "from game_logic import game_decider" We're also going to need GameService later in just a second.
So we'll come down here and say, game_decider.all_rollnames." We can just print out roll names, just to see what's coming along really quick here.
And let's just throw a quick return so the app doesn't actually start.
Here you can see we are getting all the roll names.
That's really cool.
So it looks like that's working.
And then the GameService, this is the thing that talks to the database.
It has an init rolls, and if you give it the roll names, it will make sure that all these are created in the database, have ID's and things like that.
If they're already existing, this is just going to bail out of that.
The other thing has to do with that computer users.
So let's come over here and say, Computer = GameService() Find player by computer." And if the computer already exists, that's great.
But if it doesn't, we're going to create this one.
We'll create the player called computer.
Okay, so we want to make sure this happens every single time.
Now, it's kind of silly because, really, it only has to happen once, and then the database is initialized.
But have this here to make any changes, make any additions to, will be really, really nice.
So, before we run our web app, we're going to make sure that the starter date, or like the rolls, and the computer player, and so on, are all there.
Let's go ahead and run this and see how it works.
Run it and nothing happens.
Well, not nothing.
It built the starter data and then I, sure, sure I could do this right here, right?
So if we run it now, it should be running the web app.
But let's look in here.
Woo, look what we got over here.
We have our Rock Paper Scissors SQLite database.
Let's put over into here and see what we got.
There are all the rolls.
Created that time: rock, gun, lightning, devil, and so on.
If we run it again and again, we're never going to have more than 15 rolls.
The other thing that we might want to look at is from players.
And now we just have our computer that we created, as well.
So we have our starter data.
Now our system is just going to check.
Like this init_rolls, if we go to there, you'll see.
It says, "Look, if we have some here, let's just get out." Right?
Similarly, we check to see if the player already exists, and if they do, we're just not going to do anything.
But if they don't exist, we're going to create them the one time.
All right, so now we have our models imported.
And remember, this is effectively just what we did in the previous demo.
There's nothing changed here.
We just dropped it in here and called a couple of functions in the beginning of our web app before we let it run every time it starts up, to make sure out database is all set up.
|
|
|
show
|
4:55 |
Now, we're going to do something that makes my skin crawl a little bit.
We're going to write a ton of code into this one, ginormous, what's going to become a ginormous single file web app, yuk.
Afterwards, I'll refactor it in a way that I think is much cleaner and simpler.
If you don't like the refactored one I do, you can just stop with what we're going to do this time around and leave it organized this way.
I think you'll find it to be a lot nicer.
Okay, so what is the goal of this particular video?
We're going to go in here, and we're going to define 7 API methods, the 7 that we talked about at the beginning, and recall down here, we saw how to do this.
We have some kind of route, some kind of HTTP verb.
These are very important in RESTful services.
We get the data; this, we're going to get from the database in the end.
And, we're going to return just the JSON response of that dictionary.
So, just to keep things movin' along, I'm going to go down here, and I'm going to, let's put these at the very bottom.
I'm going to paste in some stuff, and we'll talk about it.
These are not implementations.
These are just getting started.
So, the first one is going to be: find a particular user.
So, we want to have api/game/users.
And then, you'll put the name here.
So, api/game/users/{name}, /computer /jeff or /jennifer.
You say, whatever you want, there at the end, and that becomes this argument, right here.
So, let's just do something like: return would find, just to make sure everything's working.
We'll see.
So, we still got to put the details of what that means.
It turns out this one's quite simple.
Some are really easy, some, not so much.
So, what is the next one?
So, down here, we're going to create a user.
And, we're going to do an HTTP PUT to the user's collection.
Why?
Well, there's only two reasonable options, here.
GET, get is out.
Delete is obviously out.
PATCH, obviously, they're out.
But, POST or PUT, and if you think you can do the operation again and again and it shouldn't affect the state of the system, well then, PUT is probably what you want to do if you know where it goes.
So, it's kind of, we're creating the /user, whatever we paste in here.
So, this is going to create a user, and it's going to be interesting.
I'll just say, we'd create_user.
It's going to be interesting how we get to that data, and that's not too hard.
Next, we're going to create a new game.
So, over here, we have game.
And then, you're going to just do a POST to game.
You don't know where the ID or the link of that game is going to go.
So, we're using POST as opposed to here, we know the name of the user we're creating, which drives the URL.
That's the reason PUT.
You don't have to be this nuanced with the rest, but this is the way I'm doin' it.
Next one up, we're just going to be able to get all the rules.
Remember, we want to be able to change the rules, potentially, in the server and have all the clients immediately adapt.
And, this is a read operation, so we're going to do a GET, very, very straightforward.
We'll implement that momentarily.
Next step, we want to get the game status.
This is a read operation, so it's GET.
We have api/game, and then here, in this part, we're going to do the game ID.
So, API/gameS223/status.
And, that's going to be passed in here, and then we'll just say, almost there, with our methods.
So, the next thing we want to do is just get the top scores.
Again, this is a read operation.
So, we'll just return.
And finally, comes our most complicated but also most important method.
Those often go together, don't they?
Called play_round.
And, because this is modifying, it's doing a POST.
That's not where it goes, so this one is, it's ready to POST.
Okay, so we have all of these methods, here, if I can get my little green helper thing to get out of the way.
You notice that somewhere along the way, it was detecting changes, and it said, "A view mapping over ID.
"Existing end point: find_user." That just happened 'cause I duplicated something before I typed it in.
That happens, sometimes, when Flask gets into bug mode, is you can be messin' with it, and if you put, like, junk and you accidentally save it, it tries to reload.
But then, it detects some kind of error, and if I actually take that away and save again, it's, the process is gone, got to restart it.
Okay, so let's just test one of these: would find user jeff.
How cool, huh?
And, it's workin' pretty well.
This works pretty well because this is a get operation, but how do you test this users by doing a PUT operation in the browser?
Now, it's super easy.
So, we're going to employ Postman to configure all this stuff for us.
|
|
|
show
|
1:36 |
Alright, we have the stubs for our APIs in place.
And we're going to start focusing on some of these that are easy.
For example, this all_rolls, this one is really easy.
top_scores, somewhat easy.
play_round, we're going to save that one for later.
But I've already sort of configured Postman to deal with this.
So Postman is cool because you can create these groups, like here I have Online RPS, and here are all the operations, and you can see GET, PUT, POST, POST, GET, GET, GET.
So if I go get_user, we have api/game/users/mark, and you can see down here would find user Mark.
Come over here and say create_user, the body's already set, here's the user that didn't exist yet.
But if we do this, response is would create user 200 okay.
So what we're going to do is we're going to go through and work on these.
Let's start with all_rolls.
Right now we're getting would create all_rolls.
I think we're going to start knocking out some of these simple ones, game_status, all_rolls, new game, create user, these types of things.
And then the play_round and the top_scores those are a little bit trickier.
But you'll see that we can configure these in Postman like for example, this play_round is going to pass the body, here's the game id, here's the user, here's the roll, alright, so we're going to want to make sure we have a user, we could create a user over here, want to make sure we have, Michael for example, so that other one would work.
Things like that.
So we're going to use Postman to exercise and get our API just right, and then, then we're going to go write the client side code that consumes it.
|
|
|
show
|
1:25 |
It is cool that we have all of our API endpoints doing JSON-ie stuff, but, well not quite yet, almost, but they are sort of set up for RESTful interactions.
But they don't return any real data, do they?
So, this one's pretty easy.
Let's work on this.
So what we're supposed to return here is a list of names that then the client can use to show to the player, and say which one do you want to play.
We could return rich objects, but really just the names are enough.
So we're going to use a list comprehension to take the database objects which have all sorts of stuff, don't go in JSON very well, and just convert those to just the particular names.
So we'll have r.name for r in game_service.all_rolls.
And then down here remember, we say flask.jsonify(rolls).
All right, it's still running down here, see the dot?
So it should've restarted, let's give this all rolls here a shot.
Remember we've said this before, what'd give you all the rolls?
There we go, make that an easier read.
Boom, look at that.
So we got this back, here's our JSON.
We look at the headers we got out of JSON, that's it, we've implemented it.
Let's review.
We got a list of names, we returned Flask JSON, we listed to the right URL, and the right HTTP verb, done.
All right, well, that was easy, let's see another one that's easy.
|
|
|
show
|
1:24 |
How's our create game operation working, here we're going to do a post of this.
This says we would create a new game.
If you think about how the way that our data base actually works, there's not actually a lot of integrity around this game concept and we maybe could create some more models and put them in there but one of my goals of this is to change as little as possible about the models and data access layer and the other stuff we've already done and just to adapt it to online.
Not exactly possible but it is very, very close.
What we really need to do here is to just create a unique id that can be shared.
Okay?
And it turns out we can do that super easily.
So we're going to create a dictionary.
In our dictionary we're going to have a game id and how do we get it it?
It's going to be a UUID, which is a standard library thing we got to import at the top and there's UUID4, which is a great random thing we could use but we're just going to create a string representation of it and give that back.
Let's save this, it should reload if everything worked out.
Instead of saying "would create a game" what do we get?
Boom.
There is a very unique looking game id that we can then use for all subsequent requests to correlate or relate the various operations between say playing around, getting the game status, things like that.
So that's it.
Create a game, just create a random identifier that we can use that is pretty unique.
|
|
|
show
|
2:58 |
Now let's turn our attention to finding a user.
This is pretty straightforward, but it does introduce an entirely new concept.
I could ask for a user that doesn't exist, right?
Over here, we can go to our get_user, and Mark, I don't think Mark exists in the database, it just says, hey, we would find him.
I'm sure that Mark doesn't exist.
Eh, it still thinks it would find him.
And the status code is 200 OK.
So what we need to do is say, yes, this user was found and here's their details, or no, the user was not found, and here's what happened.
So it's really easy to do this with the code we've already written and encapsulated in our service.
Alright, so, there's our user.
And if it wasn't null, we could return it.
Be super easy.
Let's go ahead and write that code really quick.
Now, to all these database entities that need to be returned, if I just try to return Player, let's try to make this work here.
We know Computer exists, let's try to get them.
What happens?
Boom.
Player is not JSON serializable.
Failure.
What we have to put here is not a random object out of the database, but a dictionary.
I've added this to_json method for every one of these.
The one that's most interesting is this, this move here, so you can see this to_json, that is going to create this dictionary to be sent back, right, and it's kind of encapsulated here with this class, which I think is pretty cool.
So what we got to go over here and say to_json now, we do that, boom, there's our computer, ID is 1.
What about Michael, does he exist?
None type has no attribute to JSON.
No, there is no Michael, so what we need to do instead of let it crash, is we need to say, sorry, that user wasn't found.
So we'll say if not player, and we can just say this, abort, sorry flask.abort(404), Not Found Alright, now let's try it for one that doesn't exist.
Okay, the page was not found, 404, that's fine.
Maybe we could give a better message about the user, but notice this is a little bit off.
What we need to do is actually return a response and set the status to be 404 in our little not found handler.
Alright, there we go, 404 not found.
That's what our client can use to say no no no, that didn't work.
We could put a little JSON message in here if we want, but it doesn't really matter for what we're doing.
Okay, go back to working one.
Here we go.
Okay, so our get user is implemented, and the interesting thing that we learned here is this response message, a flask.abort(404) which really redirects over to this not found handler, and does whatever it's going to do.
So this is really important when people are trying to interact with things that don't exist.
|
|
|
show
|
4:06 |
We were getting to a pretty interesting one here.
Let's look at our create_user request that we expect to send.
We're going to send over a PUT, in JSON form, who's body is this JSON object.
Now it's pretty simple here, but it could be way more interesting.
The moves, or powers, could be a list of power one, you know, jumping, running, whatever, hunting.
All right, we're not actually doing that.
But we could send a rich document over, it just happens to be pretty straight forward.
Want to do a PUT to that URL.
So how do we deal with this, how do we get that data?
We saw, over here this really cool way of doing this little thing in the URL, and it would come out there, but we don't have that here, so what do we do?
Let's do a try/except, thing, just for a second.
So let's do a little work in here, because there's certain things that can go wrong.
So what we can do to get to this body, is we can flask.request.json.
But it might not be there if, there was some sort of invalid input.
So we got to test.
We'll say if, so, if it's not there, or they didn't supply the user field, or they supplied it but it was null, or somehow otherwise empty, any of those cases, this is a problem, so we'll raise an exception.
Then it will just kick us right down here.
Okay, so this is our error handling.
Here we go, so let's do that, this is going to be our username, and now, what do you do with that?
So let's say player = game_service.create_player, and it takes a name.
What happens if that already exists?
It's going to raise an exception that the player already exists, which is another case that's going to kick us down here.
But if we made it through all these levels of tests here, we'll say return, Whew, okay, so test for this, make sure we get this.
This is going to do a little bit more testing in here, and then we'll just send this back.
However, if there's a problem, we can do this.
Instead of kicking it over to our handler, we can be very specific and say we want a flask response, and the response is going to be, and the status we'll set to be 400, which is typically bad request, like these are all bad requests.
This, it could be some other reason that causes it, but let's blame it on the client this time, how's that?
All right, you want to try to create the user Michael?
Let's, before we do that, let's try to get the user Michael and just see that they do not exist.
Page was not found, page maybe that's the wrong word, but entity not found.
So just create the user Michael.
We got this richer object back, which gave us the name again.
But also when it was created, the id, everything out of the database, and now if we go and we say look for Michael, hey there it is.
We can run that as many times as we want.
'Course if we try to recreate him again, boom invalid request, player already exists, 400.
So literally if we go over here and we change the body, don't pass the user field, invalid request, no value for user.
So all of our error handling is really rocking, rocking on.
All right, let's create one more.
We'll create a Mark.
Boom, now Mark exists as well.
That's it, so we're going to come in, we're going to try/except, just 'cause there's a lot of conditions here.
Work with flask.request.json.
If it's invalid it can be parsed it would just be none, otherwise we're going to check the values within it, and then we're just going to do the logic, and return the newly created player back to the user.
|
|
|
show
|
2:37 |
Next up, let's implement game status.
So, if we're in Postman, we can pull this up, check.
I would get the details for this game that actually doesn't even exist.
Okay, so we have a little bit of work to do.
Now, on a couple of these going forward, I'm going to take some code and just put it in here.
I'm not against typing it out as you guys can probably tell, I'd love to do that for you.
But there's times when it's just not really worth you watching me write these details, 'cause we really already computed this, but we need to change the way which we're computing it because we can't store the state between rounds in a particular game like we did before.
So we got to go back to the database and compute it.
It's kind of clumsy.
If we change our data model, we could do this much more simply, but remember one of my goals is to actually not change the data model, 'cause I think that's adding too much.
This is going to be a little bit less pretty, but let's have a look.
And when we ask for the game status, we want to give several pieces of information.
Is the game over, what moves were there?
What players were involved in the game?
And, who won the game if the game is over?
So, here, we're grabbing, up here we have the history, these are all the moves played.
We have, is the game over?
These are all things that we've wrote before.
We need to quickly, give it an id, find a roll and find a player so that we can use the names and stuff in some of these methods down here, like this to_json.
So, we've built to sort of look up that we can just quickly pass id instead of going back and back and back to the database, we can just store those here.
This works for a small number of players, for hundreds or thousands, but not millions.
Alright, we'd change the way this is written if that were the case.
Find the player, count how many times they've won, because that actually helps us, I don't need this anymore.
That actually helps us know whether the game is over, things like that.
Okay, so let's go and run this.
It shouldn't be super-interesting, because there's going to be no game, it might even crash, index out of range, yes.
Yeah, I thought so, so there's no history here.
So let's say we need to do our little 404 thing.
We'll say this level, I'm going to just say abort 404, flask.abort(404), and that should throw an exception and stop it right away.
Let's try that again.
Ooh, page not found.
So we don't have any games created 'cause we have to be able to play a game, but I think it's going to work.
We'll come back to this and test it again.
|
|
|
show
|
1:31 |
All right, let's do the top scores.
Over here in Postman we get, these are the top scores as HTML, not what we want.
So let's write these.
Go ahead and put a little bit of code here like before We're going to go get all the players and we're going to compute the wins.
We're going to store the player as JSON and the score as the number of wins for that player.
So this is a list of dictionaries that contains two things, the player and the score.
And there's no particular order to this, but because it contains the score, what we can do is simply go down here and say we're going to sort, give it the function that's going to say, go get the score for each one and sort in reverse order with that negative there.
Okay?
So now we want a return flask.jsonify.
Do you want to return all of them?
What if there's 100,000 players?
Not a great idea, so let's just return the top 10, and we can use a slice.
So it'll construct here, if we haven't talked about it previously we'll say, given a large array, return either the whole array or just the first 10 if it's larger than 10.
Now this is not going to return anything too amazing yet.
It's given our two players, but they both have score, actually our three players, we all have the score 0, 0, and 0.
But at least you can kind of see that it's working and then what do you think, you can't say the sort's wrong, because it is sorting, but as we start playing, you'll see the highest winning players appearing at the top here, of course.
|
|
|
show
|
4:14 |
Alright, we are down to the big method, this play_round.
It turns out this one is fairly complicated, but its important right?
This is the way that you play a round in the game.
Okay I'm going to put some code here.
Its not going to be quite complete at first.
So, here we're going to get this thing called Game Round.
I've updated this Game Class, to have this game filed.
To have this Game Round, and it basically stores all the information about who rolled what, whether that roll is winning, or losing, and who won that Round, and things like that.
It'll record it in the database, and I'm not really going to go into it because it's exactly the same logic as we had before but its just kind of rewritten.
Okay, so we're going to use that here.
And we also have to do some validation.
Remember, up here, in our create_user.
We have ff not flask.json give the user and someone...
Turns out this is way more complicated.
So let me write one more method that will do this.
We'll just put that at the bottom here.
Look at all this validation.
Okay, so, we're going to come in and validate that we have a JSON body.
That the game id was passed.
That the user was passed.
That if we try to get the user from the database the user exists That a rule was passed.
That if we try to get the rule from the database by name, the rule exists.
The game is not already over, etc...
We could just validate that and then re-ask those questions above, but when you're doing web maps and you're doing these data access things, if you already have a hold of the roll and the user, just give them back.
What we're going to do is we're going to get those three pieces as valid data or we'll have an exception and we'll just return a response again, saying what went wrong.
And then we're going to jsonify the roll, the computer roll, the player, the opponent, outcome, all the stuff we need to basically keep track of the client and at least report to the client what happened there.
Looks like that reload worked so let's go and see if we can Play roll.
Lets verify that we have Michael.
Michael is there so Michael can play a game.
Lets go here and we can create another new game.
Turns out that it doesn't matter what we actually use there.
Let's look at the body.
We're going to pass in.
Some game id.
Doesn't have to exist it turns out.
Michael, and a Roll.
And let's see what we get.
Whoa, it worked, look at that.
We got a 200, response is JSON, very good.
So, what did we get down here.
Computer rolled water.
Is it the Final Round?
No.
The opponent is the computer.
It's kind of not the best name, is it?
But the opponent is the computer, the player is Michael.
We have our IDs.
Michael rolled rock.
Computer rolled water.
This is the First Round and the outcome is, The Player loses.
Ugh, well, I'm not rolling rock anymore.
I'm going to roll human.
Let's try again.
This time, they rolled scissors, I rolled human, and I win.
Awesome.
2 for 2.
Let me just roll human a bunch of times.
And one of these times, its going to be the Final Round.
Final Round is True, so if we go over here and ask for the status of this game, now we can see if this thing actually works.
Oh, look, oh no, not quite the same.
Let's do that.
Boom, look at that, here's our status.
It's over, the moves are, you know, Michael played rock, Computer played water, Michael played human, Computer played scissors, and then Michael just went human on it all the way the end.
Computer lost by trying to throw the sponge at us.
Okay.
Here's the players that were participating, and the winner of this whole outcome is Michael.
How awesome is that?
And let's just do one more thing.
Let's do our error handling here.
Check our error handling.
What happens if we try to play a Round that's finished?
Remember there was an exception?
Boom, Invalid Request.
The game is already over, 400 bad requests.
Maybe it should be Invalid Operation?
I don't know.
There's probably something better than bad requests.
But 404 is not it so we're going to go with 400 just for the sake of time.
That probably felt like a lot, but the entire server is written That's it, we're done.
We have play_round, top_scores, game_status, all_rolls, now it's just a matter of literally going and writing the client that's going to consume it.
And that turns out to be quite easy.
|
|
|
show
|
4:17 |
You may be just fine having your entire website crammed into a single file, I'm not.
It really drives me crazy to have everything jammed in here.
And this is a super simple web app, I got to tell you, this was in the training website, for example, this would be many thousands of lines of code here.
And it's just not great.
We can do so much better.
So, let's create two files here, one that holds just the API stuff, and one that holds just the web view, and then we're going to leave the sort of start up stuff in app.
Now, you don't have to do this.
If you don't want to do this, it's fine.
But I'll show you how to do it.
So, I'm going to go over here and create a directory called views and something called a game_api and also be home views, just called home.
So what we're going to do, try and come up here to the top, and we're going to say, from views import game_api and home And what we need to do, is we need to basically provide it this object, and then use that object to define methods like this.
It's going to look a little bit funky.
It's probably not obvious, but this is what I like to do.
So, I'm going to say game_api.build_views Now, notice this does not exist, PyCharm says "Cannot find a Reference", but if I hit Alt Enter, it will create that function, okay?
And then when I'm going to do is I'm going to go down here to all skip, skip, skip here, from this bit down.
And just cut those and put them right here, indent it.
Indent it.
So when we call the function the buildviews function we do these things.
I'm probably going to go through and make sure some of this stuff is imported, like import flask.
Whew, okay.
So I had to go through and import all the stuff, or rather, let PyCharm import the stuff that is needed here, but let's go back to our app.
Do a little cleanup, and notice this is looking better.
We don't need this.
Actually, we need that one in just a second.
But these things we don't need, this is looking a little cleaner.
So let's do exactly the same thing, but for home.
And what's going in there, well, let's give it this index Apytest travel delete.
And this.
Now again, we got to import flask at the top.
We have our index and we have our not found.
Whew, now if you look at this page, if you look at this app file, what does it do?
It'll just start update it runs the app.
we should probably make this method like so like build_views.
Because again, this is simple now, later this is going to be not so simple.
Is it still running?
Let's see.
It is.
Does it still work?
play around is not going to work.
But we can get Tom's scores now.
It works, awesome.
And let's see then, 4, 4.
This works, and if we just go here, test our other API stuff, hello world.
Awesome.
So we've cleaned up our code, in my opinion, dramatically.
You know exactly where to go to work with the main home page webviews.
Here's the API just for the game.
Here's your startup code, how you config your app.
To me, this just is like, ah, so much better, so much cleaner.
If it's not that way for you, then, you know, put it some other way.
Right?
But this is a pattern that I like to use.
|
|
|
show
|
2:36 |
Okay, let's come over here and close the story on the web and go to our client.
And we're going to use Uplink, so we're going to put that in our requirements on txt and let's add a game app, call it game_app.
That's the thing that you're going to play.
And let's separate our API definition from our UI, which is kind of this.
So let's do a quick main.
Do a little bit of skeleton code here, get that running.
Okay, this is our little game_app.
Let's add another one called api.
And this over here is where we're going to use Uplink.
So we're going to import uplink and we have not installed those have we?
So let's go over here to client and run the same code.
There PyCharm is less unhappy, let's say.
So what we're going to do is we're going to define a class over here using Uplink and remember the way it goes, this is going to be a GameService and the way it works is it's going to be uplink.consumer and then we just define methods.
Like def find_user.
We put in the user name and then down here we just have nothing but we put in this at uplink.get and then it's something like API game users username.
Now they use curly braces which I prefer over here, where as Flask uses angle brackets but whatever it's all the same.
The other little trick that we'll have to do here is to define an init and set the base URL to wherever it is.
Something like 5000.
Let's add another one here.
This time for all rolls, remember that's doing a get against api/games/rolls.
It gets more interesting, code word for complicated.
If we're going to do a create game, we're going to do a post up to API games game games and we're going to pass a body of just a dictionary as a body.
But let's just go over here and let's just see if we can get this all rolls thing to work for a second.
You've got to import that and we'll just say all_rolls.
Now remember what we get back here is we're going to get a response.
It's going to be okay but not amazing.
200 response, 200 that's already good right?
And if that's true we could do a JSON here like this and we get boom, look at that.
It's already working, that is so super cool.
|
|
|
show
|
1:25 |
So we're over here, and we're calling service all_rolls, and then we have to, remember you have to basically say, service.all_rolls.
Store that," and another thing you have to say, raise_for_status and then call JSON if that worked.
So that was really cumbersome.
So we created this thing called The uplink_helpers, which had this basically uplink response handler raise_for_status.
So if we go over here to our game, oh sorry, api, excuse me, and we say this, then it won't let any code through that fails.
So we know that it's safe to say .json right here, 'cause it's already tested it.
We can do better though.
We make it all of these methods return the dot.
JSON will response a result by adding one other thing.
This response to data.
So given a response, we just call response.json.
Otherwise, they throw a format error.
If we also put this at the top, on the outside, not the inside.
The outside; That's important.
And this one goes on the inside.
Then we can come down here, and just print this.
And we should be our little devil, all the various pieces.
We do.
Very nice.
So I feel like our game service is in place, and that really makes working with it nice and easy.
|
|
|
show
|
0:45 |
You saw how easy these are to add.
Let me just drop in the other however many more, five methods or whatever it is.
So we've got play_round, which has the body.
We've got top_scores.
We've got game_status, and so on.
That rounds out our little game service.
And we'll come over here, we'll create one of these.
Create the top of our main method, actually, let's do that.
And then we can call things like all_rolls or Top Scores, and see what we get.
There's all_rolls, these are the top scores.
Michael apparently has scored one, which beats, I guess everything else was score zero.
Yeah, it looks like it.
Okay, so, really, really cool!
This lets us interact with this service.
Now let's add in the logic.
|
|
|
show
|
3:09 |
You saw us write the game, interaction of the game loop previously.
We've consumed a bunch of API's with Uplink already.
So let me just drop in some code here that is going to be basically, the same thing but using the service, just for the sake of time.
So what do we got?
We're going to print out the top scores, and we're going to call top_scores and then we'll loop over them, and remember everything that comes back is a dictionary so we've got to get the values and then this is a nested dictionary, so we've got to get the name from the player that we got, and so on.
So we're going to print out the top scores, we're going to create a new game that's going to return that dictionary which we're going to get the game id.
We could do some work to make this much easier to consume, but just keep it focused on more the server side.
Kind of just roll with what we got.
Give us all the rolls, get us the player list.
Suppose we want to be the player Charles.
And then we're just going to say while the game is not over, we're just going to go through and play a round, pass the game id, the user being Charles, and the roll which we're randomly choosing from the various options we got from the server.
Right up there.
Okay, so we're just going to go run and do that, and when it's over we're going to get the game status, and print the outcome which the game status has the winner.
Oh, okay, so let's run this.
By the way, it doesn't ask us what we want to do.
It just randomly chooses rolls for Charles, and makes him play those.
But it could just as well, this could be an input or some other type of UI.
Oh, Charles is not found.
Yeah, I guess we got to create Charles.
Let's go ahead and just create him this way, it's probably the easiest way.
All right, try again.
Boom, look at that.
Top scores, Michael scored 1, Charles scored 0, so Charles threw rock, computer threw scissors, that resulted in a win for the player which is Charles.
We got a tree and a sponge, win.
Lightning does not beat the devil, water does not beat humans, but finally the end, humans beat scissors and that takes it.
The game is over and Charles is the winner.
Let's run it again.
At the top you see now Charles and Michael have 1.
One score each in the top score, in the leaderboard there.
Come down here, game is over, the computer won.
Let's try again.
Leaderboard should now be 1, 1, 1.
How come Charles winner, is the winner.
So if we run it this time, Charles now has the global high score.
Pretty amazing.
It might feel like we're kind of playing the same game, but this is totally different, right?
We could put this on a phone app, we could distribute this around the world.
And if we were hosting that website somewhere like Heroku, or Digital Ocean, or Linode, or something like that.
Put it out there, and this would be shared for the world.
Pretty cool.
Hopefully this has inspired you to see what you could build.
I know it's not the super simplest demo, but it's pretty realistic, and it does cover a lot of interesting use cases, and it really opens another world for you guys to build cool applications that are data driven remotely.
|
|
|
show
|
1:44 |
That was a big one, wasn't it?
Quite a bit of stuff we covered there but I hope it was worth it.
I hope you really feel like you have this great, cool power.
What I would like you to attempt with whatever time you have remaining for these 3 days, make it as far as you can, if you don't get done like, no big deal.
Try to create a game, kind of like we did, but do it remotely.
Set it up so you that you can play a game and people can have their high scores and a record of the game and a history and so on, players that can come back and resume playing other games and so on.
If they get some kind of ranking or something right, like experience or points.
One game I had in mind, it's really simple.
Simpler than what we were doing by quite a bit that you could work on is the high, low or guess that number game.
Just goes like this, what's your name?
Pick a number between 0 and 100.
50, too high.
30, too high.
10, too low.
15, too low.
19, boom, you win.
Simple game and you don't even have to write it.
The whole thing actually exists right here, you can grab it but your goal is to move this logic and the persistence to the server.
So hopefully this is a simpler version of what we talked about.
In addition to watching the videos today, if you have extra time, take this high, low game or some other game you want to do and add database persistence to it.
Feel free to borrow heavily from the code that we dropped in there as well on this one, right?
You've got to, remember you've got to create the sequel off of your base, you've got to define the classes, you've got to create the factory, you can just copy that stuff over, change the names of the classes in the columns 'till it works for you.
Okay, so that should be pretty quick, if you rob the code from a previous day that you've already done.
|
|
|
show
|
0:45 |
On the second day, you'll create the web services.
What are the various operations you're going to need to do?
You'll probably have a create and find user, a game status, top scores, play round, that kind of seems like it, but think about how you want that game to play if you chose something other than Hi-Low, well, then I can't really guess, I can't really help you.
You don't need to write any client code, you can just use Postman right here then you can get it right there.
Of course, you use Postman like we did to get it entirely working.
Remember, by the time we even created our client code, we never touched the web app again, it was totally working, and that's partly 'cause I had prepared a few of the tricky bits beforehand, and that's also to a large degree 'cause we tested it out with Postman.
|
|
|
show
|
1:19 |
Final day, Day 99, use Uplink to write a client that then consumes the API.
One thing you'll have to be really careful about is you have to have the flask server running while you run your client game code, because obviously the server has to be running for you to talk to it.
Other than that, right, it's pretty straightforward to use Uplink, you can borrow the code that we wrote, and those little helpers make the code a little bit cleaner.
But use Uplink, or if you'd rather, just use the raw requests code, although it's slightly more cumbersome, but would totally work as well, it's not that big of a difference.
And I probably won't get done early but if you and you feel like, hey, I want to do something bigger, you can jump over here to Heroku, Heroku is like a simple platform, it's a service for, really popular among Python developers, and you follow their getting started guide, you could put this not just on your machine, but you could put it on the internet and play it from your phone, play it from all over the place, share it with your friend, whatever you want to do.
So that's kind of a stretch goal if you happen to get there, but if you don't, don't feel bad about it.
This is a big deal, this is your last major block of three days and so you are almost done with your #100DaysOfCode, it's awesome you made it this far, and I hope you're loving what you're doing.
|
|
|
|
0:45 |
|
|
show
|
0:45 |
Wow, look where you are!
It's Day 100.
This is literally the last day of your #100DaysOfCode.
Congratulations, it's time to freestyle!
You've earned a little bit of freedom.
So is there some project that you've worked on so far that maybe you didn't finish, you really wanted to?
Go back and finish that one.
Is there some derivative type thing you want to create?
Like maybe you'd like a web version of The Wizard game?
Then go build that.
Of course it's your time to freestyle, so if you would rather just go do something totally different, something you wanted explore as part of this journey, here's your final day to go work on that project.
Whatever it is you want to do.
You've earned this, go have fun and celebrate this by working for the final day on something you're super excited about.
|
|
|
|
5:50 |
|
|
show
|
0:30 |
Look at that, you've done 100 days.
You've made it!
Can you believe you've actually done a #100DaysOfCode and completed this entire journey?
Well, your adventure is both done and also just beginning.
Congratulations.
There's so much more code you can write, so many more projects and things that you can start with all the experience you've gained in this course, and I hope you do so, and I hope you share it with us on social media.
We love hear about our students being successful.
|
|
|
show
|
1:21 |
Now, let's just take a moment and reflect upon what you've learned, what you've gotten in this course.
If you've done every one of the 100 Days projects, you have done an incredible amount.
And it's easy to think, well these are just small little things, little tiny projects.
But that's really the secret of software development, is it's just the sum of many, many small projects.
It's not this grand skill that somehow you acquire eventually.
Rather it's, well, what 50 little things do I actually need to know in order to build this website or that mobile app, or this other IoT thing, whatever it is you want to build?
I'd think you've learned so many little things that are going to add up to be really, really powerful for you.
And I just want you to keep this ethos, this I'm going to learn one little thing every day going.
Because one little thing every day continuously will put you right at the top of the software industry, and that's a super-fun place to be.
But you have learned so much, I don't really want to go through all of the details and call them out, but you know, you work with databases, emails, websites, APIs, and so on and so on.
So just take a moment and reflect upon how far you've come and how many things you have gained, but most importantly, just keep learning one thing a day, and it'll do amazing things for you.
|
|
|
show
|
0:28 |
Right now, you're certainly familiar with the GitHub Repository.
That's where all the instructions and the starter code and the data and what not has been for all the 100 Days projects.
But I still want to emphasize one more time: maybe you haven't starred, maybe haven't forked this, I want you to at least go to GitHub and start and probably fork it, so you have a permanent history of this.
You've done 100 days!
You've gone on this entire journey.
Make sure you take the source code with you.
I'm sure you'll find it useful down the line.
|
|
|
show
|
1:07 |
Now that you're just about to complete this class, I want to give you a couple of resources to help you dig deeper and connect further with the community.
First of all, the Talk Python to Me podcast.
You probably know this podcast, maybe you subscribe to it but if you don't, head over to talkpython.fm and check out the podcast.
You will the hear the stories and the people behind so many of the projects that you worked with.
You want to hear about SQLAlchemy?
Well, I had Mike Bayer on the show, who was the guy who created it and continues to maintain it.
Want to learn about contributing to open source?
I did a whole panel on that.
Looking to get your first job in Python?
I actually did a two episode, 12-person panel, both people who just got their jobs and who are hiring managers.
Whatever it is you want to dig deeper into in Python and the community, you can probably find it over here.
Also, stay up on the latest news, check out my other podcast Python Bytes.
Over at Python Bytes, Brian Okken and I share the latest headlines and news in what's hot and what's happening in the Python space.
A great way to keep up on new packages in libraries that maybe you haven't heard of.
|
|
|
show
|
1:12 |
Finishing the 100 Days of Python is both an ending and a start of a great Python journey.
We encourage you to go to PyBites and subscribe to our monthly newsletter.
And keep an eye on the articles, news and code challenges we launch on our website.
We are here to teach you Python.
Of course, we are learning Python ourselves.
It's a never ending journey, and we're super passionate about it.
And we are not planning to stop any time soon.
So, we hope to salute you at PyBites.
Additionally, a couple of months ago, we launched Code Challenges, where we integrated a year of blog challenges.
And we also launched a new line of Bites of Py, which are smaller exercises you can code up in a browser.
We are stoked about this platform.
It's not only teaching you programming and Python, it also shows how to do it in the most Pythonic way.
And we are rapidly expanding this platform adding bites and code challenges.
So this is a great way to keep up the momentum you gained throughout this course by keeping calm and code in Python, every single day.
Good luck and we hope to see you there.
|
|
|
show
|
1:12 |
You made it to the end, congratulations.
I hope you had as much fun inspiration as we had preparing the course and you got practice on a lot of different topics which you can now take to the next level.
And I hope that you keep using Python in your daily work.
Feel free to reach out on Twitter and share what you're working on and good luck on your further Python adventure.
Congratulations on completing the #100DaysOfCode in Python.
This is a huge milestone and huge achievement so you should be very proud.
It's important though to continue coding.
Don't let this be the end.
Make sure just like with any other skill you keep practicing, you keep coding, and you keep working on it and you'll only get better.
So we look forward to seeing all the cool things you come up with going forward.
Make sure to ping us on Twitter and Facebook and wherever else you can think to message us.
As I've said in the course, keep calm and code in Python.
Thank you for taking our course.
It was a pleasure to put it together for you.
We hope you accomplish amazing things with what you've learned here.
If you enjoyed the course, please share it with your coworkers and friends on social media.
Thanks and goodbye.
Thanks and goodbye.
Thanks and goodbye.
|
|
|
|
46:30 |
|
|
show
|
1:25 |
One of the unique concepts in Python is to minimize the number of symbols and control structures in the language.
For example, in C and C-based languages like C# and JavaScript, you have lots of curly braces, and variable declarations and so on, to define structures and blocks.
In Python, it's all about the white space, and indentation.
So here we have two particular methods, one called main and one called run and they both define a code block and the way you do that is you say define the method, (colon), and then you indent four spaces.
So the purple blocks here these are also code blocks and they are defined because they are indented four spaces the "if" and the "else" statement.
But within that "if" statement, we have a colon ending it, and then more indentation, and that defines the part that runs in the "if" case, and then we have the "else" unindented, so that's another piece, another code suite or block, and then we indent again to define what happens when it's not the case that the argument is batch or whatever that means.
And we saw that these are spaces, the convention is to use four spaces for each level of indentation, it's generally discouraged to use tabs.
Now, if you have a smart editor that deeply understands Python, like PyCharm or Sublime text or something like that, it will manage this indentation and those spaces for you, so it's much, much easier in practice than it sounds before you actually get your hands on it.
|
|
|
show
|
0:51 |
Variables are the heart of all programming languages.
And variables in Python are no nonsense.
Let's look at the top one, I am declaring a name variable and assigning it the value of Michael, and age variable and assigning it the variable of 42.
Some languages you have to put type descriptors in the front like you might say string name, integer age, you might put semicolons at the end, things like that.
None of that happens in Python, it's about as simple as it possibly can be.
So we can declare them and assign them to constant values, we can increment their value in this case of the birthday and we can assign them to complex values like the hobby, which is really the list or array of strings, the hobbies that we have.
So we assign these on creation, and we can even take the return values of functions and assign them to these variables, like so.
|
|
|
show
|
1:47 |
Any interesting program has conditional tests and various branching control structures in it.
And many of these control structures you have to pass some kind of test, a boolean, a True or False value.
Go down this path, or don't.
Continue looping through this loop or stop.
Let's talk for a moment about this general idea of True and False in Python; and I am referring to it as truthiness, because in Python all objects are imbued with either a True value or a False value.
And the easiest way to understand this is to think of the list of things that are False, they are clearly spelled out, it's right here- False, the keyword False, the boolean keyword False is false obviously.
But things that might not be so obvious to that are False, are as well, for example any empty sequence, so an empty list, an empty dictionary, an empty set, empty strings.
All of these things are False, even though they point to a real life object.
We also have the zero values being False, so integer zero and floating point zero - False.
Finally, if you have some kind of pointer and it points to nothing, so the keyword none, that is also considered to be False.
Now, there is this small addition where you can overwrite certain methods in your custom types to define False, but outside of this list, and those implementations, everything else is true.
So if it's not in this list and it's not a custom implementation of a magic method that describes the truthiness of an object, you pretty much know the way it works.
Now, in Python, we often leverage this truthiness or falseness of objects, so we might do an "if" test just on a list to see if it's empty, rather than testing for the length of the list to be greater than zero, things like that.
So you'll run into this all the time and it's really important to keep in mind what's True and what's False.
|
|
|
show
|
1:24 |
The most common control flow structure in programming has to be the "if" statement.
Let's see how we do "if" statements in Python.
Here we have a simple console program, probably this bit of code is running in some kind of a loop or something like that, and we are asking the user for input saying "what is your command?", either list the items by typing L or exit from the program by hitting x.
And we capture that string and we say "if", so simple keyword "if"...
some boolean test, so in this case the command is == 'L' so that means is the command equal to L: (colon) and then define what we are going to do in that case.
In this case we are going to list the items, we could do multiple lines, we are just doing one here.
Now we don't say "else if", in Python we say "elif", for short, but then we just have another test, so if it's not L and the command happens to be x, then we are going to exit.
And those are the two options that we are expecting, but if we get something that we don't expect, like "hello there", or empty enter or something like that, we'll be in this final bit here where it says "Sorry, that wasn't understood".
So we start with "if" some kind of boolean expression, and remember, we could just say "if" command: and leverage the truthiness of that value, and that would run if they provided some kind of input at all, but if we want to test for else, we say if command == 'L', we have these additional as many as you want "else if" tests and there is a final optional "else" clause.
|
|
|
show
|
1:31 |
Sometimes within a control structure like if or while loops, things like that, we need to have complex tests tests against more than one variable and negations, things like that.
So, here is a pretty comprehensive example of testing for both multiple values as well as taking over the precedence by using parenthesis and negation using not.
many languages use symbols for this combination, like the C-based languages use double ampersand for and, and exclamation mark for not, those kinds of things.
Python is more verbose and uses the English words.
So here we are going to test for two conditions that both have to be True, it's not the case that x is truthy so x has to be falsie, from the previous discussions, so an empty sequence, None, zero, are False, something like that, and the combination of one of two things- z is not equal to two or y itself is falsie.
So, using this as an example, you should be able to come up with pretty comprehensive conditional statements.
Now, one final note is Python is a short circuiting conditional evaluation language, for example, if x was True, the stuff to the right and the end would not be evaluated.
You might wonder why that matters, a lot of times it doesn't, in this case, nothing really would happen.
Sometimes you want to work with like sub values of an object, so you might test that x is not None, so you would say "if x and x.is_registered" or something like that.
Whereas if you just said x.is_registered, x was None, your app of course would crash.
|
|
|
show
|
1:41 |
In Python we have a fantastically simple way to work with collections and sequences.
It's called the "for...in" loop and it looks like this.
You just say for some variable name in some collection, so here we have "for item in items" and that creates the variable called item and we are looping over the collection items, it just goes through them one at a time, so here it will go through this loop three times, first time it will print the item is "cat", the second time it will print the item is "hat" and then finally the item is "mat".
And then it will just keep going, it will break out the loop and continue on.
Some languages have numerical "for" loops, or things like that, in Python there is no numerical "for" loop, there is only these for in loops working with iterables and sequences.
Because you don't have to worry about indexes and checking links and possible off-by-one errors, you know, is it less than or less than or equal to, it goes in the test in the normal "for" loop.
This is a very safe and natural way to process a collection.
Now, there may be times when you actually need the number, if you want to say the first item is "cat", the second item is "hat", the third item is "mat", this makes it a little bit challenging.
Technically, you could do it by creating an outside variable, and incrementing, but that would not be the proper Pythonic way.
The Pythonic way is to use this enumerate function, which takes a collection and converts it into a sequence of tuples where the first element in the tuple is this idx value, that's the index, the number.
And the second item is the same value that you had above.
So first time through its index is zero, item is cat; second time through, index is one, item is hat, and so on.
So these are the two primary ways to loop over collections in Python.
Remember, if you need to get the index back, don't sneak some variable in there, just use enumerate.
|
|
|
show
|
0:59 |
Functions are reusable blocks of functionality.
And of course, they play an absolutely central role in Python.
Now, in Python we can have functions that are just stand alone, isolated functions, and these are quite common, or we can have functions bound to classes and objects that bind together specific data about an object along with those behaviors, we call those methods.
The way we define them, interact with them, is basically the same, regardless whether they are functions or methods.
Here you can see we have a main method, we want to call it, it takes no parameters, and returns nothing or nothing that we care about, so we just say main open close parenthese, like so, we can also call functions that take arguments, here is a function called input, and it gathers input from the user, on the consoles, it will give them a prompt, and this argument we are passing here is a string, and this is the prompt to share to the user, pauses the input on the console and waits for them to type something and hit enter, when they do, the return value comes back and is stored in this new variable called "saying".
|
|
|
show
|
1:33 |
You just saw how to call functions.
Now let's really quickly cover how to create functions.
Now, I should say right when we get started that there is a lot of flexibility, more than most languages in Python functions and methods, and so we are just going to scratch the surface here, and not really get into all the details.
So the keyword to define functions is def.
We always start with def and then some function name and regardless whether these are methods in classes or standalone functions, def is the keyword and then we say the name, and then we have a variety of arguments or if we have no arguments, we can just leave this empty.
But here we have two positional required arguments, we could also make these optional by specifying default values, we can create what are called named arguments where you have to say the name of the argument to pass the value instead of using the position.
We can also take additional extra arguments that the method was not necessarily designed for, but, like I said, we are not going to dive too deeply into those, here is the basic way to define the method- def, name, parenthesis arguments and then colon to define the block that is the method.
Here we would probably do something like validate the arguments like throw some kind of ValueError or something, if name is None or email is None, something like that.
Then we are going to do our actual logic of the function, create it using the database and here we are going to somehow get that information back and to this db_user, maybe we want to tell whoever called create_user the id of the new user that was just created, so we'll use a return value and we'll return the id that was the database generated id for when we create this user.
|
|
|
show
|
1:20 |
Working with files in Python, especially text files is something that you are likely to need in your application.
So let's take a really simple example.
Here we are going to create a file, we have three items in our data structure we want to save on the three separate lines, so we have cat, hat, mat and a list, and these are just strings.
We are going to use the "open" method, and the "open" method takes a file name and a modifier, and then this "open" method, the open string that comes back can be used as a context manager, so we are putting into a "with" block, and naming the variable fout for file output, and this automatically closes the file stream, as soon as we leave this with block.
So that's really nice and safe, makes sure we flush, it close it, all those kinds of things.
Once we get the file open, we are going to loop over each item and we are just going to say "fout.write" and pass it the item, so cat, hat or mat.
Now, write does not append a new line, it just writes characters to the file, so we want to say "\n" to append a new line, so each one of these items up here is on a separate line in the file.
And notice this "w" modifier, this means write only and truncate the file if it exists.
We could also say "a" for append, "a+" for create an append or "r" if we just wanted to read from the file but not write to it.
There is also a "b" modifier for binary files, but you'll use that less often.
|
|
|
show
|
1:59 |
Packages and modules must be imported in Python before they can be used.
It doesn't matter if it's in external package of the package index, in module from the standard library or even a module or package you yourself have created, you have to import it.
So code as it's written right here likely will not work, you will get some kind of NameError, "os doesn't exist, path doesn't exist".
That's because the os module and the path method contained within it have not been imported.
So we have to write one of two statements above, don't write them both, one or the other.
So, the top one lets us import the module and retains the namespace, so that we can write style one below, so here we would say os.path.exist so you know that the path method is coming out of the os module.
Alternatively, if you don't want to continue repeat os.this, os.that, and you just want to say "path", you can do that by saying this other style, from os import path.
And then you don't have to use the namespace, you might do this for method used very commonly whereas you might use style one for methods that are less frequently used.
Now, there is the third style here, where we could write "from os import *", that means just like the line above, where we are importing path, but in fact, import everything in the os module.
You are strongly advised to stay away from this format unless you really know what you are doing, this style will import and replace anything in your current namespace that happens to come out of the os.
So for example, if you had some function that was called register, and maybe there is a register method inside os module, this import might erase your implementation, depending where it comes from.
So, modules must be imported before you use them, I would say prefer to use the namespace style, it's more explicit on where path actually comes from, you are certain that this is the path from the os module, not a different method that you wrote somewhere else and it just happens to have the same name.
Style two also works well, style three- not so much.
|
|
|
show
|
1:54 |
You'll hear it frequently said that Python is an ecosystem or a language that comes with batteries included, and what that means is you don't have to start with a little bit of Python and pull in a bunch of different pieces from here and there and implement your own version of this algorithm or that feature.
Oftentimes, the things you need are built already into Python.
You should think this batteries included is kind of like an onion with many layers, so at the core, the language itself is quite functional and does many things for us, the next shell out is the standard library, and in the standard library we have file io, regular expressions, HTTP capabilities, things like that.
In the next shell outside of that are all of the packages and external projects written for and in Python, so for example when we want to add credit card capabilities to our website, we are going to reach out and grab the stripe Python package.
The web framework we are using itself, is built around many packages, centered around Pyramid, the database access layer is SQLAlchemy.
Everything I just named does not come included in Python, but is in the broader ecosystem.
If it's in the broader ecosystem and it is a package or library for Python developers to use, chances are extremely high you will find it in this place called the Python Package Index, which you can find at pypi.org.
Notice that there are over 88 thousand packages at PyPi.
This means, you can go on and type something in that search box, and there is a very good chance that what you are looking for will return a bunch of results that you can then grab one of them, install into your environment and then use in your project.
So here is what you do- when you think you need some piece of functionality or some library, before you go to start and write that yourself, do yourself a favor and do a few searches at pypi.org, and see if there is already a really great open source project or package that supports it.
|
|
|
show
|
2:26 |
Now that we saw there is over 88 thousand packages at pypi.org, we can just grab and bring into our projects and add great functionality HTTP processing, web services, web frameworks, database access, you name it, the question becomes how do we get those form pypi into our system or, any distributable package even if we actually just have a zip file of the contents, and the answer is pip.
pip knows about the Python Package Index and when we type "pip install" a package, here we are typing "pip install requests", one of the most popular packages in Python, which is an HTTP client, pip will go and look in a certain location on the Python Package Index.
And here you can see it found it, it downloaded version 2.9.1 and it unzipped it, installed it in the right location, cleaned everything up, beautiful.
So, this is how we install something on the command line, if you need to install it machine-wide, you will likely have to do "sudo pip install requests" or alternatively on Windows, you will have to running in a command line that is running as administrator.
Now, be aware, you really want to minimize doing this because when you install one of these things it runs the setup.py file that comes with the package that thing can have anything at once in it, and it could do anything that that package want to do to your machine, really, you are running as admin some sort of untrusted code, so be aware and try to install it locally, but if you've got to install it machine-wide, this is how you do it.
If you have Python 3.3 or earlier, you probably don't have pip.
Some of the new versions of Python 2 do have it, but most of the versions of Python 2 also don't have pip, so if you need to get pip, just follow this link and install it, then you carry on in exactly the same way.
All the newer versions, Python 3.4, and later come with pip included, which is excellent.
If you are using PyCharm, PyCharm has a really great support for pip as well, here you can see under the preferences tab, we found the project interpreter and you can see it's listing a bunch of packages, a version and the latest version, some of them have little blue arrows, indicating that we are using an older version rather than a newer version.
So we could actually upgrade it.
The little up arrow in the bottom left, once you select something will let you upgrade it and the plus will pull up a listing like a little search box that you can explore all those 88 thousand packages and more.
So if you are using PyCharm, there is a really nice way to see what packages are installed in your active environment and manage them.
|
|
|
show
|
3:53 |
One of the challenges of installing packages globally has to do with the versioning.
The other really has to do with managing deployments and dependencies.
Let's talk about the versioning part first.
Suppose my web application I am working on right now requires version 2.9 of requests.
But somebody else's project required an older version with older behavior, version 2.6 let's say.
I don't think those are actually incompatible, but let's just imagine that they were.
How would I install via pip version 2.6 and version 2.9 and keep juggling those, how would I run those two applications on my machine without continually reconfiguring it- the answer is virtual environments.
And, virtual environments are built into Python 3 and are also available through a virtual env package that you can install for Python 2 and the idea is this- we can crate basically a copy, change our paths and things like that around so that when, you ask for Python or this looks for Python packages, it looks in this little local environment, we create one of these small environments just for a given application, so we would create one for our web app that uses request 2.9 and another one for the one that uses request 2.6 and we would just activate those two depending on which project we are trying to run, and they would live happily side by side.
The other challenge you can run into is if you look at what you have installed on your machine, and you run some Python application and it works, how do you know what listed in your environment is actually required to run your app, if you need to deploy it or you need to give it to someone else, that could be very challenging.
So with virtual environments we can install just the things a given application requires to run and be deployed so when we do something like "pip list", it will actually show us exactly what we need to set up and use for our app to run in production.
Typically we tie virtual environments one to one to a given application.
So how do we create one?
This example uses virtual env which we would have to install via pip, you could also use venv, just change virtual env to venv in Python 3 and it will have the same effect, but this works, like I said in Python 2 and 3, so here you go.
So we are going to run Python 3 and we are going to say run the module, virtual env, and create a new environment into ./localenv.
Here you can see it creates a copy from Python 3.5.
Then we go into that environment, there is a bin directory and there is an activate program that we can run and notice, we'll use the .
(dot) to apply that to this shell and not to create a new separate shell environment for that when it runs because we wanted to modify our shell environment, not a temporary one.
So we say .
activate and that will actually change our environment, you can see the prompt change, if we say "pip", we get the local pip, if we ask "which Python", you'll see it's this one that is in my user profile not the one in the system.
Now, few changes for Windows, if I did exactly the same thing in Windows, I would have .\localenv of course, I might not use Python 3, I just say Python and make sure I have the right path to Python 3 because that is not a feature in the Python 3 that comes on Windows, and I wouldn't use the source activate you don't need to do that in Windows, but you would call activate.bat, otherwise, it's pretty much the same.
Also, the "which" command doesn't exist on Windows, use "where" and it gives you the same functionality.
So we can create one of these virtual environments in the terminal, but you might suspect that PyCharm has something for us as well, and PyCharm actually has the ability to create and manage virtual environments for us, basically it does what you just saw on the screen there.
So here we give it a name, we give it a location here, we say blue_yellow_Python, this is going to be for a Blue / Yellow band web application, we are going to base this on Python 3.5.1 and we are going to put into my Python environments and under this name.
Then I just say OK and boom, off it goes, set it as the active interpreter and manage it just the same as before in PyCharm using its ability to install packages and see what is listed and so on.
|
|
|
show
|
2:53 |
Python has this really interesting concept called slicing.
It lets us work with things like lists, here in interesting ways.
It lets us pull out subsets and subsequences if you will, but it doesn't just apply to lists, this is a more general concept that can be applied in really interesting way, for example some of the database access libraries, when you do a query what you pulled back, you can actually apply this slicing concept for eliminating the results as well as paging and things like that.
So let's look at slicing.
We can index into this list of numbers like so, we just go to nums list and we say bracket and we give the index, and in Python these are zero-based, so the first one is zero, the second one is one and so on.
This is standard across almost every language.
However, in Python, you can also have reverse indexes so if I want the last one, I can say minus one.
So this is not slicing, this is just accessing the values.
But we can take this concept and push it a little farther.
So if I want the first four, I could say 0:4 and that will say start at the 0th and go up to but not including the one at index 4.
So we get 2, 3, 5, 7, out of our list.
Now, when you are doing these slices, any time you are starting at the beginning or finishing at the end, you can omit that, so here we could achieve the same goal by just saying :4, assuming zero for the starting point.
So, slicing is like array access but it works for ranges instead of for just individual elements.
Now if we want to get the middle, we can of course say we want to go from the fourth item, so index 3, remember zero-based, so 3 and then we want to go up to but not including the sixth index value, we could say 3:6 and that gives us 7, 11 and 13.
If we want to access items at the end of the list, it's very much like the beginning, we could say we want to go from the sixth element so zero-based, that would be 5 up to the end, so 5:9 and it would be 13, 17, 19, 23, but like I said, when you are either starting at the beginning or ending at the end, you can omit that number, which means you don't have to compute it, that's great, so we could say 5: and then it'll get the last one.
But you still need to know where that starts, if we actually wanted 4, so there is a little bit of math there, if you just want to think of it starting at the end and give me a certain number of items, just like where we got the last prime and that came back as 23 when we gave it a minus one, we can do something similar for slicing and we could say I'd like to go start 4 in from the back, so negative 4 and then go to the end.
So that's the idea of slicing, it's all about working with subsets of our collection here, the example I gave you is about a list, but like I said we could apply this to a database query, we could apply this to many things in Python and you can write classes that extend this concept and make it mean whatever you want, so you'll find this is a very useful and common thing to do in Python.
|
|
|
show
|
1:43 |
Tuples are a lightweight, immutable data structure in Python that's kind of like a list but that can't be changed once you create them.
And you'll see many very cool techniques that make Python readable and easy to use are actually clever applications of tuples.
On the first line here, we are defining a tuple m, the way you define a tuple is you list out the values and you separate them by commas.
When you look at it, it appears like the parenthesis are part of the definition, and when you print tuples you'll see that the parenthesis do appear but it's not actually the parenthesis that create them, it's the commas.
We want to get the value out over here we want to get the temperature, which is the first value, we would say m[0], so zero-based index into them.
If we want the last value, the fourth one, we would say m[3], that's the quality of the measurements.
Notice below we are redefining m, this time without the parentheses, just the commas and we print it out and we get exactly the same thing again, so like I said, it's the commas that define the tuple not the parentheses, there is a few edge cases where you will actually need to put the parentheses but for the most part, commas.
Finally, tuples can be unpacked, or assigned to a group of variables that contain the individual values.
So down here you can see we have a "t" for temperature, "la" for latitude "lo" for longitude, and "q" for quality, and those are the four measurements in our tuple, we want to assign those and instead of doing like we did above where you index each item out and assign them individually, we can do this all in one shot, so here we can say variable, four variables separated by commas equals the tuple, and that reverses the assignment so you can see "t" has the right value of 22, latitude 44, longitude 19 and the quality is strong.
|
|
|
show
|
1:44 |
In the previous section we discussed tuples, and how they are useful.
Sometimes these anonymous tuples that we discussed are exactly what you need, but oftentimes, it's very unclear what values are stored in them, especially as you evolve the software over time.
On the second line here, we have "m", a measurement we are defining this time it's something called a named tuple and just looking at that definition there on what we are instantiating the measurement, it's not entirely clear the first value is the temperature, the second value is the latitude, this third value is a longitude, and so on.
And we can't access it using code that would treat it like a plain tuple, here we say the temperature is "m" of zero which is not clear at all unless you deeply understand this and you don't change this code, but because we define this as a named tuple, here at the top we define the type by saying measurement is a collections.namedtuple, and it's going to be called a measurement, for error purposes and printing purposes and so on, and then you define a string which contains all the names for the values.
So over here you are going to say this type of tuple temperature's first, then latitude, then longitude, then quality, and what that lets us do is access those values by name.
So instead of saying "m" of zero temperature, we say m.temp is the temperature, and the quality is m.quality.
Named tuples make it much easier to consume these results if you are going to start processing them and sharing them across methods and things like that.
Additionally, when you print out a named tuple it actually prints a friendlier version here at the bottom you see measurement of temperature, latitude, longitude, and quality.
So most of the time if you are thinking about creating a tuple, chances are you should make a named tuple.
There is a very small performance overhead but it's generally worth it.
|
|
|
show
|
2:01 |
Classes and object-oriented programming are very important parts of modern programming languages and in Python, they play a key role.
Here we are creating a class that we can use in some kind of game or something that works with creatures.
So to create a creature class, you start with the keyword class, and then you name the type and you say colon and everything indented into that block or that code suite to do with the class is a member of the class.
Most classes need some kind of initialization to get them started, that's why you create a class, we want them to start up all ready to go and bundled up with their data and then combine that with their methods, their behaviors and they make powerful building blocks in programming.
So most classes will have an initializer, and the initializer is where you create the variables and validate that the class is getting setup in correct way, for example making sure the name is not empty, the level is greater than zero, but less than a 100, something like that.
Now this is often refered to as __init__ sometimes just init, or even a constructor and these dunder methods because they have double underscores at the beginning and at the end, they are part of the Python data model which lets us control many things about classes, so you'll see a lot of methods like this but the __init__ method is probably the most common on classes.
If you want to create behaviors with your class, and if you have a class that's almost certainly part of what you are going to do, you are going to define methods just like functions that are standalone, methods or functions that are parts of classes and you define them in exactly the same way, the only difference is typically they take a self parameter, the self parameter is passed explicitly everywhere when you are defining the class, some languages have a "this" pointer, that's sort of implicit but in Python, we call this self and it refers to the particular instance of the creature that exists, you might have many creatures but the self is the one that you are working with currently.
So just be aware you have to pass that explicitly everywhere unless you have what is called a class method or a static method.
|
|
|
show
|
1:44 |
When you are new to object-oriented programming, the idea of classes and objects often can seem interchangeable and some people use them interchangeably; that's not really correct and so let's take just a moment and really clarify the relationship and differences between classes and objects.
So here we have a Creature class, you can it has an initializer and a walk method, and notice that the walk method does something different if the creature is powerful, if its power is greater than 10 versus if it's lower.
This class is a blueprint for creating creatures.
We could create a squirrel, we could create a dragon, we could create a tiger, and those would all be specific objects or instances of the Creature class.
So down here we’re going to create a squirrel and a dragon, and notice the squirrel is created with power 7, the dragon is created with power 50.
Now these are both creatures, but they are now distinct things in memory.
Objects are created via classes and the squirrel object is somewhere in memory and it has a power 7 and it has this walk behavior it gets from its class, but all of its variables are specific to it.
We have also the dragon creature, with its own variables, so it's power is 50 and if we change its power, it won't change the squirrel or any other creature, just the dragon.
And when we call squirrel.walk(), the squirrel is going to walk in some specific way based on its own power.
So you can see the Creature class test is a power greater than 10 or less than 10 and if it's greater than 10, it does something special, maybe it walks in a powerful way versus a non-powerful way, who knows, but that will mean the squirrel walks in one way and the dragon walks in another way, even though they are both instances of the Creature class.
So I hope that clears up the relationship between classes and objects.
|
|
|
show
|
1:49 |
A key design feature for working with classes and object-oriented programming is modeling and layers, going from the most general to the most specific.
So, we started with a creature class, and a creature class has a name and a level and it's just a generic creature, it could be anything, so it could be a squirrel as we saw, it could be a dragon, it could be a toad.
Any kind of creature we can think of, we could model with the original creature class, and that's great because it's very applicable but there are differences between a dragon and a toad, for example, maybe the dragon breathes fire, not too many toads breed fire, and so we can use inheritance to add additional specializations to our more specific types, so we can have a specific dragon class, which can stand in for a creature, it is a creature but it also has more behaviors and more variables.
Here we have our initializer, the __init__ and you see we take the required parameters and data to pass along to the creature class, in order to create a creature, in order for the dragon to be a creature, it has to supply a name and a level, so we can get to the creature's initializer saying super().__init__ and pass name and level and that allows the creature to do whatever sort of setup it does when it gets created, but we also want to have a scale thickness for our dragon, so we create another field specific only to dragons, and we say self.scale_thickness = whatever they passed in.
So in addition to having name and level we get from Creature, we also have a scale thickness, so that adds more data we can also add additional behaviors, here we have added a breed_fire method.
So the way we create a derived type in Python, is we just say class, because it is a class, the name of the class, Dragon, and in parenthesis the name of the base type.
And then, other than that, and using "super", this is basically the same as creating any other class.
|
|
|
show
|
0:53 |
By leveraging inheritance, we can crate a wide range of types that model our world very well, in this example on the screen we have a wizard and the wizard knows how to battle a variety of creatures, we have small animals that are easier to defeat, we have standard creatures, we have dragons, we have wizards.
All of these types are derived from the creature type.
Now, the wizard class, you can see, can attack any of these creatures, and the reason the wizard class can attack them is it's built, it's programmed to understand what a creature is and attack it and any of the derived classes can be used interchangeably.
So this means we can continue to evolve and generate new and interesting creature derived types and we don't have to change our wizard code to understand how to battle them.
That's great, polymorphism is essential in any object-oriented language, and that's absolutely true in Python as well.
|
|
|
show
|
2:30 |
Dictionaries are essential in Python.
A dictionary is a data structure that very efficiently stores and can rapidly look up and retrieve items by some kind of key.
You can think of this as kind of a primary key in a database or some other unique element representing the thing that you want to look up.
Dictionaries come in a couple of forms, the form you see on the screen here we put multiple related pieces of information together that we can lookup, so here maybe we have the age of a person and their current location.
Other types of dictionaries are maybe long lists of homogeneous data maybe a list of a hundred thousand customers and you can look them up by key which is say their email address, which is unique in your system.
Whichever type you are working with, the way they function is the same.
We can create dictionaries in many ways, three of them here are on the screen; the first block we initialize a dictionary by name and then we set the value for age to 42, we set the location to Italy.
We can do this in one line by calling the dict initializer and pass the key value argument, we can say dict age and location or we can use the language syntax version, if you will, with curly braces and then key colon value, and it turns out all three of these are equivalent, and you can use whichever one makes the most sense for your situation, so here the created and then populated, here created via the name and keyword arguments or here created via the language structures.
The fact that this is so built-in to the language to tell you dictionaries are pretty important.
Now, if we want to access an item, from the dictionary, we just use this index [ ] and then we pass the key whatever the key is.
In this case, we are using the location or the name of the property we are trying to look up so we are asking for the location.
My other example if we had a dictionary populated with a hundred thousand customer objects, and the keyword is the email address, you would put in the email for the specific customer you are looking for.
Now, if we ask for something that doesn't exist, this will crash with a KeyError exception, so for example if I said "info['height']", there is no height, so it will crash.
there is a wide range of ways in which we can get the value out or check for the existence of a value, but the most straightforward is to use it in this "in" operator, so here we can test whether age is in this info object we can say "if age in info" and then it's safe to use info of age.
So this is just scratching the surface of dictionaries, you'll see that they appear in many places and they play a central role to many of the internal implementations in Python, so be sure to get familiar with them.
|
|
|
show
|
2:38 |
The primary way error handling is done in Python is exceptions.
Exceptions interrupt the regular flow, execution of your methods and your code, and unwind and stop executing a code until they find what's called an except clause, that is the explicit error handling that you've written, or if they never find one, your application just crashes.
That's not amazing, so let's talk about error handling.
Here we have three methods on the screen, method one, two and three, and maybe there are potentially error-prone, something can go wrong, maybe work with the file system, a web service, a database, things that are not always well known or can't rely on them always working.
It could even just be that someone's input incorrect data and there is going to be a problem there as well.
So if we want to make sure that when we run these bits of code, we can catch and handle those errors, we have to put this into what's called a "try...except" block.
So we put a "try:", we indent the code, so it is part of the try block, then we add the error handling the except block and it could just be except: an empty catch-all, which is not really recommended.
In this case, we are going to catch a particular type of exception, one of the most based types that we'll catch many of the errors that we might not expect, so we'll just say "Exception as x".
We say as x then we can get a hold of the actual object that is the exception and ask it what went wrong.
So, look at the error message, if this is a custom database error, maybe it has the record id that caused the problem, or something like that, who knows.
It depends on the type of exception that you get.
So here is a general one, but we're only handling errors in a general way, we can't handle say database exceptions differently than web service exceptions, so we can have multiple except blocks with multiple exception types, and Python will find the most specific one, so if we want to make sure that we can catch when we have a connection error, trying to talk to a web service or something on the network, and it won't connect, we might want to handle that differently than say the users typed in something incorrect.
So we would add another except clause with the more specific type.
The order of these except blocks is really important, the way it works, is Python will try to run the code, if an exception comes up, it will just go through and ask does this exception object derived from the first thing it finds, and the next, and the next, and if the first one answers yes to, it will just stop and that's the error handling at run.
So if we switch these, almost everything including connection error derives from exception, so it would run the code, throw the exception and ask, hey, does this exception derive from exception, yes, boom handle the general error and it will never make it to the connection error so it has to go from most specific error handling to least or most general error handling.
|
|
|
show
|
2:09 |
In Python, functions are first class citizens, and what that means is they are represented by a class instances of them, particular functions are objects they can be passed around just like other custom types you create just like built-in types, like strings and numbers.
So we are going to leverage that fact in a simple little bit of code I have here called find significant numbers.
Now, maybe we want to look for all even numbers, all odd numbers, all prime numbers, any of those sorts of things.
But this function is written to allow you to specify what it means for a number to be significant, so you can reuse this finding functionality but what determines significance is variable, it could be specified by multiple functions being passed in and that's what we are calling predicate because this ability to pass functions around and create and use them in different ways especially as parameters or parts of expressions, Python has this concept of lambdas.
So let's explore this by starting with some numbers, here we have the Fibonacci numbers and maybe we want to find just the odd Fibonacci numbers.
So we can start with the sequence and we can use this "find significant numbers" thing along with the special test method we can write the checks for odd numbers.
So, in Python we can write this like so, and we can say the significant numbers we are looking for is...
call the function, pass the number set we want to filter on and then we can write this lambda expression instead of creating the whole new function.
So instead of above having the def and a separate block and all that kind of stuff, we can just inline a little bit of code, so we indicate this by saying lambda and then we say the parameters, there can be zero, one or many parameters, here we just have one called x, and we say colon to define the block that we want to run, and we set the expression that we are going to return when this function is called, we don't use the return keyword we just say when you call this function here is the thing that it does in return, so we are doing a little test, True or False, and we ask "if x % 2 == 1" that's all the odd numbers, not the even ones, so when we run this code it loops over all the Fibonacci numbers runs a test for oddness and it pulls out as you can see below just the odd ones, for example 8 is not in there.
|
|
|
show
|
2:57 |
Python has a great declarative way to process a set of items and either turn it into a list, a dictionary, a set or a generator.
Let's look at the list version through an example.
Here we have some get_active_customers method, maybe it goes to a database, maybe it just goes to some data structure, it doesn't really matter, but it comes back with an iterable set of users, so we could loop over all of the users, using a "for...in" loop to find the users who have paid today and get their usernames and put that into a list.
So what we do is we create a list, some name paying usernames and we'd "for...in" over those to loop over all of them and then we do a test, we'd say if that particular user's last purchase was today then append to their username to this paying usernames list.
And then in the end, we'd have a list, which is all the usernames of the customers you bought something from us today.
This would be an imperative users' search, an imperative style of programming, where you explicitly say all the steps, let's see how we could do this instead with the list comprehension.
Here you'll see many of the same elements, and it looks like we are declaring a list, so [ ] in Python means declare an empty list, but there is stuff in the middle.
The way you read this you kind of got to piece it together, maybe top to bottom is not necessarily the best way to put this all together but let's go top to bottom for a minute and then I'll pull out the pieces for you.
So, we are going to get the name of the user, and we are going to later introduce a variable called "u", which is the individual user for the set we are going through, so we'd say u.name, that's like our projection that we want, and there is a "for...in" statement, like we had before, where we get the active customers and we are going to process them, and then there is some kind of test whether or not that particular user should be in this set.
So, we set the source, that's going to be out get_active_customers and we are going to express that we are iterating over that for "u" in that set and "u" declares the local variable that we are going to work with, we are going to filter on that with an "if" test, and finally we are going to do some kind of projection, we could just say "u" to get all the users, here we want all the usernames so we say u.name.
Now, there are multiple structures like this in Python, we could have parenthesis that would generate a generator, but as I said before, [ ] represents list, and so when you have the [ ] here, you know what is going to come out is a list, and this is a list comprehension.
Once you get used to it, you'll find this style of programming is a little cleaner and a little more concise.
It's also different in another important way, because this can be just part of a larger expression, this could be say in inline argument to a method you are calling.
Or, you could chain it together with other comprehensions, or other types of processing.
The imperative style of programming required separate language structures that required their own blocks, so you can't really compose "for...in" loops but you can compose these comprehensions which makes then really useful in places the "for...in" loop wouldn't be.
|
|
|
show
|
0:46 |
So you've reached the end of the Python refresher and reference, if you feel like you still need more help getting started with Python, you want to practice more, dig much more into the language features that we just talked about, then please consider my Python Jumpstart By Building Ten Apps course.
You can find it at talkpython.fm/course, and it covers almost exactly the same set of topics that we covered in the refresher as well as more, but it does it by building ten applications, seeing them in action, writing tons of code and it's done over seven hours, rather than packing just the concepts into a quick refresher.
So, check out the Jumpstart Course, if you want to go deeper into Python the language and its features so that you can get the most out of this course.
|